B. Christiansen, C. Buchholz, F. Buchholz, X. Chi, S. Christiansen, A. Denda, E.
Fabrizius, H. Hauss, H.J.T. Hoving, S. Janßen, M. Kaufmann, A. Kronschnabel, A.
Lischka, F. Lüskow, B. Martin, V. Merten, P. Silva, N. Pinheiro, B. Springer, S. Zankl, T. Zeimet
Editorial Assistance:
DFG-Senatskommission für Ozeanographie
MARUM - Zentrum für Marine Umweltwissenschaften Bremen
2016
MARIA S. MERIAN-Berichte
SEAMOX: The Influence of Seamounts and Oxygen Minimum Zones on Pelagic Fauna in the Eastern Tropical Atlantic
Cruise No. MSM49
November 28 - December 21, 2015
Las Palmas de Gran Canaria (Spain) - Mindelo (Republic of Cape Verde)
The MARIA S. MERIAN-Berichte are published at irregular intervals. They are working papers for people who are occupied with the respective expedition and are intended as reports for the funding institutions. The opinions expressed in the MARIA S. MERIAN-Berichte are only those of the authors.
The MARIA S. MERIAN expeditions are funded by the Deutsche Forschungsgemeinschaft (DFG) and the Bundesministerium für Bildung und Forschung (BMBF).
Editor:
DFG-Senatskommission für Ozeanographie
c/o MARUM – Zentrum für Marine Umweltwissenschaften Universität Bremen
Leobener Strasse 28359 Bremen
Author:
Dr. Bernd Christiansen Telefon:+49-40-42838-6670
Universität Hamburg Telefax:+49-40-42838-6678
Institut für Hydrobiologie und E-Mail: bchristiansen@uni-hamburg.de Fischereiwissenschaft
Große Elbstraße 133 22767 Hamburg
Citation: B. Christiansen, C. Buchholz, F. Buchholz, X. Chi, S. Christiansen, A. Denda, E. Fabrizius, H. Hauss, H.J.T. Hoving, S. Janßen, M. Kaufmann, A. Kronschnabel, A. Lischka, F. Lüskow, B.
Martin, V. Merten, P. Silva, N. Pinheiro, B. Springer, S. Zankl, T. Zeimet (2016) SEAMOX: The Influence of Seamounts and Oxygen Minimum Zones on Pelagic Fauna in the Eastern Tropical Atlantic - Cruise No. MSM49 – November 28 – December 21, 2015 – Las Palmas de Gran Canaria (Spain) – Mindelo (Republic of Cape Verde). MARIA S. MERIAN-Berichte, MSM49, 42 pp., DFG- Senatskommission für Ozeanographie, DOI:10.2312/cr_msm49
_________________________________________________________________________________
ISSN 2195-8483
Table of Contents
1 Summary 2
2 Participants 3
3 Research Programme 4
4 Narrative of the Cruise 5
5 Preliminary Results 7
5.1 Water Column Characteristics 7
5.1.1 Profiles of Temperature, Salinity, Oxygen, Fluorescence 7 5.1.2 Underway Measurements with Vessel Mounted ADCP 13
5.2 Particulate Organic Matter and Phytoplankton 15
5.2.1 POM and Nutrients 15
5.2.2 Phytoplankton 15
5.3 Zooplankton and Micronekton 18
5.3.1 Standing Stocks, Distribution, Composition and Size Structure of
Zooplankton and Micronekton from Net Hauls 18
5.3.2 Distribution, Composition and Size Structure of Meso- and
Macrozooplankton from Optical Samplers (PELAGIOS and UVP) 23 5.3.3 Gelatinous Meso- and Macrozooplankton Around the Cape Verde
Islands 25
5.3.4 Krill, an Indicator: Distribution and Trophic Position of Euphausiids
28 30 33
7 36
8 39
9
in Relation to Oxygen Depletion and Topography
5.3.5 Diversity, Standing Stocks and Distribution of Mesopelagic Fishes 5.4 Trophic Ecology of Pelagic Communities and Seabirds
Station List MSM49
Data and Sample Storage and Availability
Acknowledgements 40
10 References 40
MARIA S. MERIAN-Berichte, Cruise MSM49, Nov 28 - Dec 21, 2015, Las Palmas - Mindelo 2
1 Summary
Cruise MSM49 focused on the impact of the oxygen minimum zone (OMZ) and of a shallow topo- graphic feature, Senghor Seamount, on the abundance, distribution, diversity and trophic struc- ture of the medium-sized pelagic fauna (macrozooplankton, micronekton, and squids). Using a combination of optical and multiple net systems, the ecological zonation of these oceanographic features in the Cape Verde area was investigated and collections for detailed foodweb studies were performed. A total of 10 stations to the north, east and south of the Cape Verde archipelago were sampled, including the Cape Verde Ocean Observatory (CVOO), Senghor Seamount summit and middle slopes, a cyclonic eddy, and oceanic stations with differing intensities of the OMZ. Pre- liminary results show that organisms were abundant in the oxygen-poor layers; the communities there were apparently dominated by gelatinous zooplankton. Pelagic communities differing from the surrounding ocean were observed at Senghor Seamount and in the core of the cyclonic eddy.
Zusammenfassung
Gegenstand der Reise MSM49 war der Einfluss von Sauerstoffminimumschichten (OMZ) und eines flachen Seebergs, Senghor Seamount, auf die Abundanz, Verteilung, Diversität und trophi- sche Struktur der mittelgroßen pelagischen Fauna (Makrozooplankton, Mikronekton und Kalma- re). Mit einer Kombination aus optischen Systemen und Mehrfachnetzen wurde die ökologische Zonierung der ozeanographischen und topographischen Strukturen im Bereich der Kapverdischen Inseln untersucht, und es wurden Proben für detaillierte Nahrungsnetzuntersuchungen genommen. Insgesamt konnten 10 Stationen im Norden, Osten und Süden der Kapverdischen Inseln beprobt werden. Dazu gehörten Stationen am Cape Verde Ocean Observatory (CVOO), an den mittleren Hängen und dem Gipfel des Senghor Seamount, in einem zyklonischen Eddy sowie ozeanische Stationen mit unterschiedlicher Intensität der OMZ. Vorläufige Ergebnisse zeigen, dass auch in den sauerstoffarmen Schichten Organismen häufig waren und die pelagischen Gemeinschaften dort von gelatinösem Zooplankton dominiert wurden. Am Senghor Seamount und im Kern des zyklonischen Eddys wurden pelagische Gemeinschaften beobachtet, die sich von denen des um-gebenden Ozeans unterschieden.
MARIA S. MERIAN-Berichte, Cruise MSM49, Nov 28 - Dec 21, 2015, Las Palmas - Mindelo 3
2 Participants
Name Discipline Institution
Christiansen, Bernd, Dr. chief scientist UHH-IHF
Buchholz, Cornelia, Dr. krill/MOCNESS AWI
Buchholz, Friedrich, Prof. krill/MOCNESS AWI
Chi, Xupeng gelatinous zooplankton GEOMAR
Christiansen, Svenja zooplankton/UVP, PELAGIOS GEOMAR Denda, Anneke, Dr. zooplankton, micronekton/MOCNESS UHH-IHF
Fabrizius, Eduard technics GEOMAR
Hoving, Hendrik J.T., Dr. macrozooplankton/PELAGIOS GEOMAR
Janßen, Silke technics/MOCNESS UHH-IHF
Kaufmann, Manfred, Prof. phytoplankton UMA and CIIMAR
Kronschnabel, Alessandra zooplankton/MOCNESS UHH-IHF
Lischka, Alexandra cephalopods GEOMAR
Lüskow, Florian gelatinous zooplankton GEOMAR
Martin, Bettina, Dr. zooplankton/MOCNESS UHH-IHF
Merten, Veronique cephalopods GEOMAR
Pinheiro, Neusa oxygen UniCV
Silva, Pericles oxygen INDP
Springer, Barbara, Dr. CTD, ADCP UHH-IHF
Zankl, Solvin photography
Zeimet, Timo zooplankton/MOCNESS UHH-IHF
AWI Alfred Wegener Institute for Polar and Marine Research, Bremerhaven, Germany
CIIMAR CIIMAR-Madeira, Funchal, Portugal
GEOMAR Helmholtz-Zentrum für Ozeanforschung Kiel, Germany
INDP Instituto Nacional de Desenvolvimento das Pescas, Mindelo, Sao Vicente, Republic of Cape Verde
UHH-IHF Universität Hamburg, Institut für Hydrobiologie und Fischereiwissenschaft, Hamburg, Germany
UMA Universidade da Madeira, Estação de Biologia Marinha do Funchal, Funchal, Portugal
UniCV Universidade de Cabo Verde, Mindelo, Sao Vicente, Republic of Cape Verde
MARIA S. MERIAN-Berichte, Cruise MSM49, Nov 28 - Dec 21, 2015, Las Palmas - Mindelo 4
3 Research Programme
(B. Christiansen, H.J.T. Hoving)
The overarching aim of cruise MSM49 was to assess the medium-sized pelagic fauna, such as gelatinous macrozooplankton, mesopelagic fishes, shrimps, krill and squids, and their role within the pelagic community in relation to 1) water mass properties, with special emphasis on oxygen minimum zones (OMZ) of different intensity, and 2) the influence of a shallow seamount reaching into the realm of the fauna which performs extensive diel vertical migrations. The study area in the waters around the Cape Verde islands in the eastern tropical Atlantic (ETA), offers both, OMZs of different intensity and an isolated shallow seamount (Senghor Seamount) with well-known bathymetry and ecology of smaller-sized plankton. In order to reach the goals, the following main objectives were addressed:
1. Description of water mass properties (oxygen, salinity, temperature, fluorescence, POC) 2. Mapping of the standing stocks, abundance, biodiversity, vertical distribution and diel vertical
migrations of medium-sized pelagic fauna in the epi- and mesopelagic zones around the Cape Verde Islands within different hydrographic and bathymetric settings (strong OMZ vs. weak OMZ, seamount vs. deep-sea plain, seamount summit vs. slopes)
3. Analysis of the trophic structure of the medium-sized pelagic fauna
While optical methods are superior at surveying fragile gelatinous zooplankton, fast swimming fauna is typically better assessed using nets. Combining advanced optical samplers with modern multiple net systems and traditional trawls made depth-stratified, quantitative sampling possible for a wide taxonomical range of the ecologically important medium-sized pelagic fauna, which has rarely been considered in open-ocean studies so far. The resulting data will be used to
• identify the influence of OMZs of different intensities on the composition, distribution and diel vertical migration behaviour of small nekton and macrozooplankton
• establish a baseline of faunal patterns in relation to OMZs of different intensity by correlating fauna to the ecological zonation associated with OMZs (mixed layer, pycnocline, upper oxygen limited zone, OMZ core, lower oxygen limited zone)
• determine the ecological effect of the intrusion of a shallow seamount into the OMZ
• evaluate the influence of shallow topography and its associated hydrodynamic characteristics on the distribution and abundance of small nekton and macrozooplankton
• identify the role of gelatinous plankton and of (micro)nekton in the pelagic food web in different hydrographic, hydrodynamic and topographic settings
• determine the role of the squid Sthenoteuthis pteropus in the pelagic food web of the ETA
• contribute to repeat hydrographic and biological measurements (e.g., CVOO, Senghor Smt.) The information gained from this cruise will advance our understanding of the ecology of medium-sized pelagic fauna in the ETA under different forcings, and will help to predict the pos- sible consequences of expanding oxygen minimum zones. In addition, it will complement pre- vious and ongoing studies on the smaller components of the pelagic communities in the area (phytoplankton, micro-, meso- and macrozooplankton), leading to a comprehensive picture of the pelagic ecosystem in the region.
No bottom-touching gear was used on the cruise. A complete abandonment of invasive methods in the water column was not possible in order to achieve the scientific goals, but the impact on the pelagic communities was minimal, since only relatively small nets in a small number of hauls were used in addition to the non-invasive optical methods.
MARIA S. MERIAN-Berichte, Cruise MSM49, Nov 28 - Dec 21, 2015, Las Palmas - Mindelo 5
4 Narrative of the Cruise (B. Christiansen)
MARIA S. MERIAN left the port of Las Palmas on 28 November, 2015, at 09:00. The transit to the study area was used for assembling and testing the instruments and for setting up the laboratories.
The sampling programme included different nets and optical systems in order to assess a wide variety of pelagic fauna. The PELAGIOS, a newly developed towed video camera system, aimed especially at gelatinous macrozooplankton. The Underwater Vision Profiler (UVP) is an optical recorder for smaller-sized plankton and particles; it was used in combination with the PELAGIOS and the CTD-rosette. The MOCNESS is a multiple net system with a series of nets which can be opened and closed sequentially. Two types were used; the 10m2-MOCNESS (MOC-10) has a 10 m2 net opening and was equipped with five nets of 1.5 mm mesh size targeting micronekton.
The 1m2-MOCNESS (MOC-1) with a 1 m2 opening carried three nets of 2 mm mesh size specifi- cally for krill plus six nets of 335 µm for macrozooplankton and larger mesozooplankton. The WP3 is a simple conical net which was used for gently sampling gelatinous organisms, and the Apstein net with a mesh aperture of 55 µm was employed to sample larger phytoplankton. A non- closing Isaac Kidd Midwater Trawl (IKMT) was used for fishing micronekton at some stations.
Water samples for different chemical and biological analyses were taken with a 24 bottle CTD- rosette. Squids were fished by hook-and line.
On 30 November we reached the Cape Verdian EEZ and performed a short test station with two shallow CTD hauls before steaming to our first study site, CVOO (Cape Verde Ocean Observato- ry), see Figure 4.1. The general sampling scheme for all stations comprised two CTD-rosette casts, one day and one night haul each with PELAGIOS and MOC-10, two day and two night MOC-1 hauls, two WP3 and one Apstein net hauls. Hook-and-line fishing for squids was done during night times when station work allowed. MOCNESS and PELAGIOS were fished down to 1000 m, WP3 and IKMT to 500 m, and the Apstein net to 150 m.
The CVOO is a monitoring site mainly for hydrographic and biogeochemical parameters and is jointly operated by GEOMAR and INDP. We started work there in the morning of 1 December with a CTD-rosette cast, followed by MOCNESS and PELAGIOS. Winds at CVOO were moder- ate, the sky was overcast with Saharan dust. Sargassum was abundant on the sea surface, and dur- ing the night large pyrosome colonies were frequently observed. The CTD casts at CVOO showed a shallow OMZ at 100 m, above the permanent OMZ, which points to the influence of a cyclonic eddy. Net samples and PELAGIOS videos indicated that organisms were abundant in the OMZ;
large ctenophores seemed to be particularly linked with the low oxygen zone.
Station work at CVOO was finished on 3 December, and we proceeded to station CV-N. Here, in order to save some time for the eddy search (see below), only a shortened sampling programme with one haul each of CTD-rosette, MOCNESS (1m2 and 10m2) and PELAGIOS was performed, before we steamed to station Senghor Ref, about 55 NM north of Senghor Seamount. This station, which is not influenced by elevated topography, served as an oceanic reference station for Senghor Seamount and had also been sampled during previous cruises to the seamount on R/Vs METEOR and POSEIDON. The oxygen distribution at Senghor Ref showed the expected profile with the minimum at 400 m. We left this station after finishing the full sampling programme on 5 Decem- ber and arrived at Senghor Seamount on 6 December. The weather had improved meanwhile, with clear sky and gentle breeze.
Senghor Seamount is a nearly conical seamount which rises from 3300 m to a small summit
MARIA S. MERIAN-Berichte, Cruise MSM49, Nov 28 - Dec 21, 2015, Las Palmas - Mindelo 6
plateau with a minimum depth of 100 m. Our work on this cruise focused on three locations: the northwestern slope above the 1000 m contour, the southwestern slope above the 1000 m contour, and the summit. We started at the northwestern slope, but since the distance between the three locations was very short, we could optimize shiptime usage by changing between stations, when appropriate. Above the slopes, our routine sampling programme with full profiles down to 1000 m and including all sampling gear was employed. On the summit, the MOC-10 was not used; instead we fished the IKMT from the surface to 80 m, which was the maximum sampling depth also for the other nets. With the PELAGIOS we were able to sample down to within 1 m above the bottom by mounting an additional, downward looking camera. During the PELAGIOS night haul, high abundances of fishes were observed in the near-bottom layer. The work at Senghor was finished on 10 December.
Initially, the next station (CV-E) was planned at 16°N - 020°W. However, we had information that a cyclonic eddy was slowly proceeding westwards close to our supposed cruise track, and we decided to sample this eddy if we were able to locate its core. Using two orthogonal ADCP transects guided by information from satellite data, and a series of CTD casts, we found the core of the eddy at 16°12.4’N - 021°18.4’W on 11 December and employed the full sampling programme there, starting with the small MOCNESS followed by PELAGIOS. As expected, very low oxygen values of <40 µmol L-1 were observed in a shallow lens at 100 m. The deep OMZ showed mini- mum O2 concentrations of ca. 45 µmol L-1 between 200 and 300 m. Organisms were frequently observed in the layers of low oxygen concentrations and were also abundant in net samples of the same depths. Preliminary observations of the net samples indicate that the eddy featured a species
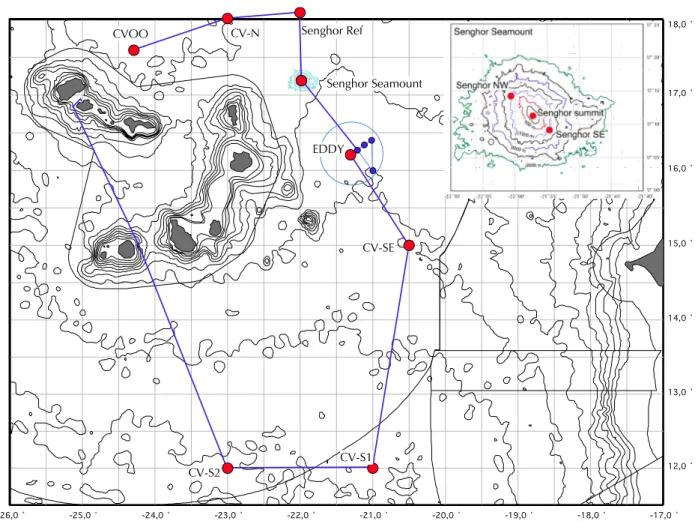
Fig. 4.1 MSM 49 study sites and cruise track. Inset: Senghor Seamount stations.
�
�
�
�
�
�
�
� � � � � � � � � �
���� ���� �����������
����������������
����
�����
�����
�����
MARIA S. MERIAN-Berichte, Cruise MSM49, Nov 28 - Dec 21, 2015, Las Palmas - Mindelo 7
composition which differed markedly from the other stations. For example, an indicator species for coastal upwelling, the copepod Calanoides carinatus, showed up regularly in the eddy sam- ples, but was rare at the other stations.
On 13 December in the afternoon we finished sampling in the eddy with the PELAGIOS day- time cast and steamed to our next station, CV-SE, which had initially been planned for 14°N, but was shifted to 15°N now to serve as a reference station for the eddy. We arrived there shortly be- fore midnight on 13 December and started station work with the deployment of the PELAGIOS.
After finishing the routine sampling programme there on 15 December at 16:00, we proceeded to the first of our two southernmost stations, CV-S1, at 12°N in the area of the expected most intense OMZ of the Cape Verde region, where we arrived in the morning of 16 December and started sampling with a first CTD. MOCNESS, PELAGIOS and the smaller nets followed, and on 18 December at 00:00 we finished station work here and steamed to station CV-S2, where the lowest O2 concentrations outside the eddy were observed with 41.4 µmol L-1 at 400 m. The routine sam- pling programme was performed without problems, and on 20 December we left station CV-S2 for the transit to Mindelo.
MARIA S. MERIAN docked in the port of Mindelo on 21 December at 08:30.
Deviation from the original workplan
Thanks to favourable weather conditions during the whole cruise, most of the scientific programme could be implemented as planned. However, two of the originally planned stations were shifted because we took the opportunity to sample the centre of a cyclonic eddy which moved from the African shelf westwards close to our supposed cruise track. As these eddies feature a core with very low oxygen concentrations, sampling the eddy complemented our studies on the influence of oxygen minimum zones on the pelagic ecosystem well. As a result, our initial station CV-E was omitted and station CV-SE was shifted about 60 NM to the north in order to serve as a reference station for the eddy.
The IKMT was used only at stations CVOO and Senghor Ref and at the seamount summit because the samples indicated that the 10m2-MOCNESS collected the same faunal spectrum, but quantitatively, depth-stratified and in better condition. However, some of the MOC-10 samples are not quantitative due to technical problems with the release mechanism.
5 Preliminary Results
5.1 Water Column Characteristics
5.1.1 Profiles of Temperature, Salinity, Oxygen, Fluorescence and Biogeochemistry (M. Kaufmann, N. Pinheiro, P. Silva, B. Springer)
Introduction
The study area was located around the Cape Verde Islands between 12°–18°N and 20°–24°W respectively. The sampling was focussed on four major sites/features: stations north of the Cape Verde archipelago, Senghor Seamount, a cyclonic eddy to the east of Cape Verde islands and further stations to the south (Fig. 4.1). The area is influenced hydrographically by large-scale in- teractions between the Canary Current (CC), the North Equatorial Current (NEC) and the North
MARIA S. MERIAN-Berichte, Cruise MSM49, Nov 28 - Dec 21, 2015, Las Palmas - Mindelo 8
Equatorial Counter Current (NECC) (Fernandes et al., 2004), separated by the Cape Verde Frontal Zone (CVFZ). This feature extends, with some seasonal variability, from Cape Blanc to the SW close to the north-western islands of the archipelago (Pérez-Rodriguez et al., 2001; Vangriesheim et al., 2003).
Regarding dissolved oxygen saturation the study area lies within a marked oxygen minimum zone (OMZ) due to very productive zones off northwest Africa, which is strongest to the south and east of the archipelago and weaker to the north (Löscher et al., 2015). The current structure revealed also the passage of mesoscale eddies in this area with formation of a low O2-core. During the cruise a cyclonic eddy was located and sampled.
Water depth in the area is in general between 3000 and 5000 m, interrupted by a few, usually deep, seamounts. The only shallow offshore seamount in the area is Senghor Seamount, which is located NE of Sal island and rises from 3300 m to 100 m below the surface.
Methods
CTD-profiles were recorded with the ship’s CTD/Rosette system consisting of a SBE 911 plus CTD (SEA-BIRD ELECTRONICS, INC.) incorporating double conductivity, temperature and dissolved oxygen sensors (all SEA-BIRD ELECTRONICS), as well as a combined Fluorescence/
Turbidity sensor (WET LABS, ECO-FL-NTU) and a PAR-sensor (BIOSPHERICAL INSTRU- MENTS INC., QSP2350). All sensors were calibrated a few months before the cruise.
The CTD was mounted to a SBE32 carousel equipped with 24 Niskin bottles (OCEANTEST EQUIPMENT INC.) with 10 L volume each. At each station the CTD was deployed and lowered initially to a depth of 23 m due to the need of activation of the Underwater Vision Profiler (UVP), which was fixed to the CTD/Rosette system for underwater visual profiles (see Chapter 5.3.2).
After a short period of approximately 30 s the system was heaved to the surface and then lowered to the desired depth (usually around 1000 m). During the upcast, water samples were taken at pre- established depths for dissolved oxygen (DO), nutrients, particulate organic matter (POM), fatty acids, seston, phytopigments and phytoplankton. All sensor data were acquired at 24-Hz resolution by the CTD’s decks unit and stored as raw data.
During the cruise a first data assessment was performed using the manufacturers processing software (SEASOFT V2 software suite) and following procedures described by McTaggart et al.
(2010). The pre-processing steps include conversion from raw binary data to engineering units in ASCII format, separation of the downcast from the upcast profiles, low pass filtering of the pressure channel to reduce high frequency noise, correction from pressure inversion caused by ship motion, derivation of correct salinity and bin averaging of the downcast profile into 1 dbar pressure intervals. The pre-processed data was imported for data quality control (DQC) using the OceanDataView software (Schlitzer, 2015).
During cruise MSM49 a total of 26 CTD/Rosette casts were completed ranging from depths be- tween 80 and 3584 m with most casts around 900-1200 m. At 12 stations water samples were drawn from the CTD/Rosette for DO determination by Winkler titration following Langdon (2010), with modifications and using the visual starch endpoint method. Samples were taken from depths rang- ing between 10 and 3500 m (mostly down to 800-1200 m), with 6 to 18 discrete depths (average 14) per station. In total, 173 determinations were performed (excluding triplicate determinations at some stations and some depths in order to check for method/reagents bias).
Cruise MSM49 was also used to contribute to the increasing CVOO time-series data set by
MARIA S. MERIAN-Berichte, Cruise MSM49, Nov 28 - Dec 21, 2015, Las Palmas - Mindelo 9
collecting biogeochemical water samples (dissolved inorganic carbon (DIC), total alkalinity (TA), oxygen and nutrients) between 3600 m and the surface. These samples will be analyzed at GEO- MAR in early 2016 and quality controlled results will be included into the CVOO data set.
Preliminary results and outlook
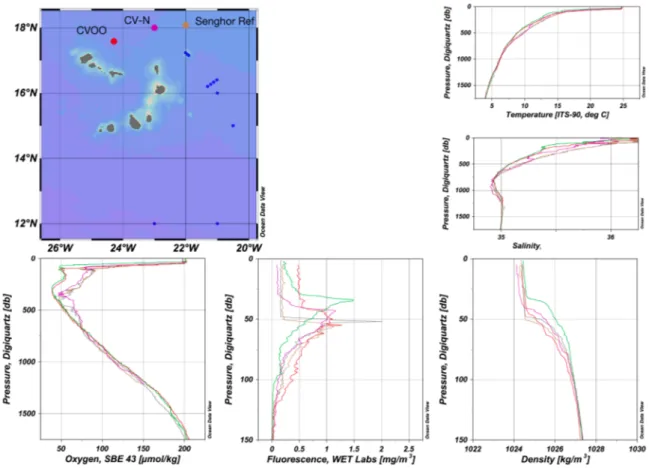
Stations north of the Cape Verde islands (CVOO, CV-N, Senghor Ref; Fig. 5.1). The temperature curves at the northern stations decreased in a more or less exponential shape (except for the ther- mocline down to about 50 m) from 25 °C at the surface down to 3 °C in 1750 m depth. Salinity decreased nearly linearly from the surface down to about 750 m with corresponding values from 36.5 to 34.5. Below 800 m there was a slight increase to 1200 m to 35. This value did not change substantially down to 1750 m. Density increased from the thermocline at 50 m from 1024 to 1026 kg m-3 with a slight variation between casts and stations. Below 100 m the variations between sta- tions were smaller and values increased to 1027 kg m-3. The fluorescence maximum was at about 50 m which correlated with the pycnocline.
DO surface values were around 200 µmol kg-1 and decreased strongly below the thermocline to around 50 µmol kg-1. The oxygen minimum zone was at around 250-350 m water depth. At greater depths DO increased again linearly to 200 µmol kg-1 in 1750 m depth.
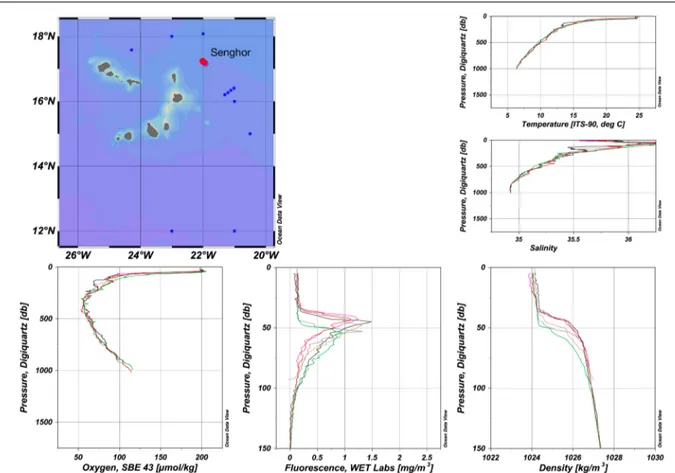
Senghor Seamount (Fig. 5.2). The thermocline at Senghor seamount was between 35 and 60 m with 25 °C at the surface. Below the thermocline temperature decreased also exponentially to 6 °C in 1000 m depth. Salinity decreased nearly linearly from the surface down to about 1000 m with corresponding values from 36.5 to 34.5. Below 800 m the values did not change substantially.
Fig. 5.1 Vertical profiles of temperature, salinity, density, DO (CTD-sensor) within the first 1750 m in the north- ern stations of the Cape Verde islands. The location of plotted stations is indicated in the map.
MARIA S. MERIAN-Berichte, Cruise MSM 49, Nov 28 - Dec 21, 2015, Las Palmas - Mindelo 10
Density increased from the thermocline between 35 and 60 m from 1024 (above) to 1027 kg m-3 (below) with a slight variation between casts and stations. The fluorescence maximum varied be- tween stations around the seamount and was observed between 35 and 60 m.
DO values at the surface were around 200 µmol kg-1 and decreased strongly below the thermo- cline to around 60 µmol kg-1. The oxygen minimum zone was around 250-350 m. At greater depths DO increased linearly to 120 µmol kg-1 in 1000 m depth.
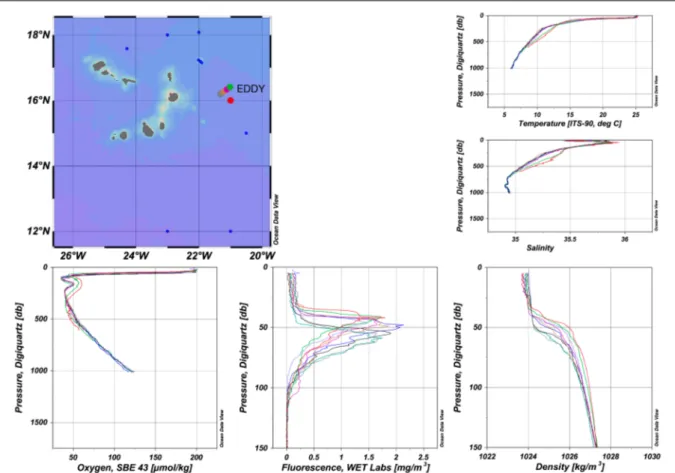
Eddy transect east of the Cape Verde islands (EDDY, Fig. 5.3). The temperature at the eddy sta- tions decreased steeply from 25 °C at the surface to 10 °C in 250 m depth and further to 6 °C in 1000 m. Salinity increased from the surface (35.5) towards the thermocline in about 50 m depth to 35.8 and decreased slightly to 34.7 in 750 m. Below there was another decrease at about 800 m. Density increased from the thermocline at 50 m from 1024 to 1027 kg m-3 with a slight varia- tion between casts and stations. Below 100 m the variations between stations became smaller. The fluorescence maximum varied between stations between 35 and 60 m.
DO values at the surface were around 200 µmol kg-1 and decreased strongly below the ther- mocline to around 40 µmol kg-1. Between 100 and 250 m there was an inversion with increasing values of up to 50 µmol kg-1. At greater depths DO increased linearly to 125 µmol kg-1 again in 1000 m depth.
Stations south-east of the Cape Verde islands (CV-SE, CV-S1, CV-S2; Fig. 5.4). The temperature at the southeastern stations decreased more or less exponentially (except for the thermocline down to about 40 m) from 27 °C at the surface to 4 °C in 1500 m depth. Salinity decreased from surface
Fig. 5.2 Vertical profiles of temperature, salinity, density, DO (CTD-sensor) within the first 1750 m at Senghor Seamount. The location of plotted stations is indicated in the map.
MARIA S. MERIAN-Berichte, Cruise MSM49, Nov 28 - Dec 21, 2015, Las Palmas - Mindelo 11
Fig. 5.3 Vertical profiles of temperature, salinity, density, DO (CTD-sensor) within the first 1750 m of the eddy east of Cape Verde. The location of plotted stations is indicated in the map.
Fig. 5.4 Vertical profiles of temperature, salinity, density, DO (CTD-sensor) within the first 1750 m at stations SE of Cape Verde. The location of plotted stations is indicated in the map.
MARIA S. MERIAN-Berichte, Cruise MSM49, Nov 28 - Dec 21, 2015, Las Palmas - Mindelo 12
down to about 750 m with values from 36 to 34.5. Below 800 m there was a slight increase towards 1500 m with 34.8. Density increased from the thermocline at 40 m from 1023 to 1026 kg m-3 with some variations between casts and stations. Below 50 m the variations between stations were less pronounced and density increased to 1027.3 kg m-3 in 150 m. The fluorescence maximum was observed between 25 and 50 m.
DO values at the surface were around 200 µmol kg-1 and decreased considerably below the thermocline to around 50 µmol kg-1. The oxygen minimum zone was situated around 300-400 m.
At greater depths DO increased linearly to 190 µmol kg-1 again in 1500 m depth.
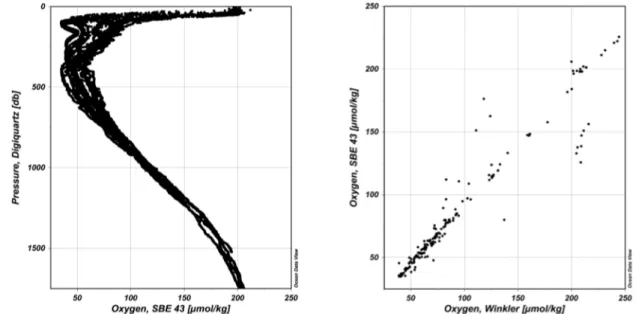
Comparison of oxygen profiles (Fig. 5.5). The DO profiles of all stations reveal a moderate oxygen minimum zone around 400 m with corresponding values as low as 40 µmol kg-1. At some stations (Eddy and CV-SE) there was an additional, shallower minimum around 100 m with 40 µmol kg-1. A highly significant correlation was obtained between DO values measured by the CTD-sensor and values obtained by Winkler titration (Spearman correlation rs= 0.9817, p<0.001), showing that the measurements of the oxygen seensor on the CTD can be considered as reliable.
Water masses (Fig. 5.6). With help of a temperature-salinity plot (TS-plot) the following water masses could be preliminarily identified: Between 200 and around 700 m North Atlantic Central Water (NACW) was observed at the northern and eastern stations; at the two stations south of Cape Verde we found South Atlantic Central Water (SACW) at these depths. At intermediate layers, from 700 to 1500 m, Antarctic Intermediate Water (AAIW) could be detected, whereas at layers deeper than 1500 m North Atlantic Deep Water (NADW) was found.
Perspectives. The hydrographic data will be processed in detail and made available to other work- ing groups as well as in a database for later access. Hydrographic data will be used in correlation with biological data to help explaining observed ecological patterns of pelagic flora and faunal communities.
Fig. 5.5 DO content of all 26 CTD stations (left). Correlation between DO measured by the CTD-sensor vs.
Winkler determination (right).
MARIA S. MERIAN-Berichte, Cruise MSM 49, Nov 28 - Dec 21, 2015, Las Palmas - Mindelo 13
5.1.2 Underway Measurements with Vessel Mounted ADCP (S. Christiansen, B. Springer)
Introduction
Underway current and backscatter measurements were performed continuously throughout the whole cruise using two vessel mounted Acoustic Doppler Current Profilers (VMADCP). At Senghor Seamount repeated ADCP measurements were conducted along 4 daytime and 2 night- time transects over the summit from the southwest to the northeast inside the 1000 m isobath. The main aim of this ADCP survey was to confirm interesting zooplankton vertical migration patterns in the acoustic backscatter, which were observed at an earlier cruise (P446).
Methods
The METEOR 75 kHz RDI Ocean Surveyor (OS75) mounted in the ship’s hull, and a 38 kHz RDI Ocean Surveyor (OS38) placed in the moon pool were used. VMDAS software Version 1.46 was employed for collecting the data. Both ADCPs were turned on on 30th November, 2015. Both in- struments worked well and produced good data for the duration of the cruise except between 9th December, 13:00 and 10th December, 20:50 when the 75 kHz ADCP did not record any velocity data for – so far – unknown reasons. It was noticed only after some time that both instruments were aligned to 45 degrees and therefore were interfering with each other, which has to be considered in the analysis.
Both the OS38 and the OS75 were set up first with the initialisation file from MSM46 (11:50- 19:44 on 30th November). At 19:45 the setups (ini-files) were exchanged. There were some prob- lems with the initialisation of the baud rate in the OS38 since the predefined baud rates did not work. At 12:46 on 1st of December the OS38 was started with the default baud rate and recorded permanently from then on. Both ADCPs were run in the more precise but less robust broadband (BB) mode. The configurations of the two instruments were: OS38 using 80 bins of 16 m with the
Fig. 5.6 TS-Plot of all 26 CTD stations with indications of different water masses.
MARIA S. MERIAN-Berichte, Cruise MSM 49, Nov 28 - Dec 21, 2015, Las Palmas - Mindelo 14
default baud rate and OS75 using 128 bins of 5 m with a baud rate of 115200 bps. Both instruments transducer depths were set to 7 m and single-ping bottom track was disabled.
Depending on the region, sea state and ship velocity, the vertical ranges covered by the instru- ments were between 500 m and 600 m for the OS75, and between 800 m and 1000 m for the OS38.
During the entire cruise the SEAPATH navigation data was of high quality. VMDAS software was used to configure the VMADCPs and to record the VMADCP data as well as the ships navigation- al data. Part of the data were processed on board and a preliminary data set was used for locating the cyclonic eddy. Data recording was stopped and immediately restarted a few times in order to produce smaller data sets and facilitate first analyses.
Preliminary results and outlook
ADCP preliminary data processing shows variable current velocities and directions in the study area, indicating a turbulent surface flow (Fig 5.7). A cyclonic eddy was located by performing two perpendicular transects through the estimated core (from geostrophic currents detected by satel- lite) of the eddy and identification of the lowest current velocities as centre point (see velocity map in Fig. 5.7). The ADCP data will be further processed and analysed ashore. Backscatter data will be used to identify zooplankton diel vertical migration patterns around Senghor Seamount, com- plementary to data from an earlier cruise (P446). Furthermore, the data will be added to the exist- ing data set of eddies in the ETA and will be used to characterise the current velocity properties of the sampled cyclonic eddy.
5.2 Particulate Organic Matter and Phytoplankton
Longitude
Latitude
20oW 20oN
26oW 25oW 24oW 23oW 22oW 21oW 12oN
14oN 16oN 18oN
0.3 m/s
Longitude
Latitude
21oW 16oN
0.2 m/s
Fig. 5.7 Horizontal velocity from 38 kHz ADCP averaged between 100-200 m depth for the whole cruise track (left) and for the cyclonic eddy (right).
MARIA S. MERIAN-Berichte, Cruise MSM49, Nov 28 - Dec 21, 2015, Las Palmas - Mindelo 15
5.2.1 POM and Nutrients (X. Chi)
Introduction
Particulate organic matter (POM) can provide a trophic connection between microbial assemblages and macro consumers (Kondratieff and Simmons, 1985). Understanding the composition and stoi- chiometry of POM is highly important for studying pelagic food webs in certain aquatic systems.
Nutrient limitation of growth rates is important for both the stoichiometry of phytoplankton biomass and the determination of phytoplankton community structure (Rhee, 1973, Flynn et al.
2010). Thus, understanding the biochemical composition of POM and nutrients distribution in water layers is important for investigating energy and matters cycle in food web.
Methods
During MSM49, water samples for POM and nutrients measurements were collected by a CTD with a 24 bottle rosette (see 5.1.1). Stations where POM was collected included Senghor Ref, Sen- ghor Seamount, Eddy and CV-SE (Eddy Ref), and CV-S1. The aimed depth for water and POM collection is 1000, 400, 200 and 25 m in deep sea stations, and 50, 25 m at Senghor Seamount station. After collection of the water with the CTD, water samples for POM measurements were filtered on GF/F filters. For each sample, three litres was filtered, and three replicates were pre- pared. Water samples for nutrient measurements were filtered through cellulose acetate filter (0.8 µm) and collected in 20 mL plastic vials. All samples were kept frozen (POM samples for fatty acid analysis were kept at -80 °C, POM samples for stable isotopes analysis and nutrients samples were kept at -20 °C) until further analysis.
Preliminary results and outlook
Results are not yet available. Before further analysis of the POM samples, the samples will be dried. For stable isotopes analysis, the dried POM samples will be combusted in an elemental analyser system connected to a temperature controlled gas chromatography oven, which is con- nected to an isotope ratio mass spectrometer (Hansen et al., 2009). For fatty acids analysis, we will use the method modified after Christie (1989). Nutrients will be measured by autoanalyzer from SKALAR (SAN PLUS).
5.2.2 Phytoplankton (M. Kaufmann) Introduction
The area around Cape Verde Islands is not well studied regarding phytoplankton community dynamics and taxonomy. However, investigations exist with respect to integral ecological aspects related to, for example, the Cape Verde Frontal Zone (Zenk et al., 1991), upwelling filaments form- ing off the NW African Coast (Meunier et al., 2012), impacts of Saharan dust reaching the area (Baker et al., 2007; Marañón et al., 2010). The eastern subtropical North Atlantic is an oligotrophic to mesotrophic region, bordered to the west and north by the oligotrophic subtropical gyre, to the east by the NW African coast with frequent formation of eddies and filaments transporting
MARIA S. MERIAN-Berichte, Cruise MSM 49, Nov 28 - Dec 21, 2015, Las Palmas - Mindelo 16
upwelled, nutrient-rich water from the coast offshore and to the south by the equatorial conver- gence also often transporting upwelled waters towards Cape Verde. Given this situation the main objective of investigations on phytoplankton during the cruise was to evaluate the phytoplankton community covering the whole dimensional range between 0.2-2, 2-20 and 20-200 µm respec- tively pico-, nanno- and microphytoplankton.
Methods
From the total of 26 CTD stations, water samples were taken at 10 of them. Using CTD and fluores- cence profiles the sampling depths were determined individually for each station during downcast.
Typically, 8 distinctive depths were sampled for different purposes: phytopigment determination by HPLC, identification and enumeration of coccolithophores (nannophytoplankton), identifica- tion and enumeration of picophytoplankton by flow cytometry and identification and enumeration of microphytoplankton by Utermöhl method (Tab. 5.1).
At 8 stations vertical casts with an Apstein-net with a mesh size of 55 µm were made between 0 and ±150 m. This will allow for a better qualitative analysis of the microphytoplankton community by light microscopy. The concentrated net sample was transferred into brown PE bottles and fixed with about 2-3 mL Lugol solution.
For Utermöhl enumeration a volume of about 200 mL was sampled directly from the Niskin bottles immediately after each cast and fixed with Lugol solution (about 2-3 mL). The remain- ing volume was transferred to 10 l folding cans and transferred to the lab for filtering. For picophytoplankton determination 3.2 mL of water sample from each depth were transferred into cryovials and fixed with 0.2 ml of a 20 % paraformaldehyde solution. After 15 min fixation in a refrigerator, the samples were shock frozen in liquid nitrogen and stored at -80 ºC until further analysis onshore. For phytopigment analysis by HPLC, between 1.75-4 L of water sample from each depth was filtered with low vacuum suction (~200 mbar) onto glass fibre filters (GF/F, 25 mm diameter, ~0.7 µm nominal pore size), the filters folded into half and dry blotted with paper towel, folded into 1/8, transferred to 1.5 mL reaction vials with a punctured lid, immediately frozen in liquid nitrogen and stored at -80 ºC. For nannophytoplankton analysis, between 2.3-5 L of water sample from each depth was filtered with low vacuum suction (~200 mbar) onto polycarbonate membranes (Nuclepore, 47 mm diameter, 0.4 µm nominal pore size), washed with a few mL of mineral water to get rid of excess salt (mineral water was preferred over Milli-Q due to its pH about 7; Milli-Q water usually has a pH of around 6 due to contaminations and mainly dissolution of CO2 from the air causing a decrease of the pH which could be problematic for calcareous nan- noplankton like coccolithophorids), dried at 37 ºC in plastic Petri dishes and sealed thereafter with ParafilmTM.
Preliminary results and outlook
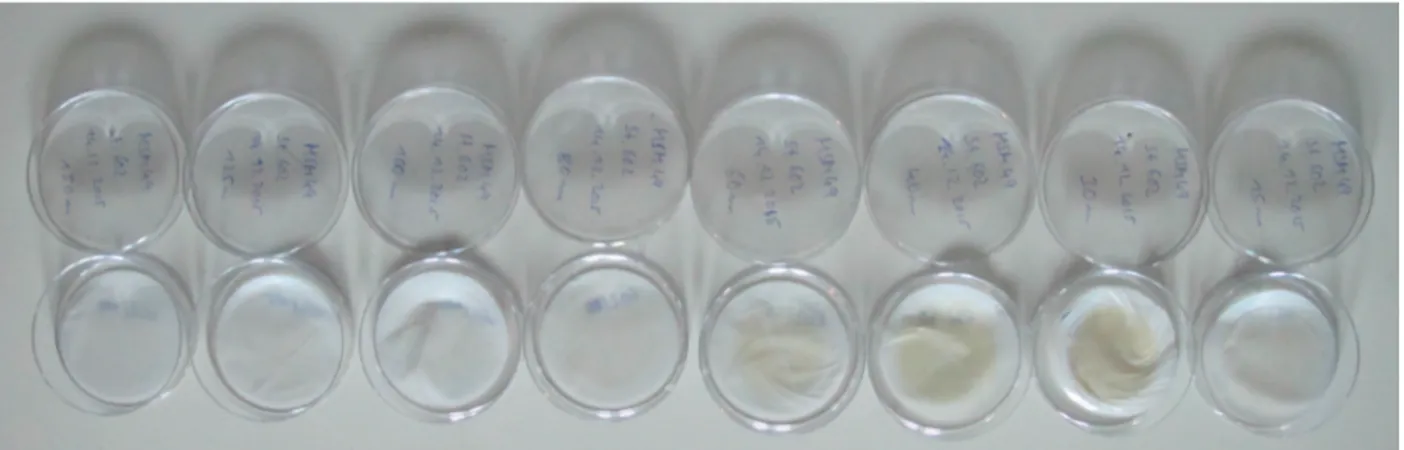
During filtration for phytopigment analysis first impressions confirmed the presence of a Deep Chlorophyll Maximum (DCM), as observed in the CTD-profiles by fluorescence. The filters from
Tab.5.1 Number of samples and volumes filtered for each phytoplankton group HPLC Coccolithophores Picoplankton Utermöhl
enumeration Apstein-
net total
No. samples 83 79 79 10 9 260
Volume filtered (L) 299 364 - - - 663
MARIA S. MERIAN-Berichte, Cruise MSM 49, Nov 28 - Dec 21, 2015, Las Palmas - Mindelo 17
around the DCM presented a visible green coloration (Fig. 5.8).
A first look at some of the Apstein-net samples with a dissecting microscope at low magnifica- tion showed the presence of a number of dinoflagellate species and some diatoms, as well as the presence of the cyanophyte Trichodesmium, which is typically found in subtropical-tropical open ocean waters (Tab. 5.2).
Phytopigments, coccolithophores and microplankton will be analysed at the University of Madeira / Ocean Observatory of Madeira (UMa/OOM), whereas the analysis of the picoplankton samples will be performed at a lab still to be defined, for example, at the University of Las Palmas de Gran Canaria, Spain.
The processed and analysed data will give an overview of the basic trophic level in terms of community composition and biomass available for subsequent trophic levels which were sampled and studied in great detail by other working groups during the cruise. This should allow for a more comprehensive understanding of the ecology of pelagic fauna in the area of the Cape Verde islands in general and with respect to oxygen minimum zones in particular.
Fig. 5.8 Visible green colouration observed at filters for coccolithophore analysis around the DCM (30-60 m).
Class Taxon
Cyanophyceae Trichodesmium Dinophyceae Ceratium spp.
Dinophyceae Ceratium breve Dinophyceae Ceratium tripos Dinophyceae Ceratocorys horrida Dinophyceae Protoperidinium
Dinophyceae Pyrocystis pseudonoctiluca Dinophyceae Pyrocystis lunula
Dinophyceae Ornithocercus Bacillariophyceae Asterolampra Bacillariophyceae Planktoniella Bacillariophyceae Rhizosolenia sp.
Bacillariophyceae unidentified centric diatom Tab. 5.2 Taxon list of phytoplankton identified on-board.
MARIA S. MERIAN-Berichte, Cruise MSM49, Nov 28 - Dec 21, 2015, Las Palmas - Mindelo 18
5.3 Zooplankton and Micronekton
5.3.1 Standing Stocks, Distribution, Composition and Size Structure of Zooplankton and Micronekton from Net Hauls
(A. Denda, S. Janßen, A. Lischka, B. Martin) Introduction
The pelagic community in the waters around the Cape Verde islands in the eastern tropical Atlantic is exposed to different hydrographic, hydrodynamic and topographic features. Water masses of varying properties, especially oxygen minimum zones (OMZ) might influence the ecological zonation of zooplankton and micronekton. Whereas to the north of Cape Verde a moderate oxygen zone is present, the core of the OMZ is expanding south of the islands at ~12° N. East (~60 NM) of the Cape Verde islands the shallow topography of Senghor Seamount interferes with the ocean currents and might affect local circulation patterns by the formation of seamount-associated flows (see Genin & Boehlert, 1985; Dower et al., 1992; Lavelle & Mohn, 2010) or isopycnal doming and increased vertical mixing (Eriksen 1998). These hydrodynamic features generate advection, upwelling or local retention of water masses, including particles, phytoplankton and zooplankton (Genin & Boehlert, 1985; Roden, 1994), which may attract smaller and larger nekton to the seamount surrounding waters. Westward propagating eddies are another hydrodynamic feature affecting the waters around the Cape Verde including the faunal zonation and composition; arising from the Mauritanian coast they transport water masses and organisms of the upwelling system to the open ocean.
The aim of the zooplankton and micronekton research during the MSM49 expedition was to investigate the distribution, composition and size structure of the pelagic community in relation to (1) the influence of the shallow Senghor Seamount reaching into the depth of diel vertical migra- tion, (2) the water mass properties within the cyclonic eddy and (3) the oxygen minimum zones (OMZ) of different intensity. The following questions are addressed:
(a) Are there differences in zooplankton and micronekton distribution and composition between the seamount, the eddy core, the OMZs and the unaffected open ocean reference sites in terms of biomass, abundance and taxonomic composition?
(b) Are there differences between day and night distributions of zooplankton and micronekton, indicating diel vertical migrations? Are these migrations affected by the bottom topography of the seamount and by OMZs of different intensities, i.e. do they differ from the unaffected open ocean sites?
The study on the medium-sized pelagic fauna will fill a gap in the past work at Senghor Seamount, which focused on micro- and mesozooplankton and benthopelagic fish communities (see Denda & Christiansen, 2014; Denda, 2015; Denda et al., 2016), and will therefore comple- ment the knowledge about the functioning of the Senghor Seamount ecosystem. Furthermore the study aims at understanding the impact of an expanding OMZ on distribution and restriction of the pelagic fauna in the Cape Verde region.
Methods
Zooplankton and micronekton were caught by oblique hauls with a 1m²-MOCNESS (Multi- ple Opening and Closing Net and Environmental Sensing System; Wiebe et al., 1985), a 10m2- MOCNESS and an IKMT (Isaac Kidd midwater trawl). The 1m2-MOCNESS (MOC-1) was
MARIA S. MERIAN-Berichte, Cruise MSM 49, Nov 28 - Dec 21, 2015, Las Palmas - Mindelo 19
equipped with three nets of 2000 µm mesh size (especially for krill) and six nets of 335 µm mesh size (for meso- and macrozooplankton). The five nets of the 10m²-MOCNESS (MOC-10) had a mesh of 1500 µm (for macrozooplankton and micronekton). Both net systems were equipped with a pressure sensor, an inclinometer, a flowmeter and probes for temperature and conductivity. En- vironmental data (temperature, salinity, pressure) were recorded simultaneously during sampling.
The towing speed was 2 knots. The whole water column was subdivided into smaller sampling intervals, depending on the OMZ, and was sampled from the surface to a maximum of 1000 m depth and back. In total 37 oblique hauls were taken with the 1m2-MOCNESS, two day and two night deployments per location, except at CV-N due to the revised cruise plan (see Chapter 4). A total of 16 hauls were performed with the 10m2-MOCNESS, one day and one night haul at each location (Fig. 4.1). The Senghor summit station was not sampled with the 10m2-MOCNESS due to the shallow water depth, and a technical failure hampered sampling at locations CVOO and CV-N.
The IKMT (for small and medium sized nekton) has a mouth opening of ~7 m2. The overall length of the coarse-meshed net was 10 m, ending in a cod end of 500 µm mesh size. The IKMT was de- ployed in oblique hauls to a maximum depth of 500 m only four times during the night, because the samples indicated that the 10m2-MOCNESS sampled the same faunal spectrum, but quantitatively, depth-stratified and in better condition.
All samples collected with the MOCNESS were split into two halves, one of which was pre- served in a 4 % formaldehyde seawater solution for further biomass determination and taxonomic identification. The other half was sorted on board for gelatinous macrozooplankton (see chapter 5.3.3), krill (see chapter 5.3.4) and cephalopods. Samples of the IKMT were sorted directly for gelatinous macrozooplankton, cephalopods, shrimps and mesopelagic fishes. Samples were pre- served in 4 % formaldehyde for further taxonomic identification.
Preliminary results and outlook
Biomass standing stocks. Standing stocks of total biomass (wet weight) of macrozooplankton and micronekton from the 10m2-MOCNESS were integrated over the full sampling depth of 1000 m and include macrozooplankton (2-20 mm) and micronekton (20-200 mm) as well as gelatinous organisms and salps larger 20 mm and fishes larger 120 mm. The lowest mean standing stock of day and night catcheswas measured at station CV-S1 with 14.7 g m-2 and the highest of 18.3 g m-2 inside the eddy (Fig. 5.9). In general, biomass standing stocks at the northern stations, the seamount and the reference site, where oxygen concentrations are moderate, were higher than at the south- ern sites CV-SE, CV-S1 and CV-S2 within the OMZ. However, differences were statistically not significant (pooled day and night data; ANOVA: F = 0.223, p > 0.05). The size composition was similar at the seamount, the reference site and the CV-SE station. Macrozooplankton (2-20 mm) made up 23-35 % of the total biomass and micronekton 27-35 % (Fig. 5.9). Jellies contributed 2- 13 %, salps up to 23 % and the amount of larger fishes ranged between 8 and 37 %. Inside the eddy gelatinous zooplankton contributed a large amount to the biomass (37 %), whereas larger fishes made up only 1 %. At the southernmost stations salps were completely missing, and larger fishes were absent at station CV-S2.
Vertical biomass distribution. The biomass concentrations (wet weight) of macrozooplankton and micronekton, without larger gelatinous zooplankton, salps and fishes, indicate slight differ- ences in the vertical profiles during day and night distributions (Fig. 5.10). The lowest biomass
MARIA S. MERIAN-Berichte, Cruise MSM49, Nov 28 - Dec 21, 2015, Las Palmas - Mindelo 20
Fig. 5.9 Biomass standing stocks (wet weight, g m-2) in the upper 1000 m with size composition (%) from the 10m²-MOCNESS (mean values of day and night catches).
Fig. 5.10 Vertical biomass (wet weight, g 1000-1 m-3) distribution of macrozooplankton (2-20 mm) and micronekton (20-200 mm) during day and night from the 10m²-MOCNESS.
�������������
�������������
�������������
������������� ������������� ������������� �������������
MARIA S. MERIAN-Berichte, Cruise MSM49, Nov 28 - Dec 21, 2015, Las Palmas - Mindelo 21
concentration of macrozooplankton was measured at night in the upper 100 m at CV-S1 with 0.70 g 1000-1 m-3. Inside the upper water layers of the eddy the biomass concentration was highest with 29.0 g 1000-1 m-3 at night. No micronekton was caught in the surface waters of CV-SE and CV-S1 during night and day. A maximum biomass of 16.6 g 1000-1 m-3 was measured in the mid waters at Senghor slope SE during the day. At Senghor slope SE, the eddy and CV-S2 the vertical distribution of macrozooplankton biomass indicates some diel vertical migration, whereas at the other stations no such pattern could be found, which points to a generally high amount of non-mi- grating zooplankton in the Cape Verde waters as observed in a previous study at Senghor Seamount (Denda and Christiansen, 2014). Patterns of diel vertical migration were more pronounced within the micronekton distribution. In relation to the oxygen concentration, macrozooplankton biomass, for example, was reduced at the core of the oxygen minimum inside the eddy at about 100 m depth.
Preliminary taxonomic observations indicate that the eddy features a species composition which differs markedly from the other stations. For example, an indicator species for coastal upwelling, the copepod Calanoides carinatus, showed up much more frequently in the mid water samples of the eddy than at the other stations.
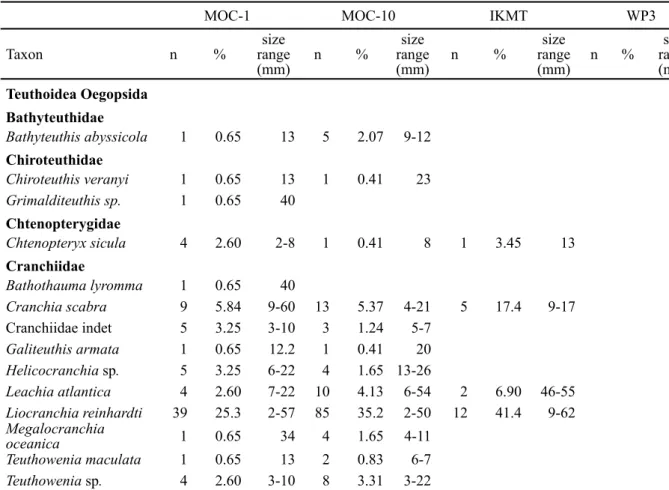
Taxonomic composition of cephalopods. A total of 429 cephalopods were collected by four dif- ferent gears. The 1m2-MOCNESS caught 154 specimens, 242 individuals were collected with the 10m2-MOCNESS, 29 specimens were caught with the IKMT and 4 additional individuals with the WP3 (see chapter 5.3.3 for explanations). A total of 28 species belonging to 18 families were identified (Tab. 5.3). The majority were early life stages of cephalopods with the most abundant cranchid species Liocranchia reinhardti (25 % of MOC-1, 35 % of MOC-10 and 41 % of IKMT catches).
MOC-1 MOC-10 IKMT WP3
Taxon n % size
range
(mm) n % size
range
(mm) n % size
range
(mm) n % size range (mm) Teuthoidea Oegopsida
Bathyteuthidae
Bathyteuthis abyssicola 1 0.65 13 5 2.07 9-12 Chiroteuthidae
Chiroteuthis veranyi 1 0.65 13 1 0.41 23
Grimalditeuthis sp. 1 0.65 40 Chtenopterygidae
Chtenopteryx sicula 4 2.60 2-8 1 0.41 8 1 3.45 13
Cranchiidae
Bathothauma lyromma 1 0.65 40
Cranchia scabra 9 5.84 9-60 13 5.37 4-21 5 17.4 9-17
Cranchiidae indet 5 3.25 3-10 3 1.24 5-7
Galiteuthis armata 1 0.65 12.2 1 0.41 20
Helicocranchia sp. 5 3.25 6-22 4 1.65 13-26
Leachia atlantica 4 2.60 7-22 10 4.13 6-54 2 6.90 46-55
Liocranchia reinhardti 39 25.3 2-57 85 35.2 2-50 12 41.4 9-62 Megalocranchia
oceanica 1 0.65 34 4 1.65 4-11
Teuthowenia maculata 1 0.65 13 2 0.83 6-7
Teuthowenia sp. 4 2.60 3-10 8 3.31 3-22
Tab. 5.3 Cephalopods collected by different gear.
MARIA S. MERIAN-Berichte, Cruise MSM49, Nov 28 - Dec 21, 2015, Las Palmas - Mindelo 22
Tab. 5.3 continued
Enoploteuthidae
Abraliopsis pfefferi 1 0.41 5 1 3.45 22
Abraliopsis sp. 3 1.95 4-7.5 9 3.72 5-15
Enoploteuthidae indet. 6 3.90 2.5-15 1 0.41 3
Enoploteuthis sp. 1 0.65 10 2 0.83 4-12 1 3.45 20
Histioteuthidae
Histioteuthidae indet. 2 1.30 3-10 3 1.24 4-7 Lepidoteuthidae
Lepidoteuthidae indet. 1 0.65 13 4 1.65 12-16 Lycoteuthidae
Lycoteuthidae indet. 2 1.30 4 Mastigoteuthidae
Mastigoteuthis sp. 10 6.49 4-50 20 8.26 6-86 Ommastrephidae
Ommastrephidae indet. 4 2.60 3-5 1 0.41 6 Sthenoteuthis pteropus 1 0.65 6
Onychoteuthidae
Onychoteuthidae indet. 4 2.60 3-10 4 1.65 5-10
Onychoteuthis banksii 1 0.65 9 8 3.31 6-20 2 6.90 10-15
Onykia carriboea 1 0.65 5
Pyroteuthidae
Pterygioteuthis sp. 3 1.95 3-7 2 0.83 3-4
Pyroteuthidae indet. 6 3.90 6-29 2 0.83 7 2 6.90 17-22
Pyroteuthis
margaritifera 5 2.07 9-12
Thysanoteuthidae Thysanoteuthis
rhombus 1 0.65 5
Teuthoidea indet. 13 8.44 2-6 4 1.65 3-11
Vampyromorpha Vampyroteuthis
infernalis 4 2.60 13-65 8 3.31 12-75 1 3.45 25
Octopoda Argonautidae
Argonauta argo 1 0.65 8 1 0.41 7
Bolitaenidae
Bolitaenidae indet. 8 5.19 9-30 16 6.61 5-52 3 75 4-9
Japetella diaphana 1 0.65 18 Vitreledonellidae
Vitreledonella richardi 2 1.30 20-84 9 3.72 4-45 1 3.45 42 1 25 14
Octopodidae indet. 1 0.41 8 1 3.45 13
Octopus defilippi 1 0.65 5 3 1.24 4-7
Octopus sp. 1 0.65 3
Sum 154 242 29 4
Sum (all) 429
MOC-1 MOC-10 IKMT WP3
Taxon n % size
range
(mm) n % size
range
(mm) n % size
range
(mm) n % size range (mm)
MARIA S. MERIAN-Berichte, Cruise MSM49, Nov 28 - Dec 21, 2015, Las Palmas - Mindelo 23
Perspectives. With the results of this cruise we can detect possible effects induced on the pelagic community by (1) the interaction between a seamount topography and the current regime, (2) a cyclonic eddy and (3) different OMZ intensities. The further analysis of biomass, abundance and taxonomic composition of meso- and macrozooplankton and micronekton will give information about the importance of diel vertical migration and will identify the position of micronekton within the pelagic fauna. Furthermore, measurements of stable isotopes ratios and stomach content analy- sis will give information about trophic interactions in the pelagic food chain and the food sources at the different sampling locations (see chapter 5.4). In addition the contribution of zooplankton and micronekton to the total carbon flux will be estimated by community- and size-specific respi- ration rates in the different hydrographic settings.
5.3.2 Distribution, Composition and Size Structure of Meso- and Macrozooplankton from Optical Samplers (PELAGIOS and UVP)
(H.J.T. Hoving, S. Christiansen, E. Fabrizius, H. Hauss) Introduction
While nets are able to capture organisms, they also underestimate fragile gelatinous organisms since these organisms tend to get damaged, or not sampled in nets. Optical samplers therefore are good tools to substantiate net collections in determining faunal distribution and abundance pat- terns. Underwater surveys with optical techniques (e.g. ROVs, plankton recorders) have revealed fauna that are not sampled by nets, and show a diverse fauna of gelatinous organisms in the meso- and bathypelagic zones (Robison, 2004). During MSM49 we used a recently developed optical method, the pelagic in situ observation system (Hoving et al., 2014) or PELAGIOS (Fig. 5.11), to investigate the impact of different oceanographic features on the vertical distribution, abun- dance and diversity of macrozooplankton and (micro)nekton. The PELAGIOS is a towed ocean
Fig. 5.11 The PELAGIOS with UVP mounted underneath being retrieved after a transecting cast (Photo:
B. Christiansen).