www.biogeosciences.net/14/1825/2017/
doi:10.5194/bg-14-1825-2017
© Author(s) 2017. CC Attribution 3.0 License.
Particle export fluxes to the oxygen minimum zone of the eastern tropical North Atlantic
Anja Engel1, Hannes Wagner1, Frédéric A. C. Le Moigne1, and Samuel T. Wilson2
1GEOMAR Helmholtz Centre for Ocean Research Kiel, 24105 Kiel, Germany
2Daniel K. Inouye Center for Microbial Oceanography: Research and Education, Department of Oceanography, University of Hawaii, Honolulu, HI 96822, USA
Correspondence to:Anja Engel (aengel@geomar.de)
Received: 25 November 2016 – Discussion started: 28 November 2016 Revised: 6 March 2017 – Accepted: 12 March 2017 – Published: 5 April 2017
Abstract. In the ocean, sinking of particulate organic mat- ter (POM) drives carbon export from the euphotic zone and supplies nutrition to mesopelagic communities, the feeding and degradation activities of which in turn lead to export flux attenuation. Oxygen (O2) minimum zones (OMZs) with suboxic water layers (< 5 µmol O2kg−1) show a lower carbon flux attenuation compared to well- oxygenated waters (> 100 µmol O2kg−1), supposedly due to reduced heterotrophic activity. This study focuses on sinking particle fluxes through hypoxic mesopelagic wa- ters (< 60 µmol O2kg−1); these represent∼100 times more ocean volume globally compared to suboxic waters, but they have less been studied. Particle export fluxes and attenuation coefficients were determined in the eastern tropical North At- lantic (ETNA) using two surface-tethered drifting sediment trap arrays with seven trapping depths located between 100 and 600 m. Data on particulate matter fluxes were fitted to the normalized power functionFz=F100 (z/100)−b, withF100 being the flux at a depth (z) of 100 m andbbeing the attenua- tion coefficient. Higherbvalues suggest stronger flux attenu- ation and are influenced by factors such as faster degradation at higher temperatures. In this study,bvalues of organic car- bon fluxes varied between 0.74 and 0.80 and were in the in- termediate range of previous reports, but lower than expected from seawater temperatures within the upper 500 m. Dur- ing this study, highest b values were determined for fluxes of particulate hydrolyzable amino acids (PHAA), followed by particulate organic phosphorus (POP), nitrogen (PN), car- bon (POC), chlorophylla (Chla) and transparent exopoly- mer particles (TEP), pointing to a sequential degradation of organic matter components during sinking. Our study sug-
gests that in addition to O2 concentration, organic matter composition co-determines transfer efficiency through the mesopelagic. The magnitude of future carbon export fluxes may therefore also depend on how organic matter quality in the surface ocean changes under influence of warming, acid- ification and enhanced stratification.
1 Introduction
The biological carbon pump, defined as the export of bio- logically fixed carbon dioxide (CO2)from the surface to the deeper ocean mainly in the form of sinking particles (Volk and Hoffert, 1985), influences atmospheric CO2concentra- tion and affects ecosystem structure and elemental distribu- tions in the ocean. The total amount of carbon export as well as the efficiency of the biological carbon pump, i.e., the ratio between export and primary production, are highly dynamic (Buesseler and Boyd, 2009; Lam et al., 2011).
Changes in the efficiency of the biological carbon pump may have been responsible for past atmospheric CO2variability between glacial–interglacial transition periods (Kohfeld and Ridgewell, 2009) and play a key role for future climate pre- dictions (Heinze et al., 2015).
Most of the POM being exported below the surface mixed layer (< 200 m in general) is solubilized and remineralized within the mesopelagic layer, i.e., between depths of 200 and 1000 m (Bishop et al., 1978; Suess, 1980). The shallower the carbon remineralization depth, the more likely CO2is to ex- change with the atmosphere and hence drive a shorter carbon storage time in the ocean (Volk and Hoffert, 1985; Kwon et
al., 2009). The factors driving export flux attenuation in the mesopelagic therefore have a large influence on CO2seques- tration in the ocean. The vertical profile of sinking particu- late organic carbon (POC) flux has often been described by a normalized power function:Fz=F100(z/100)−b, whereFz is the particle flux as a function of depthz,F100is the flux at 100 m depth andbis the flux attenuation coefficient (Martin et al., 1987; hereafter M87). The authors of the M87 study derived an “open ocean composite” for POC export fluxes from North Pacific data with aF100=50.3 mg m−2d−1and b=0.86. However, strong regional variations of both total export POC fluxes andbvalues are observed (Martin et al., 1987; Buesseler et al., 2007a; Torres Valdes et al., 2014;
Marsay et al., 2015) with several factors proposed to con- trol export flux attenuation. Increased attenuation, i.e., higher bvalues, have been related to increased temperature (Marsay et al., 2015), zooplankton feeding activity (Lampitt et al., 1990), coprophagy, coprorhexy and coprochaly (Belcher et al. 2016), microbial cycling (Giering et al., 2014) and lack of ballast (Le Moigne et al., 2012). Decreased flux attenua- tion, i.e., lowerbvalues, and thus higher transfer efficiencies (Teff)have been associated to high particle sinking velocity depending on plankton community composition, especially the presence of larger phytoplankton cells (Buesseler, 1998;
Buesseler and Boyd, 2009), particle aggregates (Alldredge and Gotschalk, 1989) and fecal pellets (Cavan et al., 2015).
Organic polymers, such as transparent exopolymer particles (TEP), increase the rate of aggregate formation due to their high stickiness (Alldredge et al., 1993; Engel, 2000; Passow, 2002; Chow et al., 2015) and supposedly play an important role in particle export fluxes (Passow, 2002; Arrigo, 2007;
Chow et al., 2015). TEP are carbon-rich particles that form from dissolved polysaccharides (Engel et al., 2004). When included in sinking POM inventories, TEP may increase car- bon relative to nitrogen export fluxes, a mechanism that po- tentially counteracts rising CO2 concentration in the atmo- sphere (Schneider et al., 2004; Arrigo, 2007; Engel et al., 2014). However, TEP themselves are non-sinking due to a high water content and low density (Azetzu-Scott and Pas- sow, 2004), and little quantitative data are available on TEP export by sinking particles so far (Passow et al., 2000; Martin et al., 2011; Ebersbach et al., 2014). Thus, the role of TEP in carbon export is still unresolved.
Reduced POC flux attenuation has also been suggested for oxygen minimum zones (OMZs) (Martin et al., 1987;
Haake et al., 1992; Devol and Hartnett, 2001; Van Mooy et al., 2002; Keil et al., 2016) as a consequence of reduced zooplankton feeding and microbial degradation activities in suboxic (< 5 µmol O2kg−1)waters. So far, the vast major- ity of mesopelagic downward POM flux measurements orig- inate from well-oxygenated waters (> 100 µmol O2kg−1). In the M87 study, five sets of drifting sediment traps were de- ployed in the oxygenated North Pacific and four sets were deployed in the eastern tropical North Pacific (ETNP) OMZ.
The flux attenuation coefficients (b) for the oxygenated North
Pacific averaged 0.90±0.06, while lowerbvalues averaging to 0.66±0.24 were measured in the ETNP OMZ. In agree- ment, Devol and Hartnett (2001) and Van Mooy et al. (2002) observed low particle attenuation in the OMZ of the ETNP off Mexico, yieldingb coefficients of 0.36 and 0.40 respec- tively. Keil et al. (2016) found b values of 0.59–0.63 in the suboxic Arabian Sea. These studies thus indicate that a greater proportion of the sinking POM escapes degradation while sinking through suboxic waters. However, influence of oxygen on organic matter degradation may vary between in- dividual components. For instance, degradation of hydrolyz- able amino acid (PHAA) under suboxic conditions was found to continue with the same rate as compared to oxic condi- tions (Van Mooy et al., 2002; Pantoja et al., 2004), suggest- ing that anaerobic and micro-aerobic bacteria preferentially utilize nitrogen-rich components.
So far, little is known on sinking POM flux attenuation in hypoxic waters (< 60 µmol O2kg−1), which are more widespread (∼4 % of ocean volume) compared to suboxic waters (< 0.05 % of ocean volume). Laboratory studies indi- cated that particle aggregates sinking through hypoxic wa- ters can become suboxic within their interior due to oxy- gen diffusion limitation and evolve microbial degradation processes typical for suboxic waters (Alldredge and Cohen, 1987; Ploug et al., 1997; Stief et al., 2016). For example, at an ambient O2concentration of 60 µmol kg−1, the O2up- take by a 2 mm (diameter) aggregate was diffusion-limited and a 0.5 mm wide anoxic core occurred within its interior (Ploug and Bergkvist, 2015). Since OMZs are expected to expand in the future as a consequence of global warming and altered circulation patterns (Stramma et al., 2008), the role of oxygen in controlling the biological pump efficiency needs to be better constrained for predicting ocean–climate feedbacks. In order to assess what controls carbon flux at- tenuation and depth-related changes in sinking particle com- position in hypoxic waters, we determined downward POM fluxes in the eastern tropical North Atlantic (ETNA) off the coast of Mauritania, which exhibits an extensive hypoxic OMZ between 300 and 500 m. We used two parallel drifting, surface-tethered sediment trap devices with particle intercep- tor traps (PITs) at seven to eight different depths between 60 and 600 m to estimate fluxes to and within the OMZ.
2 Methods 2.1 The study area
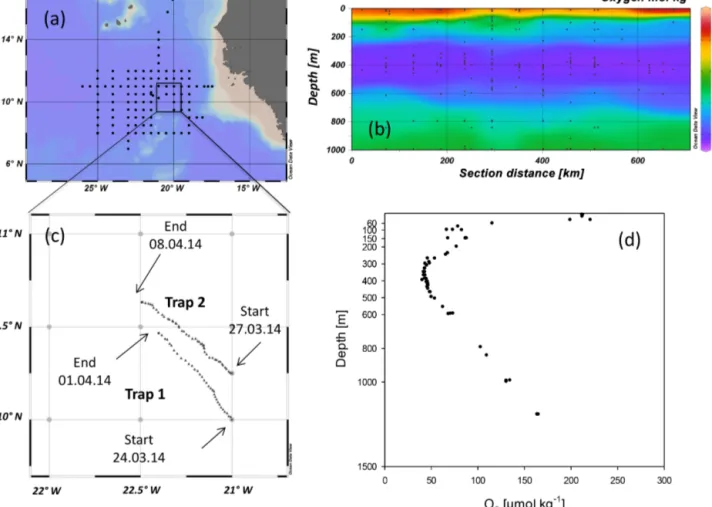
The study was conducted from 17 March to 16 April 2014 during a cruise of the RVMeteorto the ETNA region off the coast of Mauritania (Fig. 1a). The study area included hy- poxic waters with minimum values of oxygen concentration of 40 µmol kg−1as determined by CTD (Seabird) casts with two calibrated oxygen sensors at midwater depths of 350–
500 m (Fig. 1b) (Visbeck, 2014).
Figure 1.Map of(a)the study area and(b)depth distribution of oxygen concentration (mol kg−1)in the eastern tropical North Atlantic (ETNA) during the RVMeteor105 cruise, when two surface-tethered drifting sediment traps (STDT) were deployed(c). Depth distribution of oxygen concentration (mol kg−1)at stations visited in the deployment area showed an oxygen minimum zone in the upper mesopelagic(d).
2.2 Sediment trap operation and sample analysis Free-drifting surface-tethered sediment trap devices were de- ployed for 196 h during the first deployment and 281 h during the second deployment (Fig. 1c). The first trap device was deployed on the 24 March 2014 (11:00 UTC) at 10.00◦N 21.00◦W with 12 PITs at each of eight depths: 60, 100, 150, 200, 300, 400, 500 and 600 m. The device was recov- ered on the 1 April 2014 (14:30 UTC) at 10.46◦N, 21.39◦W.
The second device was deployed on the 27 March 2014 (16:00 UTC) at 10.25◦N, 21◦W with 12 PITs at each of seven depths: 100, 150, 200, 300, 400, 500 and 600 m.
The second trap device was recovered on the 8 April 2014 (09:00 UTC) at 10.63◦N, 21.50◦W. Both devices slowly drifted northwest and were recovered approximately 37 nm away from their deployment location (Fig. 1c). Within the drifting area, oxygen concentration in the OMZ resembled the overall pattern of the Mauritanian upwelling with fully hypoxic conditions between 300 and 500 m (Fig. 1d).
The design of the trap devices and the drifting array ba- sically follows Knauer et al. (1979), with 12 PITs mounted
on a polyvinyl chloride (PVC) cross frame. The PITs were acrylic tubes with an inside diameter of 7 cm, an outside di- ameter of 7.6 cm and a height of 53 cm, leading to an aspect ratio of 7.5. The aspect ratio and a baffle system consist- ing of smaller acrylic tubes attached to the top end of each PIT help to reduce drag-induced movement within the trap (Soutar et al., 1977). PVC crosses with PITs were attached to a free-floating line, which was buoyed at the surface and weighted at the bottom. The surface buoys of the arrays car- ried GPS/Iridium devices and flashlights.
Prior to each deployment, each PIT was filled with 1.5 L of filtered surface seawater (0.2 µm pore size cartridge) col- lected from the ship’s underway seawater system, up to three- quarters of the PIT’s height. A brine solution was prepared by dissolving 50 g L−1sodium chloride with filtered surface seawater and subsequently filtered through a 0.2 µm cartridge to remove excess particulates. Then 20 mL of formalin was added per liter of the solution to achieve a brine solution with 2 % formalin. The preservative solution was then slowly transferred into each PIT beneath the 1.5 L of filtered sea-
water using a peristaltic pump. PITs were covered with lids immediately to minimize contamination before deployment.
Sample treatment after trap recovery followed recommen- dations given by Buesseler et al. (2007b). After recovery, all PITs were capped to minimize contamination. The density gradient was visually inspected and found intact at the po- sition of prior to deployment or at a maximum 2 cm above.
Then, seawater was pumped out of each PIT using a peri- staltic pump down to 2–3 cm above the density gradient.
The remaining∼0.6 L was subsequently transferred to can- isters, pooled from 11 tubes per depth. Added to each can- ister was 40 mL formalin. Samples from each depth were passed through a 500 µm nylon mesh. Swimmers were re- moved from the mesh with forceps under a binocular micro- scope and the remaining particles, which stuck to the mesh, were transferred back to the sample. Samples were subse- quently split into aliquots of the total sample. Therefore, the pooled sample was transferred into a round 10 L canister and stirred at medium velocity with a magnetic bar. Aliquots were transferred into 0.5 L Nalgene bottles with a flexible tube using a peristaltic pump. Aliquots of samples were fil- tered under low pressure (< 200 mbar) onto different filter types (combusted GF/F 0.7 µm, polycarbonate 0.4 µm or cel- lulose acetate 0.8 µm; see below) for different analyses and stored frozen (−20◦C) until analyses.
Biogeochemical analyses
The following parameters were determined: total particulate mass (TPM), POC, particulate nitrogen (PN), particulate or- ganic phosphorus (POP), biogenic silica (BSi), chlorophylla (Chla), particulate PHAA and TEP.
TPM was analyzed in triplicate. The following aliquots were filtered in triplicate onto pre-weighed 0.4 µm polycar- bonate filters: 800 mL (2×400 mL; 8 % of total sample) for the depths of 600 to 300 m of deployment no. 1, 400 mL (4 % of total sample) for the depths of 200 and 150 m of de- ployment no. 1 and for all depths of deployment no. 2, and 420 mL (4 % of total sample) for the depth of 100 and 60 m of deployment no. 1. Filters were rinsed twice with Milli-Q water, dried at 60◦C for 4 h and stored until weight measure- ment on a Mettler Toledo XP2U microbalance.
POC and PN aliquots were filtered in triplicate onto com- busted (8 h at 500◦C) GF/F filters (Whatmann, 25 mm):
400 mL (4 % of total sample) for the depths of 600 to 150 m of deployment no. 1, 420 mL (4 % of total sample) for the depths of 100 and 60 m of deployment no. 1, and 100 mL (1 % of total sample) for all depths of deployment no. 2. For the depths of 150, 100 and 60 m of deployment no. 1, 400–
420 mL (4 % of total sample) was filtered onto two filters due to the high particle load at these depths. Filters were exposed to fuming hydrochloric acid in a fuming box overnight to remove carbonate and subsequently dried (60◦C, 12 h). For analysis, the filters were enclosed in tin cups and analyzed using an Euro EA elemental analyzer calibrated with an ac-
etanilide standard. For the depths of 150, 100 and 60 m of deployment no. 1 the sum of both filters was taken.
POP was determined in triplicate, except for 60 m depth of deployment no. 1, which was only determined in duplicate.
The following aliquots were filtered onto combusted GF/F filters (Whatmann, 25 mm): 400 mL (4 % of total sample) for the depths of 600 to 150 m of deployment no. 1, 420 mL (4 % of total sample) for the depths of 100 and 60 m of deploy- ment no. 1, and 100 mL (1 % of total sample) for all depths of deployment no. 2. For the depths of 200 to 60 m of de- ployment no. 1, the volume of 400 mL/420 mL (4 % of total sample) was filtered onto two filters due to the high particle load at these shallower depths. Organic phosphorus collected on the filters was digested in the potassium peroxodisulfate- containing substance Oxisolv (Merck) for 30 min in a pres- sure cooker and measured colorimetrically as orthophosphate following the method of Hansen and Koroleff (1999).
PHAAs were determined in duplicate. The following aliquots were filtered onto combusted GF/F filters (25 mm):
400 mL (4 % of total sample) for the depths of 600 m to 150 m of deployment no. 1, 420 mL (4 % of total sample) for the depths of 100 m and 60 m of deployment no. 1, and 100 mL (1 % of total sample) for all depths of deployment no. 2. For the depths of 150, 100 and 60 m of deployment no. 1, the volume of 400 mL/420 mL (4 % of total sample) was filtered onto two filters due to the high particle load at these shallower depths. PHAA analysis was performed according to Lindroth and Mopper (1979) and Dittmar et al. (2009) with some modifications. Duplicate samples were hydrolyzed for 20 h at 100◦C with hydrochloric acid (30 %, Suprapur, Merck) and neutralized by acid evaporation un- der vacuum in a microwave at 60◦C. Samples were washed with water to remove remaining acid. Analysis was per- formed on a 1260 HPLC system (Agilent). Thirteen different amino acids were separated with a C18 column (Phenomenex Kinetex, 2.6 µm, 150×4.6 mm) after in-line derivatization with o-phthalaldehyde and mercaptoethanol. The following standard amino acids were used: aspartic acid (AsX), glu- tamic acid (GlX), histidine (His), serine (Ser), arginine (Arg), glycine (Gly), threonine (Thr), alanine (Ala), tyrosine (Tyr), valine (Val), phenylalanine (Phe), isoleucine (Ileu), leucine (Leu) andγ-amino butyric acid (GABA). α-Amino butyric acid was used as an internal standard to account for losses during handling. Solvent A was 5 % acetonitrile (LiChrosolv, Merck, HPLC gradient grade) in sodium dihydrogen phos- phate (Merck, Suprapur) buffer (pH 7.0); solvent B was ace- tonitrile. A gradient was run from 100 % solvent A to 78 % solvent A in 50 min. The detection limit for individual amino acids was 2 nmol monomer L−1. The precision was < 5 %, es- timated as the standard deviation of replicate measurements divided by the mean. The degradation index (DI) was calcu- lated from the amino acid composition following Dauwe et al. (1999).
BSi was determined in triplicate. The following aliquots were filtered onto cellulose acetate filters (0.8 µm): 400 mL
(4 % of total sample) for the depths of 600 m to 150 m of deployment no. 1, 420 mL (4 % of total sample) for the depths of 100 m and 60 m of deployment no. 1, and 200 mL (2×100 mL; 2 % of total sample) for all depths of deploy- ment no. 2. Filters were incubated with 25 mL NaOH (0.1 M) at 85◦C for 2 h 15 min in a shaking water bath. After cool- ing of the samples, analysis was conducted according to the method for determination of Si(OH)4by Hansen and Korol- eff (1999). Fluxes of biogenic opal were calculated assuming a water content of ∼10 % and therefore the chemical for- mula SiO2×0.4H2O with a density of∼2.1 g cm−3(Mort- lock and Fröhlich 1989).
Chlawas determined in duplicate. The following aliquots were filtered onto GF/F filters (25 mm): 400 mL (4 % of total sample) for the depths of 600 to 150 m of deployment no. 1, 420 mL (4 % of total sample) for the depths of 100 m and 60 m of deployment no. 1, and 100 mL (1 % of total sample) for all depths of deployment no. 2. For the depths of 200 to 60 m of deployment no. 1, the volume of 400 mL/420 mL (4 % of total sample) was filtered onto two filters due to the high particle load at these shallower depths. Samples were analyzed after extraction with 10 mL of acetone (90 %) on a Turner fluorimeter after Welschmeyer (1994). Calibration of the instrument was conducted with spinach extract standard (Sigma Aldrich).
TEP were determined in quadruplet by microscopy after Engel (2009). Between 3.5 and 10 mL (0.03–0.1 % of total sample) for the depths of deployment no. 1 and no. 2 were fil- tered onto 0.4 µm Nuclepore membrane filters (Whatmann) and stained with 1 mL Alcian Blue solution. Filters were mounted onto Cytoclear© slides and stored at −20◦C un- til microscopy analysis using a light microscope (Zeiss Axio Scope A.1) connected to a camera (AxioCam MRc). Filters were screened at 200x magnification. Thirty pictures were taken randomly from each filter in two perpendicular cross sections (15 pictures each; resolution 1040×1040 pixel, 8- bit color depth). Image analysis software WCIF ImageJ (ver- sion 1.44, public domain, developed at the US National In- stitutes of Health, courtesy of Wayne Rasband, National In- stitute of Mental Health, Bethesda, Maryland) was used to semiautomatically analyze particle numbers and area.
The carbon content of TEP (TEP-C) was estimated after Mari (1999) using the size-dependent relationship:
TEP−C=a6i(niriD), (1)
withni being the number of TEP in the size classi andri
the mean equivalent spherical radius of the size class. The constanta=0.25×10⁻⁶(µg C) and the fractal dimension of aggregatesD=2.55 were proposed by Mari (1999). TEP- C was only calculated for the size fraction < 5 µm, including mainly free TEP, because larger TEP included TEP covered aggregates with solid particles. Estimating carbon content of these larger particles would overestimate TEP-C as the vol- ume of the other particles would be included.
2.3 Calculations and statistics
Fluxes of CaCO3and lithogenic matter (lith) were calculated as
[CaCO3+lith] = [TPM] − [POM] − [Opal]. (2) Total mineral ballast (ballasttotal)was calculated as
[ballasttotal] = [TPM] − [POM]. (3) The percentage of ballasttotal(%ballasttotal) was calculated as [%ballasttotal] =([TPM] − [POM])/[TPM] ×100. (4) The transfer efficiency (Teff)of particulate components was calculated as the ratio of fluxes at 600 m to those at 100 m.
Calculated mean values include replicate measurements of both deployments. Data fits and statistical tests were per- formed with the software packages Microsoft Office Ex- cel 2010, Sigma Plot 12.0 (Systat) and Ocean Data View 4 (ODV) (Schlitzer, 2015). Weighted-average gridding was used in ODV to display data according to data coverage with automatic scale lengths. The overall significance level was p<0.05.
3 Results and discussion
3.1 Fluxes of different compounds
Export fluxes of TPM and particulate organic elements de- termined during both trap deployments showed good over- all agreement and a decrease with depth, fitting well to the power law function of M87 (Figs. 2a–d, 3a–d and Ta- ble 1). Averaging fluxes from both deployments yielded a total mass flux of 240±34 mg m−2d−1 at 100 m de- creasing to 141±8.8 mg m−2d−1 in the core of the OMZ (400 m) (Fig. 2a). Fluxes of POC, PN and POP at 100 m depth were 73±8.8, 13±1.4 and 0.67±0.06 mg m−2d−1, respectively, and decreased to 26±4.5, 3.0±0.41 and 0.19±0.04 mg m−2d−1 at 400 m depth (Fig. 2b–d). The contribution of POC flux to total mass flux (% OC) decreased from about 30 % at 60–150 m depth to 17–20 % at 400 m depth and showed only a minor decrease below 400 m, to 14–16 % at 600 m depth. Similarly, the percentage of PN flux to total mass flux (% N) showed the largest decrease between 60 and 400 m, i.e., from 6.6 to 2.0–2.3 %, with less decline observed below, reaching 1.7–1.8 % at 600 m. The percentage of POP flux to total mass flux (% P) decreased from 0.37 % at 60 m depth to 0.11–0.16 % at 400 m depth and remained constant below 400 m depth. No previous data are available for POM export fluxes at our study site for di- rect comparison. However, our trap data compare well to car- bon export fluxes estimated from particle size data (i.e., 10–
300 mg C m−2d−1)reported for 100 m depth in the area off Cape Blanc (Mauritania) by Iversen et al. (2010).
Table 1.Fluxes of particulate components at 100m depth (F100)and in the core of the OMZ at 400m (FOMZ), as well as the associated attenuation coefficients (bvalues) and transfer efficiencies (Teff, %) over the depth range of 100 to 600 m during two traps deployments in the ETNA. All units are in mg m−2d−1except for TEP fluxes, which is reported in total particle area cm−2m−2d−1. Mean values and standard deviations (SD) were calculated from analytical replicates.
Component F100 FOMZ bvalue Teff( %)
mean SD mean SD mean SD r2 (600/100 m)
Mass I 249 48.9 141 6.8 −0.429 0.090 0.987 41
II 231 16.3 141 12.1 −0.355 0.033 0.998 52
POC I 69.4 9.23 23.8 5.4 −0.795 0.031 0.989 23
II 76.3 8.43 28.1 3.0 −0.741 0.044 0.989 22
PN I 11.9 1.29 2.76 0.46 −1.013 0.026 0.992 15
II 13.5 1.12 3.26 0.19 −1.00 0.020 0.990 16
POP I 0.71 0.07 0.15 0.02 −1.081 0.074 0.992 18
II 0.64 0.03 0.22 0.02 −0.80 0.034 0.990 23
Opal I 44.6 1.76 34.0 1.7 −0.0195 0.038 0.987 65
II 48.6 4.16 30.7 2.0 −0.345 0.052 0.987 44
Chla I 0.10 0.00 0.035 0.001 −0.820 0.024 0.990 21
II 0.12 0.01 0.053 0.005 −0.625 0.082 0.988 24
TEP I 1650 548 1190 368 −0.498 0.014 0.548 33
II 2990 348 1644 95 −0.451 0.069 0.810 37
PHAA-C I 3.21 – 3.71 0.47 −1.324 0.067 0.994 11
II 1.28 0.10 5.24 0.79 −0.978 0.096 0.991 14
Fluxes of phytoplankton biomass, as indicated from Chl a, were similar at 100 m during both deployments, with 104±1.5 µg Chl am−2d−1 during the first and 116±6.2 µg m−2d−1during the second deployment, but be- haved differently below, with a stronger flux attenuation above the OMZ during the first compared to the second deployment (Fig. 3a). Fluxes within the OMZ core were 35±0.1 µg m−2d−1(no. 1) and 53±0.5 µg m−2d−1(no. 2) respectively.
Opal fluxes were also similar during both deployments, yielding an average of 47±3.6 mg m−2d−1 at 100 m, steadily decreasing to 32±2.4 mg m−2d−1 at 400 m depth (Fig. 3b). Similar to Chla, opal fluxes were slightly higher above the OMZ during the second compared to the first de- ployment but quite similar or even lower below the OMZ.
This may indicate that the second trap device, which drifted more northerly (Fig. 1c), exploited waters of a more recent diatom bloom compared to the first deployment.
Fluxes of [CaCO3+lith] were similar to opal fluxes dur- ing the first deployment (F100=52 mg m−2d−1) but con- siderably lower during the second (F100=14.8 mg m−2d−1) (data not shown).
During this study, export fluxes of TEP were estimated from decrease over depth of total particle area and showed the strongest depth attenuation between 60 and 100 m dur- ing the first deployment (Fig. 3c). Like Chl a fluxes, TEP export fluxes were slightly higher during the second com- pared to the first deployment. At 100 m depth, average TEP flux was 2323±859 cm2m−2d−1 and decreased to 1418±342 cm2m−2d−1at 400 m. Using a TEP size to car-
bon conversion according to Mari (1999) yielded to an av- erage TEP-C (< 5 µm) flux of 1.73±0.35 mg C m−2d−1at 100 m depth, slightly decreasing to 1.64±0.28 mg m−2d−1 at 400 m and further to 0.90±0.32 mg m−2d−1at 600 m. Al- though TEP supposedly play an important role in particle ex- port fluxes (Passow, 2002; Arrigo, 2007; Chow et al., 2015), only a few previous estimates for TEP export fluxes based on sediment traps have been given so far to which we can compare our data. Martin et al. (2011) measured TEP export fluxes during a spring bloom in the Iceland Basin (northeast Atlantic Ocean) using the PELAGRA neutrally buoyant sed- iment traps and determined values in the range of 30–120 mg xanthan gum equivalent m−2d−1. Ebersbach et al. (2014) ob- tained lower values of 0.03–5.14 mg xanthan gum equiva- lent m−2d−1during the LOHAFEX iron fertilization exper- iment in the Southern Ocean. Assuming a conversion factor of 0.63 µg C µg−1xanthan gum after Engel (2004), these pre- vious estimates suggest TEP-C export fluxes ranging from 0.02 to 3 mg m−2d−1 for the Southern Ocean and from 19 to 75 mg m−2d−1for the North Atlantic spring bloom. Our data on TEP export fluxes for ETNA region are within the range of these previous studies but closer to the lower es- timates for the Southern Ocean. It has to be emphasized, though, that our calculated TEP-C fluxes are likely underes- timates, since only suspended, i.e., “free” TEP < 5 µm, were taken into account. TEP-C associated to aggregates cannot be determined with the applied microscopic technique. Over- all, TEP-C export fluxes in the ETNA were significantly re- lated to Chla fluxes, yielding [TEP-C, mg m−2d−1]=11.9 [Chla; mg m−2d−1]+0.74 (r2=0.59,n=15,p<0.01).
Total mass flux [mg m d ]-2 -1
0 100 200 300 400 500
Depth [m]
60 60 60 100 150 200 300 400 500 600
POC flux [mg m-2 d-1]
0 40 80 120 160
60 60 60 100 150 200 300 400 500
600
(a) (b)
PN flux [mg m-2 d-1]
0 10 20 30
Depth [m]
60 60 60 100 150 200 300 400 500 600
POP flux [mg m-2 d-1]
0.0 0.5 1.0 1.5
60 60 60 100 150 200 300 400 500
600
(c) (d)
Figure 2.Fluxes of(a)total mass and(b)particulate organic car- bon (POC), (c)particulate nitrogen (PN) and (d) particulate or- ganic phosphorus (POP) during the deployment of two STDT in the ETNA. Solid symbols are used for deployment no. 1 and open symbols for deployment no. 2.
A strong decrease at shallow depth (60–100 m) was also observed for PHAA fluxes during the first deployment (Fig. 3d). Average PHAA fluxes were 330±51 µmol m−2d−1at 100 m and 90±20 µmol m−2d−1 in the OMZ core at 400 m. These fluxes are equivalent to amino-acid-related fluxes of 16.8±2.6 (100 m) and 4.48±1.0 mg C m−2d−1 (400 m), respectively, which are typical values for PHAA-C fluxes in the ocean (Lee and Cronin, 1984). PHAA fluxes decreased slightly within the OMZ, i.e., from 300 to 500 m.
3.2 Flux attenuation in the ETNA OMZ
Fluxes from both deployments were fitted to the exponential decrease model (Martin et al., 1987) and attenuation coeffi- cients (bvalues) were estimated for all components (Table 1).
Higherbvalues suggest stronger attenuation and may hint to
Chl a flux [µg m-2 d-1]
0 40 80 120 160
Depth [m]
60 60 60 100 150 200 300 400 500 600
Opal flux [mg m-2 d-1]
10 20 30 40 50 60
60 60 60 100 150 200 300 400 500
600
(a) (b)
TEP flux [cm2 m-2 d-1]
0 2000 4000 6000
Depth [m]
60 60 60 100 150 200 300 400 500 600
PHAA flux [µmol m-2 d-1]
0 200 400 600 800
60 60 60 100 150 200 300 400 500
600
(c) (d)
Figure 3.Fluxes of(a)chlorophylla (Chla),(b) opal,(c)TEP and(d)PHAA during the deployment of two STDT in the ETNA.
Solid symbols are used for deployment no. 1 and open symbols for deployment no. 2.
either reduced sinking velocities of particles or faster degra- dation of more labile components. During this study, PHAAs were the most rapidly attenuated components of sinking par- ticles, followed by POP, PN, POC, Chlaand TEP (Table 1).
Attenuation of mineral fluxes was less pronounced than for TPM.
Attenuation coefficient of POC export fluxes was 0.80 dur- ing the first and 0.74 during the second deployment. These values are in the intermediate range of previously determined bvalues for POC attenuation in the mesopelagic, shown to vary between 0.51 as determined in the North Pacific (K2) and 1.59 as determined for the North Atlantic subpolar gyre (NASG) (Buesseler et al., 2007a; Marsay et al., 2015). Based on trap data from fully oxygenated water columns, Marsay et al. (2015) recently suggested a linear relationship be- tween POC flux attenuation and median water temperature within the upper 500 m of the water column according to b=0.062T+0.303. Applying this relationship to our study
area, with temperature decreasing from 26◦C at the surface to 9◦C at 500 m and a median temperature value of 12.01◦C, would give abvalue of 1.05. This estimatedbvalue is higher than the values observed in this study (0.74–0.80) and sug- gests that oxygen deficiency may reduce attenuation of POC fluxes in the ETNA, resulting in higherTeffof organic matter though the OMZs compared to well-oxygenated waters.
Differences in flux attenuation coefficients translate into different Teff for individual components, with PHAA being the least and TEP being the most efficiently exported organic component (Table 1). In particular, values of Teff for TEP and therewith for TEP-C were about 3 times higher than for PHAA-C and even higher than for bulk POC, suggesting a preferential export of carbon included in TEP below 100 m.
However, a steep decrease of TEP flux was observed between 60 and 100 m during the first deployment. TEP are produced by a variety of organisms, i.e., different phytoplankton and bacterial species, and cannot be considered as of homoge- nous composition. Several mechanisms may therefore be re- sponsible for a change in TEP transfer efficiency with depth:
(1) change of TEP degradability with depth; (2) differences in TEP composition over depth related to association with particles of different settling speed; (3) new production of TEP, abiotically or by bacteria, during solubilization and degradation of sinking particles; (4) capture of suspended TEP by sinking aggregates; or (5) reduced degradation rate of TEP at lower oxygen. In support of the latter hypothesis, an attenuation of TEP fluxes within the OMZ (300–500 m) was not detectable but did occur again below the OMZ.
3.3 Changes in POM composition during export POM, assumed to be 2.2×[POC] following Klaas and Archer (2002), made the greatest contribution to TPM flux at 60 m but decreased below. Conversely, [%ballasttotal] in- creased with depth, namely from 30 %w/wat 60 m to 68 % w/wat 600 m.
Biogenic opal (density: 2.1 g cm−3)in the ocean is pro- duced mainly by diatoms and radiolaria. During this study, opal made a rather constant contribution to TPM fluxes with 20–25 % weight below 100 m. Hence, the observed increase in the [%ballasttotal] with depth was due to an increasing contribution of CaCO3 and lithogenic material. [CaCO3+ lith] to TPM increased from 10 to 15 % above 150 m to 45 % at 600 m. As a consequence, the ballast ratio, defined as [Opal]:[CaCO3+lith], changed from a dominance of opal above the OMZ to a dominance [CaCO3+lith] within and below the OMZ (Fig. 4). Slight differences were observed between the two deployments. Contribution of opal and of [CaCO3+lith] to TPM at 100 m was almost equal during the first deployment with a share of 18 and 22 % respectively.
During the second deployment the contribution of opal to TPM at 100 m was 21 % but only 6 % for [CaCO3+lith].
Thus, the higher contribution of opal to TPM fluxes together with higher Chla fluxes indicated that diatomaceous mate-
[Opal] : [CaCO3+lith]
0.0 0.5 1.0 1.5 2.0 2.5 3.0 3.5
Depth [m]
0
100
200
300
400
500
600
700
Figure 4.Changes in mineral ballast ratios of sinking particles with depth during the two deployments in the ETNA. Black bars are used for deployment no. 1 and gray bars for deployment no. 2.
rial had a higher share of particles sinking out of the euphotic zone down to the OMZ core during the second compared to the first deployment.
Molar [POC] : [PN] ratios were close to the Redfield ra- tio at depths shallower than 100 m, increased to a ratio of 10 at 400 m depth and remained constant between 400 and 600 m depth (Fig. 5a). [PN] : [POP] ratios were much above Redfield, with values varying between 30 and 45 through- out the water column (Fig. 5b). Also, [POC] : [POP] ratios were much higher than Redfield ratios and showed an in- creasing trend down to 300–400 m depth, while decreasing below (Fig. 5c). These changes in elemental ratios suggested a preferential remineralization of POP in the upper 300 m, followed by PN and POC deeper down.
The percentage of total organic matter in TPM fluxes de- creased from 67 % at 100 m to 32 % at 600 m (Fig. 6d). As a consequence of higherTeffof TEP relative to bulk POC, con- tribution of TEP-C to POC increased significantly with depth during both deployments (p<0.01;r2=0.59, n=15) and was 2 % at 100 m and 6 % within and 5 % below the OMZ (Fig. 5e). Because TEP are neutrally buoyant, their export to depth depends on their incorporation into settling aggre- gates. In a laboratory study, Engel et al. (2009) observed that decomposition of TEP was faster relative to bulk POC for aggregates formed from calcifying and non-calcifyingEmil- iania huxleyicultures. In that experiment, aggregate decom- position was investigated under oxic conditions. Other stud- ies also showed fast microbial degradation of TEP under oxic
C : N [mol : mol]
5 6 7 8 9 10 11 12
Depth [m]
60 60 60 100 150 200 300 400 500 600
N : P [mol : mol]
20 30 40 50 60
(a) (b)
C : P [mol : mol]
100 200 300 400 500
POM : TPM [%]
25 50 75 100
60 60 60 100 150 200 300 400 500 600
(c)
(d)
TEP-C : POC [%]
0 2 4 6 8 10
THAA : POC [%]
0 10 20 30 40 50
(e) (f)
Figure 5.Changes in organic matter composition of particles sinking through the OMZ during the deployment of two STDT in the ETNA.
Solid symbols are used for deployment no. 1 and open symbols for deployment no. 2.
conditions (Bar-Zeev and Rahav, 2015). One possible expla- nation for increasing [TEP-C] : [POC] in the hypoxic OMZ of the ETNA region could be that TEP are mostly included in sinking aggregates, whereas POC could be included in various particle types, such as large cells, detritus or fecal pellets. Ploug et al. (1997) estimated that carbon turnover time inside anoxic aggregates can be strongly reduced. Due to high microbial activity and reduced water, exchange ag- gregates sinking into hypoxic waters are more likely to ex- perience anoxic conditions than individual particles (Ploug and Bergkvist, 2015). Thus, TEP settling into hypoxic wa- ters by aggregates may be exposed to anoxia, and therewith to reduced microbial degradation, in consequence leading to a preferential TEP transfer through the OMZ. This may also explain the decrease of [TEP-C] : [POC] ratios below the OMZ at 600 m water depth, which was, however, only observed during the second deployment. Since PN was more rapidly degraded than POC this also implied that the ratio of [PN] : [TEP-C] became lower with depth.
In contrast to [TEP-C] : [POC], values of [PHAA- C] : [POC] in POM fluxes declined during both deployments above the OMZ. However, within the core of the OMZ, at 400 m, [PHAA-C] : [POC] was higher than at 300 and 500 m (Fig. 5f); the same pattern was also observed for [PHAA- N] : [PN] (data not shown). A faster decline in PHAA in sink- ing particles mainly above but not within the OMZ is dif- ferent to observations gained for more extensively oxygen- deficient to full anoxic waters of the eastern tropical South Pacific (ETSP), which suggested that PHAAs are preferen- tially degraded under low-oxygen conditions (Van Mooy et al., 2002). In those studies, total hydrolyzable amino acid (THAA) degradation under anoxic conditions was found to continue with the same rate compared to oxic conditions, while degradation of non-amino acid compounds was found to slow down (Pantoja et al., 2004; Van Mooy et al., 2002). A preferential degradation of N-rich compounds over POC sug- gests that microbes degrading organic matter under strongly oxygen-deficient conditions via denitrification preferentially
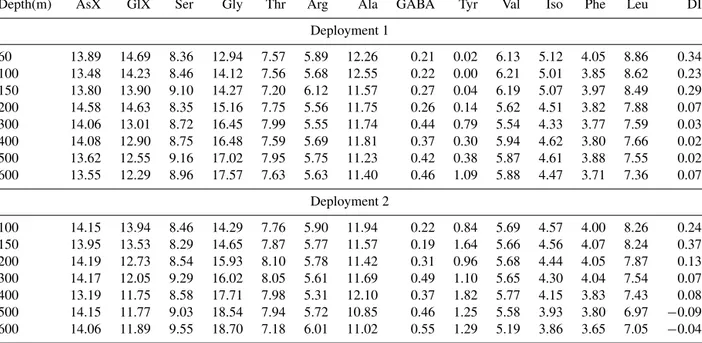
Table 2.Composition (%Mol) and degradation index (DI) of PHAA collected at different depths during two trap deployments (1 and 2) in the ETNA region.
Depth(m) AsX GlX Ser Gly Thr Arg Ala GABA Tyr Val Iso Phe Leu DI
Deployment 1
60 13.89 14.69 8.36 12.94 7.57 5.89 12.26 0.21 0.02 6.13 5.12 4.05 8.86 0.34
100 13.48 14.23 8.46 14.12 7.56 5.68 12.55 0.22 0.00 6.21 5.01 3.85 8.62 0.23
150 13.80 13.90 9.10 14.27 7.20 6.12 11.57 0.27 0.04 6.19 5.07 3.97 8.49 0.29
200 14.58 14.63 8.35 15.16 7.75 5.56 11.75 0.26 0.14 5.62 4.51 3.82 7.88 0.07
300 14.06 13.01 8.72 16.45 7.99 5.55 11.74 0.44 0.79 5.54 4.33 3.77 7.59 0.03
400 14.08 12.90 8.75 16.48 7.59 5.69 11.81 0.37 0.30 5.94 4.62 3.80 7.66 0.02
500 13.62 12.55 9.16 17.02 7.95 5.75 11.23 0.42 0.38 5.87 4.61 3.88 7.55 0.02
600 13.55 12.29 8.96 17.57 7.63 5.63 11.40 0.46 1.09 5.88 4.47 3.71 7.36 0.07
Deployment 2
100 14.15 13.94 8.46 14.29 7.76 5.90 11.94 0.22 0.84 5.69 4.57 4.00 8.26 0.24
150 13.95 13.53 8.29 14.65 7.87 5.77 11.57 0.19 1.64 5.66 4.56 4.07 8.24 0.37
200 14.19 12.73 8.54 15.93 8.10 5.78 11.42 0.31 0.96 5.68 4.44 4.05 7.87 0.13
300 14.17 12.05 9.29 16.02 8.05 5.61 11.69 0.49 1.10 5.65 4.30 4.04 7.54 0.07
400 13.19 11.75 8.58 17.71 7.98 5.31 12.10 0.37 1.82 5.77 4.15 3.83 7.43 0.08
500 14.15 11.77 9.03 18.54 7.94 5.72 10.85 0.46 1.25 5.58 3.93 3.80 6.97 −0.09 600 14.06 11.89 9.55 18.70 7.18 6.01 11.02 0.55 1.29 5.19 3.86 3.65 7.05 −0.04
utilize nitrogen-rich amino acids (Van Mooy et al., 2002).
Our data on PHAA do not suggest preferential amino acid loss due to components of sinking POM degradation in the ETNA OMZ. This is in accordance with the absence of mi- crobial N-loss processes and absence of denitrifying bacte- ria in ETNA oxygen-deficient waters (Löscher et al., 2016).
Instead, a slight increase of [PHAA-C] : [POC] in the OMZ may point to higher protein production by bacterial growth as previously observed for mesopelagic waters (Lee and Cronin, 1982, 1984) and may be related to increased growth efficiency of bacteria experiencing low-oxygen condition as suggested by Keil et al. (2016).
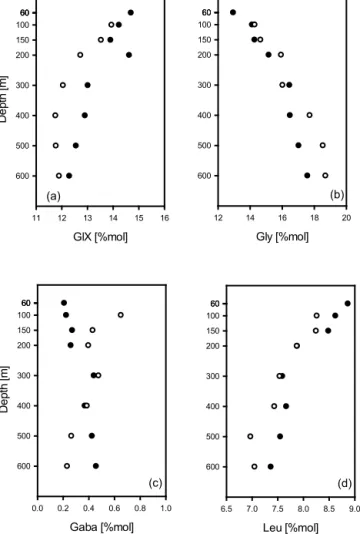
Among all amino acids determined, GlX, Gly, GABA and Leu showed the most pronounced variations with depth (Fig. 6a–d, Table 2). Whereas GlX and Leu decreased with depth (Fig. 6a, c), Gly continuously increased. It has been shown that Gly is enriched in the silica–protein complex of diatom frustules (Hecky et al., 1973). Preservation of frus- tules relative to POM may therefore explain the relative in- crease of Gly with depth in sinking particles. GlX has been used as a biomarker (Abramson et al., 2010), since GlX was shown to be enriched in calcareous plankton (Weiner and Erez, 1984). During this study %Mol of GlX was higher during the first deployment, which is in accordance with the observed higher contribution of [CaCO3+lith] to TPM flux.
GABA has been used as an indicator for bacterial decomposi- tion activity (Lee and Cronin, 1982; Dauwe and Middelburg, 1998; Engel et al., 2009). During this study %Mol GABA behaved differently during the first compared to the second deployment with similar values within the OMZ, a pattern also observed for opal fluxes (Fig. 3b). Moreover, %Mol of
GABA showed a local peak at 300 m, i.e., within the up- per oxycline, and may point to high bacterial activity at this depth. Leu is an essential amino acids and readily taken up by heterotrophic microorganisms. Little change in %Leu in the OMZ core (Fig. 3d) compared to above (< 300 m) indi- cated reduced microbial reworking of organic matter under hypoxic conditions. Another indication of microbial rework- ing of organic matter can be derived from the degradation in- dex (Dauwe et al., 1999). During this study, the DI decreased with increasing depth, but with differences between the de- ployments (Fig. 7). During no. 2, DI was slightly higher above the OMZ, indicating fresher material. During no. 1, the DI did not decrease within the OMZ, but it continued to decrease from 300 to 500 m depth during no. 2. Together with observations on Chlaand opal fluxes, as well as changes in ballast ratio, data on DI suggest that the particles of more di- atomaceous origin likely continued to decompose under hy- poxic conditions.
4 Conclusions
Despite an improvement in our understanding of the princi- ple processes and drivers of particle export processes over the past decades, spatial and temporal variability of export fluxes in the ocean is still difficult to predict. This is partly due to the lack of observations in different regions of the mesopelagic realm. Our study is the first to describe fluxes of POM in the hypoxic mesopelagic waters of the ETNA. Our data suggest a higher transfer efficiency than expected from seawater temperature solely, suggesting reduced degradation
GlX [%mol]
11 12 13 14 15 16
Depth [m]
60 60 60 100 150 200 300 400 500 600
Gly [%mol]
12 14 16 18 20
60 60 60 100 150 200 300 400 500
600
(a) (b)
Gaba [%mol]
0.0 0.2 0.4 0.6 0.8 1.0
Depth [m]
60 60 60 100 150 200 300 400 500 600
Leu [%mol]
6.5 7.0 7.5 8.0 8.5 9.0 60
60 60 100 150 200 300 400 500
600
(c) (d)
Figure 6.Molar percentages of selected amino acids contained in PHAA during the deployment of two STDT in the ETNA. Solid symbols are used for deployment no. 1 and open symbols for de- ployment no. 2.
of organic matter by heterotrophic communities at low oxy- gen concentration (< 60 µmol O2kg−1). The biological car- bon pump in high-productivity regimes associated to OMZs, i.e., eastern boundary upwelling systems such as the ETNA region off Mauritania, may therewith be more efficient than in fully oxygenated waters of comparable temperature. In contrast to suboxic systems (< 5 µmol O2kg−1)a relatively higher loss of amino acids from POM fluxes was not ev- ident for the hypoxic water column, suggesting microbial N-loss processes were comparatively minor within particles.
This, however, requires further investigation since no corre- sponding rate measurements of denitrification or anammox were conducted during this study. Organic matter composi- tion seems to have a large impact on Teff as carbon fluxes associated to amino acids were much more attenuated over depth than carbon fluxes associated to polysaccharide-rich TEP. If these findings are transferable to other oceanic re- gions, changes in surface ocean organic matter composition
DI
-0.1 0.0 0.1 0.2 0.3 0.4
Depth [m]
0 100 200 300 400 500 600 700
Figure 7.Degradation index (DI) of organic matter in trap-collected sinking particles based on amino acid composition and calculated according to Dauwe et al. (1999). Black bars are used for deploy- ment no. 1 and gray bars for deployment no. 2.
in response to climate change may also impact the carbon remineralization depth and therewith may have a feedback potential to atmospheric CO2concentration that has yet to be assessed.
Data availability. All data will become available at https://doi.
pangaea.de/10.1594/PANGAEA.874268 upon publication.
Competing interests. The authors declare that they have no conflict of interest.
Acknowledgements. This study is a contribution to the Col- laborative Research Center 754/SFB Sonderforschungsbereich 754 “Climate-Biogeochemistry Interactions in the Tropical Ocean”. We thank Martin Visbeck, Toste Tanhua, Tobias Hahn, Sunke Schmidtko and Gerd Krahmann for scientific and technical support as well as for providing oxygen and CTD data. Many thanks go to the shipboard scientific party and crew of Meteor cruise M105. Jon Roa, Ruth Flerus, Scarlett Sett and Tania Klüver are acknowledged for technical assistance. We thank Cindy Lee (Stony Brook University) for helpful advices. FACLM is supported by the DFG Excellence cluster Future Ocean. All data will become available at www.pangea.de upon publication.
Edited by: G. Herndl
Reviewed by: two anonymous referees
References
Abramson, L., Lee, C., Liu, Z. F., Wakeham, S. G., and Szlosek, J.:
Exchange between suspended and sinking particles in the north- west Mediterranean as inferred from the organic composition of in situ pump and sediment trap samples, Limnol. Oceanogr., 55, 725–739, doi:10.4319/lo.2009.55.2.0725, 2010.
Alldredge, A. L. and Cohen, Y.: Can microscale chemical patches persist in the sea? Microelectrode study of marine snow, fecal pellets, Science, 235, 689–691, 1987.
Alldredge, A. L. and Gotschalk, C. C.: Direct observation of the mass flocculation of diatom blooms: characteristics, settling ve- locities and formation of diatom aggregates, Deep-Sea Res., 36, 159–171, 1989.
Alldredge, A. L., Passow, U., and Logan, B. E.: The abundance and significance of a class of large, transparent organic particles in the ocean, Deep-Sea Res., 40, 1131–1140, 1993.
Arrigo, K. R.: Carbon cycle – Marine manipulations, Nature, 450, 491–492, 2007.
Azetsu-Scott, K. and Passow, U.: Ascending marine particles: Sig- nificance of transparent exopolymer particles (TEP) in the upper ocean, Limnol. Oceanogr., 49, 741–748, 2004.
Bar-Zeev, E. and Rahav, E.: Microbial metabolism of trans- parent exopolymer particles during the summer months along a eutrophic estuary system, Front. Microbiol., 6, 403, doi:10.3389/fmicb.2015.00403, 2015.
Belcher, A., Iversen, M., Manno, C., Henson, S. A., Tarling, G.
A., and Sanders, R.: The role of particle associated microbes in remineralization of fecal pellets in the upper mesopelagic of the Scotia Sea, Antarctica, Limnol. Oceanogr., 61, 1049–1064, doi:10.1002/lno.10269, 2016
Bishop, J. K. B., Ketten, D. K., and Edmon, J. M.: The chemistry, biology and vertical flux of particulate organic matter from the upper 400 m of the Cape Basin in the southeast Atlantic Ocean, Deep-Sea Res., 25, 1121–1161, 1978.
Buesseler, K. O.: The decoupling of production and particulate ex- port in the surface ocean, Global Biogeochem. Cy., 12, 297–310, 1998.
Buesseler, K. O. and Boyd, P. W.: Shedding light on processes that control particle export and flux attenuation in the twilight zone, Limnol. Oceanogr., 54, 1210–1232, 2009.
Buesseler, K. O., Lamborg, C. H., Boyd, P. W., Lam, P. J., Trull, T.
W., Bidigare, R. R., Bishop, J. K. B., Casciotti, K. L., Dehairs, F., Elskens, M., Honda, M., Karl, D. M., Siegel, D. A., Silver, M. W., Steinberg, D. K., Valdes, J., Van Mooy, B., and Wilson, S.: Revisiting carbon flux through the ocean’s twilight zone, Sci- ence, 316, 567–570, 2007a.
Buesseler, K. O., Antia, A., Chen, M., Fowler, S. W., Gardner, W.D., Gustafsson, O., Harada, K., Michaels, A. F., van der Loeff, M. R., Sarin, M., Steinberg, D. K., and Trull, T.: An assessment of the use of sediment traps for estimating upper ocean particle fluxes, J. Mar. Res., 65, 345–416, 2007b.
Cavan, E. L., Le Moigne, F. A. C., Poulton, A. J., Tarling, G.
A., Ward, P., Daniels, C. J., Fragoso, G. M., and Sanders, R.
J.: Attenuation of particulate organic carbon flux in the Scotia Sea, Southern Ocean, is controlled by zooplankton fecal pellets, Geophys. Res. Lett., 42, 821–830, doi:10.1002/2014GL062744, 2015
Chow, J. S., Lee, C., and Engel, A.: The influence of extracellular polysaccharides, growth rate, and free coccoliths on the coagu-
lation efficiency ofEmiliania huxleyi, Mar. Chem., 175, 5–17, 2015.
Dauwe, B. and Middelburg, J. J.: Amino acids and hexosamines as indicators of organic matter degradation state in North Sea sediments, Limnol. Oceanogr., 43, 782–798, 1998.
Dauwe, B., Middelburg, J. J., Herman, P. M. J., and Heip, C. H. R.:
Linking diagenetic alteration of amino acids and bulk organic matter reactivity, Limnol. Oceanogr., 44, 1809–1814, 1999.
Devol, A. H. and Hartnett, H. E.: Role of the oxygen minimum zone in transfer of organic carbon to the deep ocean, Limnol.
Oceanogr., 25, 1684–1690, 2001.
Dittmar, T., Cherrier, J., and Ludwichowski, K.-U.: The Analysis of Amino Acids in Seawater, in: Practical Guidelines for the Anal- ysis of Seawater, CRC Press, 2009.
Ebersbach, F., Assmy, P., and Martin, P., Schulz, I, Wolzenburg, S., and Nöthig, E. M.: Particle flux characterisation and sedimen- tation patterns of protistan plankton during the iron fertilisation experiment LOHAFEX in the Southern Ocean, Deep-Sea Res.
Pt. I, 89, 94–103, 2014.
Engel, A.: The role of transparent exopolymer particles (TEP) in the increase in apparent particle stickiness (alpha) during the decline of a diatom bloom, J. Plankton Res., 22, 485–497, 2000.
Engel, A.: Distribution of transparent exopolymer particles (TEP) in the northeast Atlantic Ocean and their potential significance for aggregation processes, Deep-Sea Res. Pt. I, 51, 83–92, 2004.
Engel, A.: Determination of Marine Gel Particles, in: Practical Guidelines for the Analysis of Seawater, edited, CRC Press, 2009.
Engel, A., Thoms, S., Riebesell, U., Rochelle-Newall, E., and Zon- dervan, I.: Polysaccharide aggregation as a potential sink of ma- rine dissolved organic carbon, Nature, 428, 929–932, 2004.
Engel, A., Abramson, L., Szlosek, J., Liu, Z., Stewart, G., Hirschberg, D., and Lee, C.: Investigating the effect of ballasting by CaCO3inEmiliania huxleyi, II: Decomposition of particulate organic matter, Deep-Sea Res. Pt. II, 56, 1408–1419, 2009.
Engel, A., Piontek, J., Grossart, H. P., Riebesell, U., Schulz, K. G., and Sperling, M.: Impact of CO2enrichment on organic matter dynamics during nutrient induced coastal phytoplankton blooms, J. Plankton Res., 36, 641–657, doi:10.1093/plankt/fbt125, 2014.
Giering, S. L. C., Sanders, R., Lampitt, R. S.„ Anderson, T.
A.,Tamburini, C., Boutrif, M., Zubkov, M. V., Marsay, C. M., Henson, S. A., Saw, K., Cook, K., and Mayor, D. J.: Reconcili- ation of the carbon budget in the ocean’s twilight zone, Nature, 507, 480–483, 2014.
Haake, B., Ittekkot, V., Ramaswamy, V., Nair, R. R., and Honjo, S.
Fluxes of amino acids and hexosamines to the deep Arabian Sea, Mar. Chem., 40, 291–314, 1992.
Hansen, H. P. and Koroleff, F.: Determination of nutrients, in: Meth- ods of seawater analysis, edited by: Grasshof, K., 159–228, 1999.
Hecky, R. E., Mopper, K., Kilham, P., and Degens, E. T.: Amino acid and sugar composition of diatom cell-walls, Mar. Biol., 19, 323–331, doi:10.1007/BF00348902, 1973.
Heinze, C., Meyer, S., Goris, N., Anderson, L., Steinfeldt, R., Chang, N., Le Quere, C., and Bakker, D. C. E.: The ocean car- bon sink – impacts, vulnerabilities and challenges, Earth Syst.
Dynam., 6, 327–358, doi:10.5194/esd-6-327-2015, 2015.
Iversen, M. H., Nowald, N., Ploug, H., Jackson, G. A., and Fis- cher, G.: High resolution profiles of vertical particulate or- ganic matter export off Cape Blanc, Mauritania: Degradation
processes and ballasting effects, Deep-Sea Res., 57, 771–784, doi:10.1016/j.dsr.2010.03.007, 2010.
Keil, R. G., Neibauer, J. A., Biladeau, C., van der Elst, K., and Devol, A. H.: A multiproxy approach to understanding the “en- hanced” flux of organic matter through the oxygen-deficient waters of the Arabian Sea, Biogeosciences, 13, 2077–2092, doi:10.5194/bg-13-2077-2016, 2016.
Klaas, C. and Archer, D. E.: Association of sinking organic mat- ter with various types of mineral ballast in the deep sea: Im- plications for the rain ratio, Global Biogeochem. Cy., 16, 1116, doi:10.1029/2001GB001765, 2002.
Knauer, G. A., Martin, J. H., and Bruland, K. W.: Fluxes of particu- late carbon, nitrogen, and phosphorus in the upper water column of the northeast Pacific, Deep-Sea Res., 26, 97–108, 1979.
Kohlfeld, K. E. and Ridgewell, A. Glacial-Interglacial Variabil- ity in Atmospheric CO2, in: Surface Ocean–Lower Atmosphere Processes Geophysical Research Series, American Geophysical Union, 187, 251–286, doi:10.1029/2008GM000845, 2009.
Kwon, E. Y., Primeau, F., and Sarmiento J. L.: The impact of rem- ineralization on the air-sea carbon balance, Nat. Geosci., 2, 630–
635, doi:10.1038/ngeo612, 2009.
Lam, P. J, Doney, S. C., and Bishop J. K. B.: The dynamic ocean biological pump: Insights from a global compilation of partic- ulate organic carbon, CaCO3 and opal concentrations profiles from the mesopelagic, Global Biogeochem. Cy., 25, GB3009, doi:10.1029/2010GB003868, 2011.
Lampitt, R. S., Noji, T., and Von Bodungen, B.: What happens to zooplankton fecal pellets-implications for material flux, Mar.
Biol., 104, 15–23, doi:10.1007/BF01313152, 1990.
Lee, C. and Cronin, C.: The vertical flux of particulate nitrogen in the sea: Decomposition of amino acids in the Peru upwelling area and the equatorial Atlantic, J. Mar. Res., 40, 227–251, 1982.
Lee, C. and Cronin, C., Particulate amino acids in the sea: Effects of primary productivity and biological decomposition, J. Mar. Res., 42, 1075–1097, 1984.
Le Moigne F., Sanders, R., Villa, M., Martin, A., Pabort- sava, K., Planquette, H., Morris, P. J., and Thomalla, S.: On the proportion of ballast vs. non-ballast associated sinking POC in the surface ocean, Geophys. Res. Lett., 39, L15610, doi:10.1029/2012GL052980, 2012.
Lindroth, P. and Mopper, K.: High performance liquid chro- matographic determination of subpicomole amounts of amino acids by precolumn fluorescence derivatization with o- phthaldialdehyde, Anal. Chem., 51, 1667–1674, 1979.
Löscher, C. R., Bange, H. W., Schmitz, R. A., Callbeck, C. M., En- gel, A., Hauss, H., Kanzow, T., Kiko, R., Lavik, G., Loginova, A., Melzner, F., Meyer, J., Neulinger, S. C., Pahlow, M., Riebe- sell, U., Schunck, H., Thomsen, S., and Wagner, H.: Water col- umn biogeochemistry of oxygen minimum zones in the eastern tropical North Atlantic and eastern tropical South Pacific oceans, Biogeosciences, 13, 3585–3606, doi:10.5194/bg-13-3585-2016, 2016.
Mari, X.: Carbon content and C : N ratio of transparent exopoly- meric particles (TEP) produced by bubbling exudates of diatoms, Mar. Ecol. Progr. Ser., 183, 59–71, 1999.
Marsay, C. M., Sanders, R. J., Henson, S. S., Pabortsava, K., Achterberg, E. P., and Lampitt, R. S.: Attenuation of sink- ing particulate organic carbon flux through the mesopelagic
ocean, P. Natl. Acad. Sci. USA, 112, 1089–1094, doi:10.1073/
pnas.1415311112, 2015.
Martin, P., Lampitt, R. S., Perry, M. J. Sanders, R. Lee, C., and D’Asaro, E.: Export and mesopelagic particle flux during a North Atlantic spring diatom bloom, Deep-Sea Res. Pt. I, 58, 338–349, 2011.
Martin, J. H., Knauer, G. A., Karl, D. M., and Broenkow, W. W.:
Vertex – Carbon Cycling in the Northeast Pacific, Deep-Sea Res.
A, 34, 267–285, doi:10.1016/0198-0149(87)90086-0, 1987.
Mortlock, R. A. and Froelich, P. N.: A simple method for the rapid determina- tion of biogenic opal in pelagic marine sediments, Deep-Sea Res. Pt. A, 36, 1415–1426, 1989.
Pantoja, S., Sepúlveda, J., and González, H. E.: Decomposition of sinking proteinaceous material during fall in the oxygen mini- mum zone off northern Chile, Deep-Sea Res. Pt. I, 51, 55–70, 2004.
Passow, U.: Transparent exopolymer particles (TEP) in aquatic en- vironments, Prog. Oceanogr., 55, 287–333, 2002.
Passow, U., Shipe, R. F., Pak, D. K., Brzezinski, M. A., and All- dredge, A. L.: Origin of transparent exopolymer particles (TEP) and their role in the sedimentation of particulate matter, Cont.
Shelf Res., 21, 327–346, 2000.
Ploug, H. and Bergkvist, J.: Oxygen diffusion limitation and ammo- nium production within sinking diatom aggregates under hypoxic and anoxic conditions, Mar. Chem., 176, 142–149, 2015.
Ploug, H., Kühl M., Buchholz-Cleven, B., and Jørgensen, B. B.:
Anoxic aggregates – an ephemeral phenomenon in the pelagic environment?, Aquat. Microb. Ecol., 13, 285–294, 1997.
Schlitzer, R.: Ocean Data View, http://odv.awi.de, 2015.
Schneider, B., Engel, A., and Schlitzer, R.: Effects of depth- and CO2-dependent C : N ratios of particulate organic matter (POM) on the marine carbon cycle, Global Biogeochem. Cy., 18, GB2015, doi:10.1029/2003GB002184, 2004.
Soutar, A., Kling, S. A., Crill, P. A., Duffrin, E., and Bruland, K.
W.: Monitoring the marine environment through sedimentation, Nature, 266, 136–139, 1977.
Stief, P., Kamp, A., Thamdrup, B., and Glud, R. N.: Anaer- obic Nitrogen Turnover by Sinking Diatom Aggregates at Varying Ambient Oxygen Levels, Front. Micriobiol., 7, 98, doi:10.3389/fmicb.2016.00098, 2016.
Stramma, L., Johnson, G. C., Sprintall, J., and Mohrholz, V.: Ex- panding Oxygen-Minimum Zones in the Tropical Oceans, Sci- ence, 320, 655–658, 2008.
Suess, E.: Particulate organic carbon flux in the oceans – surface productivity and oxygen utilization, Nature, 288, 260–263, 1980.
Torres Valdez, S., Painter, C., Martin, A. P., Sanders, R., and Felden, J.: Data compilation of fluxes of sedimenting material from sed- iment traps in the Atlantic Ocean, Earth Syst. Sci. Data, 6, 123–
145, doi:10.5194/essd-6-123-2014, 2014.
Van Mooy, B. A. S., Keil R. G., and Devol, A. H.: Impact of sub- oxia on sinking particulate organic carbon: Enhanced carbon flux and preferential degradation of amino acids via denitrification, Geochim. Cosmochim. Ac., 66, 457–465, doi:10.1016/s0016- 7037(01)00787, 2002.
Visbeck M.: Oxygen in the Tropical Atlantic OSTRE Second Tracer Survey, Cruise, No. M105, 17 March–16 April 2014, Mindelo (Cape Verde), Mindelo (Cape Verde), METEOR- Berichte, M105, DFG-Senatskommission für Ozeanographie, 49 pp., doi:10.2312/cr_m105, 2014.
Volk, T. and Hoffert, M. I.: Ocean carbon pumps: Analysis of rela- tive strengths and efficiencies in ocean driven atmospheric CO2 changes, in: The Carbon Cycle and Atmospheric CO2: Natural Variations Archean to Present, edited by: Sundquist, E. T. and Broecker, W. S., Geophysical Monograph Series, Washington, DC, American Geophysical Union, 32, 99–110, 1985.
Weiner, S. and Erez, J.: Organic matrix of the shell of the foraminiferHeterostegina depressa, J. Foramin. Res., 14, 206–
212, 1984.
Welschmeyer, N. A.: Fluometric analysis of chlorophyll a in the resence of chlorophyllband pheopigments, Limnol. Oceanogr., 39, 1985–1992, 1994.