Niche construction by non-diazotrophs for N
2fixers in the eastern tropical North Atlantic Ocean
Arvind Singh1,2 , Lennart T. Bach1 , Tim Fischer1 , Helena Hauss1, Rainer Kiko1 , Allanah J. Paul1, Paul Stange1 , Pieter Vandromme1, and Ulf Riebesell1
1GEOMAR Helmholtz Centre for Ocean Research Kiel, Kiel, Germany,2Physical Research Laboratory, Ahmedabad, India
Abstract
Diazotrophic dinitrogen (N2)fixation contributes ~76% to“new”nitrogen inputs to the sunlit open ocean, but environmental factors determining N2fixation rates are not well constrained. Excess phosphate (phosphate–nitrate/16>0) and iron availability control N2fixation rates in the eastern tropical North Atlantic (ETNA), but it remains an open question how excess phosphate is generated within or supplied to the phosphate-depleted sunlit layer. Our observations in the ETNA region (8°N–15°N, 19°W–23°W) suggest thatProchlorococcusandSynechococcus, the two ubiquitous non-diazotrophic cyanobacteria with cellular N:P ratios higher than the Redfield ratio, create an environment of excess phosphate, which cannot be explained by diapycnal mixing, atmospheric, and riverine inputs. Thus, our results unveil a new biogeochemical niche construction mechanism by non-diazotrophic cyanobacteria for their diazotrophic phylum group members (N2fixers). Our observations may help to understand the prevalence of diazotrophy in low-phosphate, oligotrophic regions.Plain Language Summary
Diazotrophic cyanobacteria, only phytoplankton group capable to utilize dinitrogen as N source,flourish in warm oceans when phosphate and iron nutrients are available.However, some of the phosphate-depleted warm waters of the Atlantic Ocean are mysteriously known for their existence of diazotrophs. Upwellingfluxes, atmospheric deposition, and river inputs are depleted in phosphate compared to nitrate in this region. Hence, the reasons behind the source of excess phosphate supply for diazotrophy in this region are not known. Here we have discovered that non-diazotrophic cyanobacteria create an environment of excess phosphate through a virtual biological membrane for their diazotrophic phylum group members. In an environment of sustained phosphate supply in the oligotrophic waters, iron inputs seem to determine the magnitude of nitrogenfixing rates.
1. Introduction
In the open ocean, where bioavailable nitrogen (N) is scarce, the ability tofix dinitrogen (N2) is a competitive advantage for diazotrophs [Montoya et al., 2004] who contribute ~76% to“new”nitrogen inputs to the sunlit open ocean (estimated from Table 3 inJickells et al. [2017]). While numerous studies have shown that mixing, temperature, and organic matter concentration determine N2fixation rates [Howarth et al., 1988;Paerl, 1990;
Zehr and Paerl, 2008], it is well established that iron and phosphorus are the primary factors which limit these rates [Mills et al., 2004;Moore et al., 2009]. Based on the idea that N2fixation requires phosphate (PO43 ), and not nitrate (NO3 ), and that diazotrophs are outcompeted in regimes relatively high in NO3 , the global distribution of N2 fixation rates have been estimated using the concept of P* = [PO43 ] [NO3 ]/R [Deutsch et al., 2007], where R (N:P = 16:1) is the canonical Redfield ratio [Redfield, 1958].
The tropical North Atlantic Ocean is a region where low [PO43 ] limits primary production and N2fixation [Sañudo-Wilhelmy et al., 2001]. Yet N2fixation enigmatically occurs in this region at rates comparable to that at hot spots (e.g., the Arabian Sea) for diazotrophs in the world’s oceans [Capone et al., 2005;Luo et al., 2014].
This enigma has long puzzled biogeochemists [Landolfiet al., 2015]. Recent studies have highlighted the role of Ekman advection and upwelling in supplying excess PO43 to the euphotic zone of the equatorial Atlantic Ocean [Palter et al., 2011;Subramaniam et al., 2013;Reynolds et al., 2014]. However, since deeper water is NO3 rich and surface water is PO43 depleted, how excess PO43 could be supplied via upwelling in sunlit tropical waters remains debatable. Advective PO43 transport could be limited to sustain N2fixation in the western Atlantic [Palter et al., 2011] and might be consumed on its way to the eastern Atlantic as whole equa- torial to subtropical North Atlantic is PO43 limited [Sañudo-Wilhelmy et al., 2001].
Geophysical Research Letters
RESEARCH LETTER
10.1002/2017GL074218
Key Points:
•Non-diazotrophic cyanobacteria create an environment of excess phosphate for their diazotrophic phylum group members
•Iron inputs determine the magnitude of nitrogenfixing rates
•Ourfindings are a step forward in understanding the biological controls on N2fixation
Supporting Information:
•Supporting Information S1
Correspondence to:
A. Singh, arvinds@prl.res.in;
av.arvind@gmail.com
Citation:
Singh, A., L. T. Bach, T. Fischer, H. Hauss, R. Kiko, A. J. Paul, P. Stange,
P. Vandromme, and U. Riebesell (2017), Niche construction by non-diazotrophs for N2fixers in the eastern tropical North Atlantic Ocean,Geophys. Res. Lett.,44, doi:10.1002/2017GL074218.
Received 20 MAY 2017 Accepted 19 JUN 2017
Accepted article online 21 JUN 2017
©2017. American Geophysical Union.
All Rights Reserved.
The eastern tropical North Atlantic (ETNA) is oligotrophic, adjacent to an ample iron source (Sahara desert), and accounts for substantial N2fixation globally [Gruber and Sarmiento, 1997], thus a suitable site to under- stand the role of nutrients in N2fixation [Benavides and Voss, 2015]. In the oligotrophic oceans, slow-growing picophytoplankton that are adapted to low-light conditions occupy the ecological niche at the base of the photic zone, effectively utilizing NOx(NO3 + NO2 ) at low concentrations [Johnson and Lin, 2009;Martiny et al., 2009] and leading to the conspicuous deep chlorophyllamaximum (DCM). The most prominent mem- bers of this group are the non-diazotrophic cyanobacteriaProchlorococcusandSynechococcus. Due to their N-rich protein machinery required for efficient nutrient uptake, they assimilate nutrients at a N:P ratio greater than the Redfield ratio [Bertilsson et al., 2003;Kretz et al., 2015], which can hypothetically construct a niche of excess PO43 for their diazotrophic phylum group members. Here we tested this hypothesis and assessed the role and regulation of PO43 in N2fixation rates through concurrent sampling of N2fixation rates, primary production, phytoplankton abundance, nutrient concentration, and diapycnal nutrientfluxes in the ETNA.
2. Materials and Methods
Isotopically enriched (99% in heavier isotopes) tracer incubations were performed during R/VMeteorcruise M97 in the ETNA at 13 stations (NF-1 to NF-13; Figure 1) during June 2013 to estimate N2fixation rates and primary production followingMohr et al.[2010]. Incubatedfiltered samples were analyzed for particulate organic carbon (POC) and nitrogen (PON) and their isotopic composition using an elemental analyzer coupled to an isotope ratio mass spectrometer.
Samples for nutrients [Hansen and Koroleff, 2007], pigments [Mackey et al., 1996;Jeffrey et al., 1999], phyto- plankton [Picheral et al., 2010], and bacterial counts [Marie et al., 1999] were also analyzed. Aerosol optical depth (AOD) was measured using a Sun photometer [Prasad et al., 2007]. Microstructure observations combined with simultaneous nutrient profiles at seven sites were used to estimate diapycnal nutrientfluxes entering from below into the DCM (~50 m) and from the DCM into the mixed layer (ML; ~22 m). The uptake ratio in the DCM was estimated from the differences betweenfluxes into and out of the DCM [Fischer et al., 2013; Schlundt et al., 2014]. Microstructure profiles were performed with a tethered profiler (Sea&Sun Technology), immediately before or after the corresponding conductivity-temperature-depth and nutrient profile.
We performed a stepwise redundancy analysis (RDA) to assess the variance of N2fixation rates using physical, chemical, and biological parameters as explanatory variables [Legendre and Legendre, 2012; Singh and Ramesh, 2015]. After identifying the parameters that were correlated with N2fixation rates in the stepwise RDA, we used stepwise multiple linear regression (MLR) analysis to predict N2fixation rates as a function of these variables. A detailed methodology is provided in the supporting information [Levitus, 1982;Montoya et al., 1996].
3. Results
3.1. Biogeochemical Rates
We observed measurable to high depth-integrated N2fixation rates in the ETNA with values ranging from 9 to 77μmol N m 2d 1(mean ± standard deviation, 32 ± 23μmol N m 2d 1; Figure 1 and Table S1 in the supporting information). N2fixation rates decreased with depth, which was opposite to the primary produc- tion profile (Figure S1 in the supporting information). Integrated N2fixation rates were higher at NF-7 and NF-13 than at the other stations (Figure 1). Primary production ranged from 21 to 76 mmol C m 2d 1 (49 ± 17 mmol C m 2d 1; Table S1).
3.2. Hydrography
Since the highest N2fixation rates were generally observed near the surface (0–10 m; Figure S1), we present average values of physical and biogeochemical parameters for 0–10 m (Table S1). We observed uniform sea surface temperature (SST; 27.7 ± 0.9°C), sea surface salinity (35.7 ± 0.1), and a shallow mixed layer depth (MLD;
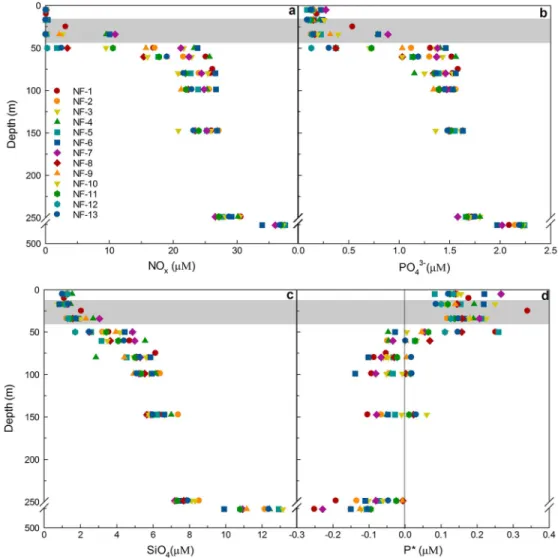
Table S1). The shallowest MLD (12 m) was at NF-13, while the deepest (42 m) was at NF-12. Mean nutrient concentrations were low in the ML (Figure 2). NOxwas close to the detection limit (0.02μM) at most of the stations, while some PO43 was present within the ML at all stations. Unlike NOx, silicate (SiO4) was always present at all the depths and ranged between 0.99 and 1.54 μM. P* ([PO43 ] [NOx]/16) was positive
within the ML, while it was mostly negative below the ML (Figure 2d).
Median N:P ratio in inorganic nutrient flux was 19:1 from below toward the DCM, while the median ratio was 12:1 from the DCM toward the ML (Figures 3 and 4). Median N:P uptake ratio was 27:1 in the DCM.
3.3. Microbial Abundances On average, Prochlorococcus (2 × 10⁵cells mL 1) were most abun- dant followed by Synechococcus (2 × 10⁴cells mL 1),Nano-eukaryotes (3 × 10³cells mL 1), andPico-eukar- yotes (53 cells mL 1) at the surface (Table S1).Pico-eukaryoteabundance was highest at the subsurface depths (>5 m), while other cells were mostly uniformly distributed in the ML (Figure S2). Diatoms were virtually absent at all depths, while dinoflagel- lates were present in negligible amounts (4 ng ChlaL 1; Table S1 and Figure S3).Trichodesmium were present in the euphotic zone (346 ± 638 colonies m 3) with highest surface layer values at station NF-7 followed by NF-13 (Table S1 and Figure S2a).
Calculations based on the red fluorescence measured by means of flow cytometry revealed that ProchlorococcusandSynechococcuscontributed 64% and 14%, respectively, to total redfluorescence, which suggests that these two genera dominated the phytoplankton community. Thisfinding is further strength- ened by estimates from the high-performance liquid chromatography data where bulk cyanobacteria (mainly ProchlorococcusandSynechococcus) contributed 58% to chlorophyll.
3.4. Regression Analysis
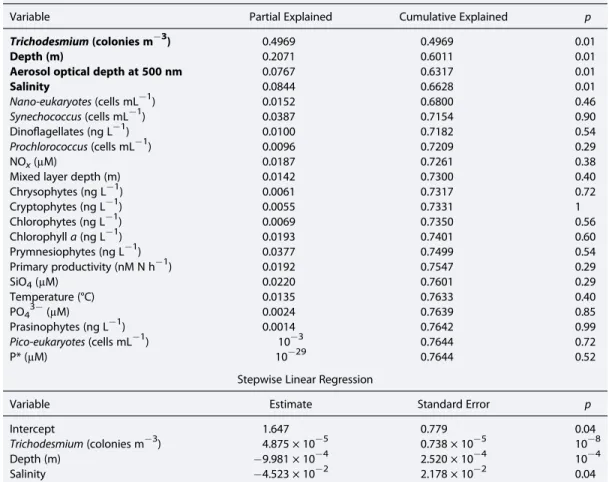
We observed excess PO43 at all sampling stations. There was no correlation between N2fixation rates and excess PO43 , but the rates were correlated (r2 = 0.20,p<0.001, no of data pointsn = 52) with in situ temperature. Surface rates tend to be anticorrelated (r2 = 0.29, p = 0.06,n = 52) with MLD. Observed Trichodesmium abundance explained 50% variation in the N2 fixation rates (Tables S1 and S12). While performing stepwise RDA and MLR, four variables (Trichodesmium abundance, sampling depth, salinity, and AOD) out of 22 variables (Table 1) could explain up to 66% (r2= 0.66,p<0.05,n= 51) variability in the N2fixation rates.Prochlorococcuscell abundances were positively correlated with N2fixation rates, while other microorganisms were mostly anticorrelated (Table S1). In situ temperature was strongly correlated with volumetricfixation (Table S1) but did not show up as important in the RDA because depth already contains temperature information.
4. Discussion
4.1. Role of Non-Diazotrophs in N2Fixation
There are several theories on physical and chemical controls on N2fixation but there is none on the role of biological controls/feedback in regulating N2fixation rates. However, in a study that highlighted the positive impact of upwelling on N2fixation in the tropical Atlantic,Subramaniam et al.[2013] mentioned the idea that non-diazotrophic cyanobacteria may cause changes in nutrients’N:P stoichiometry. The authors did not, however, follow up in their analyses on this, neither has this been rigorously evaluated by others.
Organisms, through their metabolic activities, can create their own niche by changing the environmental conditions—a process recognized as niche construction [Odling-Smee et al., 1996]. Furthermore, organisms can create environments that suit other organisms—a phenomenon which is an extension of niche Figure 1.Euphotic depth-integrated N2fixation rates (bubble plot) during
June 2013 overlaid on surface climatological P* distribution (nutrients data were obtained from World Ocean Atlas [Garcia et al., 2014]).
construction theory known as ecosystem engineering [Jones et al., 1997]. In this study, we found that non- diazotrophic cyanobacteria (e.g.,Prochlorococcus) alter the environment to the benefit of diazotrophs by generating excess P.
P* was positive within the ML, but mostly negative in subsurface water at some tens of meters below the ML (Figure 2d) as observed previously [Gruber and Sarmiento, 1997;Singh et al., 2013]. Upward transport of nutri- ents by physical processes alone, like diapycnal mixing, would bring waters of negative P* into the surface waters and not increase surface P*.
We hypothesize that other sources of positive P* could be rivers that debouch into the Senegalese waters or atmospheric deposition (Figure 4). The influence of the Gambia River, which is a major river that debouches into the ETNA, is likely restricted to coastal areas [Lesack et al., 1984]. Furthermore, it has NO3 :PO43 higher (51:1) than the Redfield ratio and thus cannot contribute to excess PO43 in the ETNA [Lesack et al., 1984].
Recently, it has been suggested that atmospheric inputs contain more PO43 over the Atlantic Ocean than previously suggested [Gross et al., 2015], but overall N:P (1000:1) in aerosols is much higher than the Redfield ratio [Baker et al., 2010]. Further, atmospheric PO43 deposition is insufficient to support observed N2fixation rates in the ETNA [Baker et al., 2007]. Hence, riverine and atmospheric sources of positive P* can be ruled out.
Figure 2.(a) NOx(NO3 + NO2 ), (b) PO43 , (c) SiO4, and (d) P* (=PO43 NOx/16) at the stations shown in Figure 1. The top edge of the gray shaded area represents the minimum value (12 m) of MLD while the lower edge is the maximum (42 m). The vertical line in Figure 2d separates positive and negative values of P*. Note the break on theyaxes at 250–448 m.
Modeled and measured values of dissolved organic matter (DOM) unanimously suggest that the ratio of dissolved organic nitrogen to that of phosphorus (DON:DOP) is higher (20–80) than the Redfield ratio in the ETNA [Vidal et al., 1999; Franz et al., 2012; Letscher and Moore, 2015] because DOP is remineralized about twice as fast as DON [Letscher and Moore, 2015]. Since the ETNA is phosphate limited, some fraction of DOP could be utilized by diazotrophs [Dyhrman et al., 2006;Van Mooy et al., 2012] before its remineralization could enhance P*. Moreover, recent analysis suggests that DOP constitu- tes only 23% of the total dissolved phosphorus pool in this region, lateral transport of which may not support diazotrophy in the ETNA because it is advected from the northwest African shelf toward the gyre interior [Reynolds et al., 2014].
Nonetheless, DOM, due to its remi- neralization, may partly explain the observed positive P* values.
So what else contributes to positive P* values? After exhausting all the probable factors that could contribute to positive P*, we found that positive P* values were driven by biology of the ETNA. Relatively PO43 -rich water can be generated through above-Redfieldian uptake of NO3 associated with phytoplankton stoichio- metry [Mills and Arrigo, 2010]. Indeed, slow-growing cyanobacteria, such as Prochlorococcus and Synechococcus, have higher cellular requirements of N than P [Bertilsson et al., 2003;Kretz et al., 2015]. In fact, these cyanobacteria synthesize a sugar membrane lipid rather than a lipid that contains PO43 [Van Mooy et al., 2006], and as a result their average cellular N:P = 33:1 is higher than the Redfield ratio [Singh et al., 2015]. Accordingly, it does not come as a surprise that these cyanobacteria preferentially uptake NO3 over PO43 [Yin et al., 2017].
PON:POP in the surface waters (30:1) and uptake ratio of NOxand PO43 (27:1) in the DCM (Figure 3) reflect ProchlorococcusandSynechococcusstoichiometry (Table S1 and Figure 3).ProchlorococcusandSynechococcus were the most abundant cells throughout the ML and dominated in terms of autotrophic biomass (Table S1 and Figures S2 and S3). Other phytoplankton with N:P ratios lower than the Redfield ratio, such as diatoms [Klausmeier et al., 2004], were virtually absent in our sampling area (Table S1 and Figures S2 and S3).
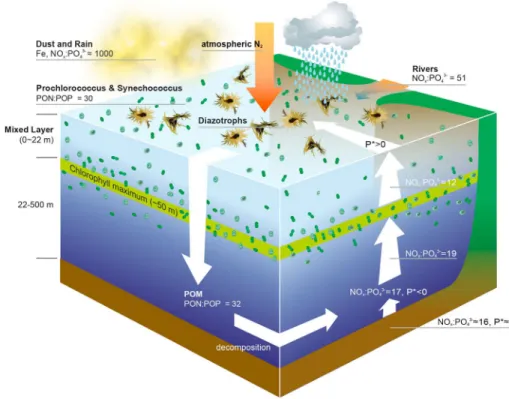
Furthermore, the biomass of other microorganisms (e.g., Cryptophytes) was negligible compared to Prochlorococcus(Table S1 and Figure S3). Even ifPico- andNano-eukaryotes were abundant, they would not have caused a great change in NO3 :PO43 stoichiometry as their N:P ratio is similar to the Redfield ratio [Singh et al., 2015]. The low NOx:PO43 (12:1) in the water leaving the DCM toward the ML suggests that the positive P* in the ML is generated byProchlorococcusandSynechococcuswhile the water crossed the DCM (Figures 3 and 4). In other words, the picocyanobacteria-rich DCM layer functions like a biological membrane thatfilters out part of the NOxfrom the upwelled water before it reaches to the surface (Figure 4).
Median N supply into the DCM was 2.5 nmol m 2s 1, which was less than the estimated mean N demand by ProchlorococcusandSynechococcus(4.2 nmol m 2 s 1; calculated by assuming thatProchlorococcusand Synechococcuscomplete their N uptake quota within 24 h [Partensky et al., 1999]). It suggests that regener- ated nutrients fulfill 40% of the N demand ofProchlorococcusandSynechococcus. Thus, our analysis allows Figure 3.Box-whisker plot showing NOx:PO43 ratio in the upward diapyc-
nalfluxes entering from below into the DCM (~50 m; shown as“FluxinDCM”), leaving the DCM into the MLD (~22 m; shown as“FluxoutDCM”) and biological uptake of nutrients (or loss of nutrients from the nutrients’pool in the DCM shown as“uptake”) in the DCM. These values were estimated at seven locations in the ETNA (8°N–15°N, 19°W–23°W) during 2009–2013 on three different cruises, including M97. Box-whisker plot horizontal line in the boxes shows the median values, boxes are bounded on the top by the third quartile and on the bottom by thefirst quartile, and short horizontal lines at the extreme represent the minimum and maximum values. The horizontal line separates the ratios from the Redfield ratio (N:P = 16).
the conclusion that positive P* in the ML is generated by non-diazotrophic cyanobacteria in and above the DCM (Figure 4).
4.2. Role of SST, MLD, and Macronutrients in N2Fixation
Our sampling area is characterized by low NOx, a shallow MLD, and high SST (Table S1); hence, our observa- tions are in agreement with earlier studies, which suggested that N2fixation occurs in oligotrophic, warm, and stratified waters [Staal et al., 2003;Langlois et al., 2008;Ratten et al., 2015].
Diazotrophsfix atmospheric N2 but their growth is constrained by [PO43 ] [Wu et al., 2000;Sohm et al., 2008]. Combining a global biogeochemical ocean model with observed climatology of [PO43 ] and [NO3 ] suggested that denitrification and N2fixation occurs in proximity to each other because denitrifi- cation creates an environment of excess PO43 [Deutsch et al., 2007]. However, we found no correlation of N2 fixation rates with [PO43 ] (Table S1). Furthermore, to our surprise, PO43 and P* were the least correlated parameters with N2 fixation rates in the stepwise MLR (Table 1). This is in line with earlier observations where higher [PO43 ] was not associated with higher N2 fixation rates in the ETNA [Staal et al., 2007] and elsewhere (e.g., the Indian Ocean [Shiozaki et al., 2014]). However, no correlation of N2 fixation rates with [PO43 ] must be interpreted with caution. No correlation does not mean that N2 fixa- tion is independent of PO43 : instead, we would rather conclude that at the time of our sampling, all phosphorous requirements to sustain N2fixation were fulfilled, and other factors (such as Fe) constrained the rates. [PO43 ] was above the detection limit (0.02 μM), unlike in previous observations [Wu et al., 2000]. Furthermore, P* was always positive within the ML at all the stations (Figures 2a and 2d).
Positive P* distribution from the World Ocean Atlas surface climatological data also matches with our observations (Figure 1), although the subeuphotic water in the North Atlantic Ocean is slightly PO43 deficient [Gruber and Sarmiento, 1997].
Figure 4.Diagram shows the evidences in support of our main conclusion that excess PO43 is generated by biogeochem- ical processes rather than by upwelling/diapycnal mixing. The brown color in the bottom represents the water below 500 m depth. All the estimates mentioned in the diagram are from our data, except for the NOx:PO43 ratios influxes from waters below 500 m [Gruber and Sarmiento, 1997;Singh et al., 2015], rivers [Lesack et al., 1984], and atmospheric deposition [Baker et al., 2010].
4.3. Role of Fe in N2Fixation
Fe is an essential nutrient for nitrogenase enzymes, which are responsible for N2 fixation [Raven, 1988].
Although we did not measure Fe on the cruise, there are parameters in our observations that can be used to understand the role of Fe in N2fixation. The ETNA, being in the proximity of the Saharan desert, receives Fe through dust deposition [Jickells et al., 2005]. Dust is deposited into the ocean through rain (wet deposi- tion) and gravitational settling (dry deposition) [Duce et al., 1991]. Since surface salinity is decreased by rain, it can be used as an indicator for wet deposition; while AOD can be used as an indicator of dry deposition.
Salinity has been used as an indicator of the migration of the Intertropical Convergence Zone (a phenomenon related to the rainfall patterns [Capone, 2014]), which was located in the north of equator, i.e., in our sampling area during June 2013 (Figure S4) [Kalnay et al., 1996]. Increase in rainfall results in an increase in the Fe deposi- tion in the Atlantic Ocean, which eventually enhances N2 fixation [Schlosser et al., 2014]. Stepwise RDA revealed that salinity and AOD are the only two parameters (other thanTrichodesmium, depth and, thus, light) that significantly (p<0.05) explain a part of the variation in N2fixation rates (Table 1). A negative salinity coef- ficient in the stepwise linear regression implies increase in N2fixation due to increase in freshwater input, while the positive AOD coefficient suggests increase in N2fixation rates at higher amounts of suspended dust in the atmosphere. Increase in dust deposition due to increase in rainfall would be inevitable in the ETNA as the troposphere in this region contains dust perennially [Jickells et al., 2005]. Hence, we infer that Fe deposition determines the magnitude of N2fixation rates in the ETNA, as suggested previously for ETNA and other oceans [Langlois et al., 2008;Shiozaki et al., 2014]. Bioassay experiments have also shown that both Fe and Saharan dust addition can increase N2fixation rates in the ETNA [Langlois et al., 2012;Krupke et al., 2014]. Having iden- tified Fe as a limiting nutrient, PO43 might be not be limiting since only one element limits the growth of organisms at any given time as proposed by the Liebig’s law of the minimum [Odum et al., 1971].
Table 1. Statistical Analysis of the 22 Environmental Parameters With Volumetric N2Fixation Rates of All the Data Stepwise Redundancy Analysis (RDA)a
Variable Partial Explained Cumulative Explained p
Trichodesmium(colonies m 3) 0.4969 0.4969 0.01
Depth (m) 0.2071 0.6011 0.01
Aerosol optical depth at 500 nm 0.0767 0.6317 0.01
Salinity 0.0844 0.6628 0.01
Nano-eukaryotes(cells mL 1) 0.0152 0.6800 0.46
Synechococcus(cells mL 1) 0.0387 0.7154 0.90
Dinoflagellates (ng L 1) 0.0100 0.7182 0.54
Prochlorococcus(cells mL 1) 0.0096 0.7209 0.29
NOx(μM) 0.0187 0.7261 0.38
Mixed layer depth (m) 0.0142 0.7300 0.40
Chrysophytes (ng L 1) 0.0061 0.7317 0.72
Cryptophytes (ng L 1) 0.0055 0.7331 1
Chlorophytes (ng L 1) 0.0069 0.7350 0.56
Chlorophylla(ng L 1) 0.0193 0.7401 0.60
Prymnesiophytes (ng L 1) 0.0377 0.7499 0.54
Primary productivity (nM N h 1) 0.0192 0.7547 0.29
SiO4(μM) 0.0220 0.7601 0.29
Temperature (°C) 0.0135 0.7633 0.40
PO43 (μM) 0.0024 0.7639 0.85
Prasinophytes (ng L 1) 0.0014 0.7642 0.99
Pico-eukaryotes(cells mL 1) 10 3 0.7644 0.72
P* (μM) 10 29 0.7644 0.52
Stepwise Linear Regression
Variable Estimate Standard Error p
Intercept 1.647 0.779 0.04
Trichodesmium(colonies m 3) 4.875 × 10 5 0.738 × 10 5 10 8
Depth (m) 9.981 × 10 4 2.520 × 10 4 10 4
Salinity 4.523 × 10 2 2.178 × 10 2 0.04
aVariables significant in RDA (in bold) were used in multiple regression.
5. Conclusions
Concurrent data on microorganisms’abundance, nutrients, and N2fixation rates from the ETNA suggest a major role that non-diazotrophic cyanobacteria play in generating excess PO43 for N2 fixation.
Prochlorococcus and Synechococcusseem to establish an environment of low NO3 and excess PO43 in the ecosystem as schematically summarized in the Figure 4. PO43 is prerequisite allowing N2fixation to occur as it strengthens competitive advantage of diazotrophs over faster growing microorganisms, such as diatoms. DOM stoichiometry may partly explain excess PO43 but it is a complex pool of nutrients and requires a better understanding of its uptake from thefield measurements. The role of atmospheric and river inputs in developing excess PO43 can be ruled out as both of these inputs have N:P ratios much higher than the Redfield ratio in this region. Statistical analysis suggests that the magnitude of N2fixation rates is influ- enced by Fe deposition. Ourfindings are a step forward in understanding the biological controls—in addition to the role of physical and chemical controls—on N2fixation. Our analysis could be used to improve the parameterization of N2fixation rates in biogeochemical models since current models do not consider the niche construction by non-diazotrophs to facilitate N2fixation.
References
Baker, A., K. Weston, S. Kelly, M. Voss, P. Streu, and J. Cape (2007), Dry and wet deposition of nutrients from the tropical Atlantic atmosphere:
Links to primary productivity and nitrogenfixation,Deep Sea Res., Part I,54(10), 1704–1720.
Baker, A. R., T. Lesworth, C. Adams, T. D. Jickells, and L. Ganzeveld (2010), Estimation of atmospheric nutrient inputs to the Atlantic Ocean from 50°N to 50°S based on large-scalefield sampling: Fixed nitrogen and dry deposition of phosphorus,Global Biogeochem. Cycles,24, GB3006, doi:10.1029/2009GB003634.
Benavides, M., and M. Voss (2015), Five decades of N2fixation research in the North Atlantic Ocean,Front. Mar. Sci.,2, 1–20, doi:10.3389/
fmars.2015.00040.
Bertilsson, S., O. Berglund, D. M. Karl, and S. W. Chisholm (2003), Elemental composition of marineProchlorococcusandSynechococcus:
Implications for the ecological stoichiometry of the sea,Limnol. Oceanogr.,48(5), 1721–1731.
Capone, D. G. (2014), An iron curtain in the Atlantic Ocean forms a biogeochemical divide,Proc. Natl. Acad. Sci.,111(4), 1231–1232.
Capone, D. G., J. A. Burns, J. P. Montoya, A. Subramaniam, C. Mahaffey, T. Gunderson, A. F. Michaels, and E. J. Carpenter (2005), Nitrogen fixation byTrichodesmiumspp.: An important source of new nitrogen to the tropical and subtropical North Atlantic Ocean,Global Biogeochem. Cycles,19, GB2024, doi:10.1029/2004GB002331.
Deutsch, C., J. L. Sarmiento, D. M. Sigman, N. Gruber, and J. P. Dunne (2007), Spatial coupling of nitrogen inputs and losses in the ocean, Nature,445(7124), 163–167.
Duce, R., P. Liss, J. Merrill, E. Atlas, P. Buat-Menard, B. Hicks, J. Miller, J. Prospero, R. Arimoto, and T. Church (1991), The atmospheric input of trace species to the world ocean,Global Biogeochem. Cycles,5(3), 193–259.
Dyhrman, S., P. Chappell, S. Haley, J. Moffett, E. Orchard, J. Waterbury, and E. Webb (2006), Phosphonate utilization by the globally important marine diazotrophTrichodesmium,Nature,439(7072), 68–71.
Fischer, T., D. Banyte, P. Brandt, M. Dengler, G. Krahmann, T. Tanhua, and M. Visbeck (2013), Diapycnal oxygen supply to the tropical North Atlantic oxygen minimum zone,Biogeosciences,10(7), 5079.
Franz, J., H. Hauss, U. Sommer, T. Dittmar, and U. Riebesell (2012), Production, partitioning and stoichiometry of organic matter under vari- able nutrient supply during mesocosm experiments in the tropical Pacific and Atlantic Ocean,Biogeosciences,9(11), 4629–4643.
Garcia, H., R. Locarnini, T. Boyer, J. Antonov, O. Baranova, M. Zweng, J. Reagan, and D. Johnson (2014), World Ocean Atlas 2013, Volume 4:
Dissolved inorganic nutrients (phosphate, nitrate, silicate), S,Mishonov Tech. Ed., 1–25.
Gross, A., T. Goren, C. Pio, J. Cardoso, O. Tirosh, M. Todd, D. Rosenfeld, T. Weiner, D. Custódio, and A. Angert (2015), Variability in sources and concentrations of Saharan dust phosphorus over the Atlantic Ocean,Environ. Sci. Technol. Lett.,2(2), 31–37.
Gruber, N., and J. L. Sarmiento (1997), Global patterns of marine nitrogenfixation and denitrification,Global Biogeochem. Cycles,11(2), 235–266.
Hansen, H. P., and F. Koroleff (2007), Determination of nutrients, inMethods Seawater Anal, 3rd ed., pp. 159–228, Wiley, Weinheim, Germany.
Howarth, R. W., R. Marino, and J. J. Cole (1988), Nitrogenfixation in freshwater, estuarine, and marine ecosystems. 2. Biogeochemical controls, Limnol. Oceanogr.,33(4), 688–701.
Jeffrey, S., S. Wright, and M. Zapata (1999), Recent advances in HPLC pigment analysis of phytoplankton,Mar. Freshw. Res.,50(8), 879–896.
Jickells, T., Z. An, K. K. Andersen, A. Baker, G. Bergametti, N. Brooks, J. Cao, P. Boyd, R. Duce, and K. Hunter (2005), Global iron connections between desert dust, ocean biogeochemistry, and climate,Science,308(5718), 67–71.
Jickells, T., et al. (2017), A re-evaluation of the magnitude and impacts of anthropogenic atmospheric nitrogen inputs on the ocean,Global Biogeochem. Cycles,31, 289–305, doi:10.1002/2016GB005586.
Johnson, Z. I., and Y. Lin (2009),Prochlorococcus: Approved for export,Proc. Natl. Acad. Sci.,106(26), 10,400–10,401, doi:10.1073/
pnas.0905187106.
Jones, C. G., J. H. Lawton, and M. Shachak (1997), Positive and negative effects of organisms as physical ecosystem engineers,Ecology,78(7), 1946–1957.
Kalnay, E., M. Kanamitsu, R. Kistler, W. Collins, D. Deaven, L. Gandin, M. Iredell, S. Saha, G. White, and J. Woollen (1996), The NCEP/NCAR 40-year reanalysis project,Bull. Am. Meteorol. Soc.,77(3), 437–471.
Klausmeier, C. A., E. Litchman, T. Daufresne, and S. A. Levin (2004), Optimal nitrogen-to-phosphorus stoichiometry of phytoplankton,Nature, 429(6988), 171–174.
Kretz, C. B., D. W. Bell, D. A. Lomas, M. W. Lomas, and A. C. Martiny (2015), Influence of growth rate on the physiological response of marine Synechococcusto phosphate limitation,Front. Microbiol.,6, 85, doi:10.3389/fmicb.2015.00085.
Krupke, A., W. Mohr, J. LaRoche, B. M. Fuchs, R. I. Amann, and M. M. Kuypers (2014), The effect of nutrients on carbon and nitrogenfixation by the UCYN-A–haptophyte symbiosis,ISME J.,9, 1635–1647.
Acknowledgments
We thank the Chief Scientist, Toste Tanhua, and all the participants of M97 cruise for their support. The cruise was funded by Deutsche Forschungsgemeinschaft (DFG) Sonderforschungsbereich (SFB 754). R.K.
and H.H. werefinanced by the DFG via the SFB 754“Climate-Biogeochemistry Interactions in the Tropical Ocean.”We acknowledge Kerstin Nachtigall, Saskia Audritz, Michael Meyerhöfer, Jana Meyer, and Bente Gardeler for their assistance in mass spectrometry, HPLC, CHEMTAX,flow cytometry, and nutrient analyses, respectively. Rene Redler and Alexander Smirnov are thanked for the AOD data. This work wasfinancially supported by a grant (CP1213) to A.S. by the Cluster of Excellence 80“The Future Ocean.”T.F. was funded by the Deutsche Bundesministerium für Bildung und Forschung (BMBF) as part of SOPRAN (03F0611A, and 03F0662A).
Rita Erven has helped in improving Figure 4. L. K. Sahu is thanked for pro- viding Figure S4. Iris Kriest and two anonymous reviewers are acknowl- edged for making valuable comments on our manuscript.
Landolfi, A., W. Koeve, H. Dietze, P. Kähler, and A. Oschlies (2015), A new perspective on environmental controls of marine nitrogenfixation, Geophys. Res. Lett.,42, 4482–4489, doi:10.1002/2015GL063756.
Langlois, R., M. M. Mills, C. Ridame, P. Croot, and J. LaRoche (2012), Diazotrophic bacteria respond to Saharan dust additions,Mar. Ecol. Prog.
Ser.,470, 1–14.
Langlois, R. J., D. Hümmer, and J. LaRoche (2008), Abundances and distributions of the dominant nifH phylotypes in the northern Atlantic Ocean,Appl. Environ. Microbiol.,74(6), 1922–1931.
Legendre, P., and L. F. Legendre (2012),Numerical Ecology, p. 2217, Elsevier, Amsterdam.
Lesack, L. F., R. E. Hecky, and J. M. Melack (1984), Transport of carbon, nitrogen, phosphorus, and major solutes in the Gambia River, West Africa,Limnol. Oceanogr.,29(4), 816–830.
Letscher, R. T., and J. K. Moore (2015), Preferential remineralization of dissolved organic phosphorus and non-Redfield DOM dynamics in the global ocean: Impacts on marine productivity, nitrogenfixation, and carbon export,Global Biogeochem. Cycles,29, 325–340, doi:10.1002/
2014GB004904.
Levitus, S. (1982), Climatological atlas of the world ocean,NOAA Prof Pap.,13, pp. 1–173.
Luo, Y.-W., I. D. Lima, D. M. Karl, C. A. Deutsch, and S. C. Doney (2014), Data-based assessment of environmental controls on global marine nitrogenfixation,Biogeosciences,11, 691–708.
Mackey, M., D. Mackey, H. Higgins, and S. Wright (1996), CHEMTAX—A program for estimating class abundances from chemical markers:
Application to HPLC measurements of phytoplankton,Mar. Ecol. Prog. Ser.,144, 265–283.
Marie, D., C. P. Brussaard, R. Thyrhaug, G. Bratbak, and D. Vaulot (1999), Enumeration of marine viruses in culture and natural samples byflow cytometry,Appl. Environ. Microbiol.,65(1), 45–52.
Martiny, A. C., S. Kathuria, and P. M. Berube (2009), Widespread metabolic potential for nitrite and nitrate assimilation amongProchlorococcus ecotypes,Proc. Natl. Acad. Sci.,106(26), 10,787–10,792, doi:10.1073/pnas.0902532106.
Mills, M. M., and K. R. Arrigo (2010), Magnitude of oceanic nitrogenfixation influenced by the nutrient uptake ratio of phytoplankton,Nat.
Geosci.,3(6), 412–416.
Mills, M. M., C. Ridame, M. Davey, J. La Roche, and R. J. Geider (2004), Iron and phosphorus co-limit nitrogenfixation in the eastern tropical North Atlantic,Nature,429(6989), 292–294.
Mohr, W., T. Grosskopf, D. W. Wallace, and J. LaRoche (2010), Methodological underestimation of oceanic nitrogenfixation rates,PLoS One, 5(9), e12583.
Montoya, J. P., M. Voss, P. Kähler, and D. G. Capone (1996), A simple, high-precision, high-sensitivity tracer assay for N2fixation,Appl. Environ.
Microbiol.,62(3), 986–993.
Montoya, J. P., C. M. Holl, J. P. Zehr, A. Hansen, T. A. Villareal, and D. G. Capone (2004), High rates of N2fixation by unicellular diazotrophs in the oligotrophic Pacific Ocean,Nature,430(7003), 1027–1032.
Moore, C. M., M. M. Mills, E. P. Achterberg, R. J. Geider, J. LaRoche, M. I. Lucas, E. L. McDonagh, X. Pan, A. J. Poulton, and M. J. Rijkenberg (2009), Large-scale distribution of Atlantic nitrogenfixation controlled by iron availability,Nat. Geosci.,2(12), 867–871.
Odling-Smee, F. J., K. N. Laland, and M. W. Feldman (1996), Niche construction,Am. Nat.,147(4), 641–648.
Odum, E. P., H. T. Odum, and J. Andrews (1971),Fundamentals of Ecology, p. 574, JSTOR, Saunders, Philadelphia, Pa.
Paerl, H. W. (1990), Physiological ecology and regulation of N2fixation in natural waters, inAdvances in Microbial Ecology, pp. 305–344, Springer, New York.
Palter, J. B., M. S. Lozier, J. L. Sarmiento, and R. G. Williams (2011), The supply of excess phosphate across the Gulf Stream and the mainte- nance of subtropical nitrogenfixation,Global Biogeochem. Cycles,25, GB4007, doi:10.1029/2010GB003955.
Partensky, F., W. R. Hess, and D. Vaulot (1999),Prochlorococcus, a marine photosynthetic prokaryote of global Significance,Microbiol. Mol. Biol.
Rev.,63(1), 106–127.
Picheral, M., L. Guidi, L. Stemmann, D. M. Karl, G. Iddaoud, and G. Gorsky (2010), The underwater vision profiler 5: An advanced instrument for high spatial resolution studies of particle size spectra and zooplankton,Limnol. Oceanogr. Methods,8(9), 462–473.
Prasad, A. K., S. Singh, S. Chauhan, M. K. Srivastava, R. P. Singh, and R. Singh (2007), Aerosol radiative forcing over the Indo-Gangetic Plains during major dust storms,Atmos. Environ.,41(29), 6289–6301.
Ratten, J.-M., J. LaRoche, D. K. Desai, R. U. Shelley, W. M. Landing, E. Boyle, G. A. Cutter, and R. J. Langlois (2015), Sources of iron and phosphate affect the distribution of diazotrophs in the North Atlantic,Deep Sea Res., Part II,116, 332–341.
Raven, J. A. (1988), The iron and molybdenum use efficiencies of plant growth with different energy, carbon and nitrogen sources,New Phytol.,109, 279–287.
Redfield, A. C. (1958), The biological control of chemical factors in the environment,Am. Sci.,46, 230A–2221.
Reynolds, S., C. Mahaffey, V. Roussenov, and R. G. Williams (2014), Evidence for production and lateral transport of dissolved organic phosphorus in the eastern subtropical North Atlantic,Global Biogeochem. Cycles,28, 805–824, doi:10.1002/2013GB004801.
Sañudo-Wilhelmy, S. A., A. B. Kustka, C. J. Gobler, D. A. Hutchins, M. Yang, K. Lwiza, J. Burns, D. G. Capone, J. A. Raven, and E. J. Carpenter (2001), Phosphorus limitation of nitrogenfixation byTrichodesmiumin the central Atlantic Ocean,Nature,411, 66–69.
Schlosser, C., J. K. Klar, B. D. Wake, J. T. Snow, D. J. Honey, E. M. S. Woodward, M. C. Lohan, E. P. Achterberg, and C. M. Moore (2014), Seasonal ITCZ migration dynamically controls the location of the (sub) tropical Atlantic biogeochemical divide,Proc. Natl. Acad. Sci.,111(4), 1438–1442.
Schlundt, M., P. Brandt, M. Dengler, R. Hummels, T. Fischer, K. Bumke, G. Krahmann, and J. Karstensen (2014), Mixed layer heat and salinity budgets during the onset of the 2011 Atlantic cold tongue,J. Geophys. Res. Oceans,119, 7882–7910, doi:10.1002/
2014JC010021.
Shiozaki, T., M. Ijichi, T. Kodama, S. Takeda, and K. Furuya (2014), Heterotrophic bacteria as major nitrogenfixers in the euphotic zone of the Indian Ocean,Global Biogeochem. Cycles,28, 1096–1110, doi:10.1002/2014GB004886.
Singh, A., and R. Ramesh (2015), Environmental controls on new and primary production in the northern Indian Ocean,Prog. Oceanogr.,131, 138–145.
Singh, A., M. Lomas, and N. Bates (2013), Revisiting N2fixation in the North Atlantic Ocean: Significance of deviations from the Redfield ratio, atmospheric deposition and climate variability,Deep Sea Res., Part II,93, 148–158.
Singh, A., S. Baer, U. Riebesell, A. Martiny, and M. Lomas (2015), C:N:P stoichiometry at the Bermuda Atlantic Time-Series Study station in the North Atlantic Ocean,Biogeosciences,12(21), 6389–6403.
Sohm, J. A., C. Mahaffey, and D. G. Capone (2008), Assessment of relative phosphorus limitation ofTrichodesmiumspp. in the North Pacific, North Atlantic, and the north coast of Australia,Limnol. Oceanogr.,53(6), 2495.
Staal, M., F. J. R. Meysman, and L. J. Stal (2003), Temperature excludes N2-fixing heterocystous cyanobacteria in the tropical oceans,Nature, 425, 504–507.
Staal, M., S. te Lintel Hekkert, G. Jan Brummer, M. Veldhuis, C. Sikkens, S. Persijn, and L. J. Stal (2007), Nitrogenfixation along a north-south transect in the eastern Atlantic Ocean,Limnol. Oceanogr.,52(4), 1305–1316.
Subramaniam, A., C. Mahaffey, W. Johns, and N. Mahowald (2013), Equatorial upwelling enhances nitrogenfixation in the Atlantic Ocean, Geophys. Res. Lett.,40, 1766–1771, doi:10.1002/grl.50250.
Van Mooy, B. A., G. Rocap, H. F. Fredricks, C. T. Evans, and A. H. Devol (2006), Sulfolipids dramatically decrease phosphorus demand by picocyanobacteria in oligotrophic marine environments,Proc. Natl. Acad. Sci.,103(23), 8607–8612.
Van Mooy, B. A., L. R. Hmelo, L. E. Sofen, S. R. Campagna, A. L. May, S. T. Dyhrman, A. Heithoff, E. A. Webb, L. Momper, and T. J. Mincer (2012), Quorum sensing control of phosphorus acquisition inTrichodesmiumconsortia,ISME J.,6(2), 422–429.
Vidal, M., C. M. Duarte, and S. Agusti (1999), Dissolved organic nitrogen and phosphorus pools andfluxes in the central Atlantic Ocean, Limnol. Oceanogr.,44, 106–115.
Wu, J., W. Sunda, E. A. Boyle, and D. M. Karl (2000), Phosphate depletion in the western North Atlantic Ocean,Science,289(5480), 759–762.
Yin, K., H. Liu, and P. J. Haridas (2017), Sequential nutrient uptake as a potential mechanism for phytoplankton to maintain high primary productivity and balanced nutrient stoichiometry,Biogeosciences,14, 2469–2480, doi:10.5194/bg-14-2469-2017.
Zehr, J. P., and H. W. Paerl (2008), Molecular ecological aspects of nitrogenfixation in the marine environment, inMicrob. Ecol. Oceans, 2nd ed., pp. 481–525, Wiley-Blackwell, N. J.