www.biogeosciences.net/12/7467/2015/
doi:10.5194/bg-12-7467-2015
© Author(s) 2015. CC Attribution 3.0 License.
Hidden biosphere in an oxygen-deficient Atlantic open-ocean eddy:
future implications of ocean deoxygenation on primary production in the eastern tropical North Atlantic
C. R. Löscher1,2, M. A. Fischer1,*, S. C. Neulinger1,*, B. Fiedler2, M. Philippi1, F. Schütte2, A. Singh2,a, H. Hauss2, J. Karstensen2, A. Körtzinger2,3, S. Künzel4, and R. A. Schmitz1
1Department of biology, Institute for General Microbiology, Kiel, Germany
2GEOMAR, Helmholtz Centre for Ocean Research Kiel, Kiel University, Kiel, Germany
3Christian-Albrechts-Universität zu Kiel, Kiel, Germany
4Max Planck Institute for Evolutionary Biology, Plön, Germany
anow at: Physical Research Laboratory, Geosciences Division, Ahmedabad, 380 009, India
*These authors contributed equally to this work.
Correspondence to: C. R. Löscher (cloescher@geomar.de)
Received: 13 July 2015 – Published in Biogeosciences Discuss.: 27 August 2015
Revised: 20 November 2015 – Accepted: 10 December 2015 – Published: 21 December 2015
Abstract. The eastern tropical North Atlantic (ETNA) is characterized by a highly productive coastal upwelling sys- tem and a moderate oxygen minimum zone with low- est open-ocean oxygen (O2) concentrations of approxi- mately 40 µmol kg−1. The recent discovery of re-occurring mesoscale eddies with close to anoxic O2 concentrations (< 1 µmol kg−1)located just below the mixed layer has chal- lenged our understanding of O2 distribution and biogeo- chemical processes in this area.
Here, we present the first microbial community study from a deoxygenated anticyclonic modewater eddy in the open wa- ters of the ETNA. In the eddy, we observed significantly lower bacterial diversity compared to surrounding waters, along with a significant community shift. We detected en- hanced primary productivity in the surface layer of the eddy indicated by elevated chlorophyll concentrations and carbon uptake rates of up to three times as high as in surrounding waters. Carbon uptake rates below the euphotic zone cor- related to the presence of a specific high-light ecotype of Prochlorococcus, which is usually underrepresented in the ETNA. Our data indicate that high primary production in the eddy fuels export production and supports enhanced respira- tion in a specific microbial community at shallow depths, be- low the mixed-layer base. The transcription of the key func- tional marker gene for dentrification, nirS, further indicated
a potential for nitrogen loss processes in O2-depleted core waters of the eddy. Dentrification is usually absent from the open ETNA waters.
In light of future projected ocean deoxygenation, our re- sults show that even distinct events of anoxia have the poten- tial to alter microbial community structure with critical im- pacts on primary productivity and biogeochemical processes of oceanic water bodies.
1 Introduction
The eastern tropical North Atlantic (ETNA) region is influ- enced by an eastern boundary upwelling system (EBUS) off northwest Africa, which along with nutrient supply via Saha- ran dust deposition, fuels one of the most productive ocean regions in the world. A moderate oxygen minimum zone (OMZ) is associated with this EBUS, with lowest oxygen (O2)concentrations just below 40 µmol kg−1 present at in- termediate depths (Chavez and Messié, 2009; Jickells et al., 2005; Karstensen et al., 2008).
O2 records over several years from the Cape Verde Ocean Observatory (CVOO) mooring (located at 17◦350N, 24◦150W, Fig. 1) confirmed the well-ventilated character of the ETNA. However, the observation of distinct events
of very low-O2 concentrations (< 1 µmol kg−1) at depths around 40 to 100 m over periods of more than 1 month chal- lenged our understanding of the biogeochemistry in that area (Karstensen et al., 2015a). The meridional current structure observed during these low-O2events revealed the passage of anticyclonic modewater eddies (ACME) crossing the CVOO mooring (Karstensen et al., 2015a). The ocean is filled with eddies (Chelton et al., 2011) but only a few of them have the dynamical and biogeochemical boundary conditions that support formation of a low-O2core. Anomalous low salinity within the ETNA low-O2 eddies suggested the water mass originated from the EBUS off Mauritania, which was con- firmed by analyzing sea-level anomaly data. In combination with other data from the upwelling region, Karstensen et al. (2015a) showed that O2 concentrations decreased over a period of a few months during westward propagation of the eddies into the open north Atlantic Ocean. Respiration in these eddies was estimated to be about three to five times higher than typical subtropical gyre values (Karstensen et al., 2008).
Mesoscale eddies are increasingly recognized as biogeo- chemical hot-spots of basin-wide relevance for the world’s oceans (Altabet et al., 2012; Baird et al., 2011; Chelton et al., 2011; McGillicuddy et al., 2007; Oschlies and Gar- con, 1998; Stramma et al., 2013). Upward nutrient supply to the euphotic zone through mesoscale eddy dynamics en- ables intense primary productivity (Lévy et al., 2001, 2012;
McGillicuddy et al., 2007). Classically, primary producers in the ETNA open waters area are dominated by a range of diatom clades, flagellates and cyanobacteria (Franz et al., 2012), but so far no specific information on the primary pro- ducers in productive ETNA eddies has been reported. As a result of enhanced primary production in the surface, in- creased organic matter export flux below the euphotic zone is expected, which in turn supports increased respiration at intermediate depths. Indeed, particle maxima a few meters above the O2 minimum have been reported based on au- tonomous observations of O2-depleted eddies in the ETNA (Karstensen et al., 2015a), indicating enhanced organic mat- ter export and providing environments of enhanced reminer- alization (Ganesh et al., 2014). Observations from a low- O2 eddy from the ETNA revealed a remarkable impact on all productivity-related processes in that particular system (Fischer et al., 2015). Estimated productivity was three-fold higher in the surface layer compared to surrounding waters along with a multiple times increase in mass flux in bathy- pelagic during the eddy passage. Furthermore, Fiedler et al. (2015) determined export flux derived from carbon rem- ineralization rates within the eddy and found a 3–4-fold en- hanced export flux compared to background conditions in the open-ocean ETNA.
O2-depleted conditions are supposed to act as a critical switch for the marine microbial community, both with regard to functionality and diversity. O2 begins to limit oxidative pathways and reductive pathways are induced (Stewart et al.,
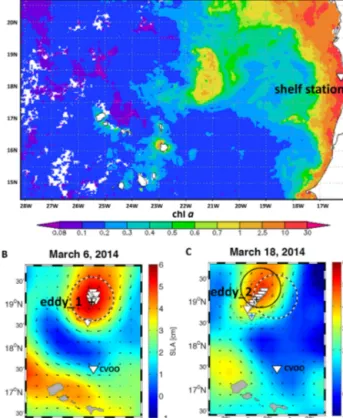
Figure 1. (a) MODIS-Aqua 4 km monthly mean chladistribution in the ETNA (mg m−3) in November 2013. Markedly increased chla concentrations are associated with the low-oxygen ACME, located between 21c and 22◦W and 17.5 and 19◦N. Analyses and visualizations were produced with the Giovanni online data system, developed and maintained by the NASA GES DISC. Eddy location indicated by sea level anomaly (SLA) during the time of the two surveys: (b) first eddy observation;+denotes the eddy_1 station, (c) second eddy observation+denotes the eddy_2 station, an ad- ditional station was sampled at the eddy rim for C uptake measure- ments, indicated by the blue+. White triangle marks the sampling station for the potential source water of the eddy. The dashed circles indicate the location of the eddy during the R/V Islandia survey, the black circle indicates the eddy location during the R/V Meteor survey, and the dashed black line indicates the direction of eddy propagation. Sampling stations are shown with white triangles.
2011; Ulloa et al., 2012; Wright et al., 2012). A loss in micro- bial diversity related to vertical O2gradients has previously been described for the Pacific Ocean (Beman and Carolan, 2013; Bryant et al., 2012), but to date no comparable data are available from the ETNA. O2-loss related microbial commu- nity shifts and modified functionality are supposed to favor heterotrophic communities dominated by Flavobacteria,α- andγ-Proteobacteria, which efficiently recycle organic mat- ter (Buchan et al., 2014). Furthermore, marine nitrogen (N) and carbon (C) cycling are significantly altered under low O2 conditions (Vaquer-Sunyer and Duarte, 2008; Wright et al., 2012). Substantial N loss (Altabet et al., 2012) along with enhanced nitrous oxide production (Arévalo-Martínez et al.,
2015) has been described in low-O2eddies in the OMZ off Peru in the eastern tropical South Pacific.
Classically, the N cycle in the open ETNA is assumed to be dominated by nitrification. An N loss signal is not present due to comparably high background O2 concentra- tions (≥40 µmol kg−1, (Löscher et al., 2012; Ryabenko et al., 2012)). However, any drop in O2concentration in the water column, as potentially induced by the low-O2eddies, could potentially activate anammox and/or denitrification. During recent decades, the ETNA OMZ has been expanding both in terms of vertical extent and intensity and is predicted to expand further in the future (Stramma et al., 2008) with un- known consequences for the ecology and biogeochemistry of that system. Thus, it is critical to understand the biogeochem- ical response to changing O2concentrations in that region.
In this study, we investigated differences in microbial com- munity structure in an O2depleted eddy, surrounding ETNA open waters, and upwelled waters on the Mauritanian shelf.
This was achieved using a combined high-throughput 16S rDNA amplicon sequencing/qPCR approach along with car- bon uptake rate measurements and hydrochemical observa- tions. This study aimed to understand the microbial com- munity response to O2 depleted conditions with regard to primary production and remineralization in these poorly- described anomalies, to improve understanding of the sen- sitivity of the ETNA biogeochemistry to future ocean deoxy- genation.
2 Material and methods 2.1 Data collection
Remotely sensed sea level anomalies (SLA), in combination with temperature and salinity data measured by Argo floats (an overview is presented by Schütte et al., 2015) were used for general eddy identification and tracking in this area. Af- ter identification of a low-O2eddy candidate that was prop- agating towards CVOO, a pre-survey was started using au- tonomous gliders (see Karstensen et al., 2015b). Once the glider data had confirmed the low O2 concentration in the candidate eddy, a ship-based survey was started. First, we performed a survey with the Cape Verdean R/V Islandia on 6 March 2014 (samples from this survey are further referred to as eddy_1), followed by a second survey with the German R/V Meteor (cruise M105; 19 March 2014; samples from this survey are further referred to as eddy_2). Moreover, the back- ground signal (i.e. waters outside the eddy) was measured, in order to compare the eddy with the typical open-ocean ETNA environment. For this purpose, we used metagenomic sam- ples from the CVOO time series monitoring site (collected on 19 March 2014 during cruise M105). Samples from the Mauritanian shelf collected during R/V Meteor Cruise M107 (station 675, 18.22◦N/16.56◦W, collected on 24 June 2014) represent data from the eddy formation area. Station 675 was
chosen according to its location within the area that Schütte et al. (2015) identified as the region of eddy formation and further because of the observed low O2 concentrations of 33.9 µmol kg−1at 115 m depth (which corresponds to a po- tential density ofσT =26.4 kg m−3, thus similar to the core density of minimal O2concentrations in the eddy).
In addition to metagenomic sampling, carbon uptake mea- surements were performed during the R/V Meteor M105 sur- vey at two stations: no. 186 (profile 10, 19.3◦N, 24.77◦W) and no. 190 (profile 15, 18.67◦N, 24.87◦W, see Fig. 1c, blue crosses).
2.2 Water sampling and hydrographic parameters Discrete samples for salinity, dissolved O2and nutrients on all surveys were taken from a CTD rosette equipped with Niskin-bottles. The CTD data were calibrated against salin- ity samples and CTD oxygen probe data (SBE 43 Clark elec- trode sensor) were calibrated against O2concentrations, de- termined following the Winkler method using 50 or 100 mL samples. Salinity and nutrient concentrations were deter- mined as described in Grasshoff et al. (1999). The CTD on R/V Meteor was equipped with double sensors for conductiv- ity, temperature, and oxygen. Calibration followed standard procedures (GO-SHIP Manual; Hood et al., 2010).
2.3 Oxygen respiration
In order to estimate the net O2consumption as a potential driver for microbiological community shifts a simple calcu- lation was performed as follows:
1O2=O2(S)−O2(E), (1)
where O2(S) denotes the lowest O2 concentration detected on the shelf (36.69±6.91 µmol kg−1 at σT =26.3±0.15 kg m−3, cruise M107, average of shelf sta- tions between 18.10◦N/16.59◦W and 18.25◦N/16.45◦W).
This region was chosen as it was identified (Schütte et al., 2015) to be the area where the eddy most likely originated.
O2(E) denotes the lowest O2concentration measured in the eddy core at the same potential density (4.8 µmol kg−1 at σT =26.35 kg m−3during M105).
The daily O2loss rate (1O2d)was calculated as follows, assuming a lifetime of 180 days of the eddy (Schütte et al., 2015):
1O2d=1O2/180. (2)
2.4 Chlorophyllameasurements
Sea water samples (0.5–1 L) for chlorophylla(Chla) analy- ses were filtered (200 mbar) on GF/F filters (25 mm, 0.7 µm;
Whatman, Maidstone, UK). Filters were transferred to a plas- tic vial and 1 mL of MilliQ water was added. Filters were im- mediately frozen at−20◦C and stored for at least 24 h. Af- terwards, 9 mL acetone (100 %) was added to the vials and
the fluorescence was measured with a Turner Trilogy fluo- rometer (Sunnyvale, CA, USA). Calibration took place using a Chla standard dilution series (Anacystis nidulans, Walter CMP, Kiel, Germany). Chlaconcentrations were determined as described by Parsons et al. (1984).
2.5 Molecular methods
Seawater samples were taken from the Niskin-Bottles at se- lected CTD casts. For nucleic acid purification 2 L seawa- ter was rapidly filtered (exact filtration volumes and times were recorded continuously) through 0.2 µm polyethersul- fone membrane filters (Millipore, Billerica, MA, USA). The filters were immediately frozen and stored at −80◦C until further analysis. Nucleic acids were purified using the Qia- gen DNA/RNA AllPrep Kit (Qiagen, Hilden, Germany) with modifications as previously described (Löscher et al., 2012).
Extracts of DNA and RNA were quantified using a spec- trophotometer (Thermo Fisher Scientific, Waltham, MA, USA). To remove DNA from RNA extracts, a DNase I treat- ment (Invitrogen, Carlsbad, CA) was performed; purity of RNA was checked by PCR amplification before random reverse transcription with the Quanti Tect® Reverse Tran- scription Kit (Qiagen, Hilden, Germany). HNLC, HLII and other Prochlorococcus ecotypes were qPCR-amplified us- ing primers and PCR conditions as previously described (Ahlgren et al., 2006). Reactions were performed in tech- nical duplicates in a final volume of 12.5 µL using 0.25 µL of each primer (10 pmol µL−1), 3.25 µL nuclease-free wa- ter and 6.25 µL SYBR qPCR Supermix W/ROX (Life Tech- nologies, Carlsbad, CA, USA) on a ViiA7 qPCR machine (Life Technologies, Carlsbad, CA, USA) according to estab- lished protocols (Ahlgren et al., 2006; West et al., 2011).
TaqMan-based qPCRs were performed for picophytoplank- ton (Prochlorococcus/Synechococcus) and bacteria as pre- viously described (Suzuki et al., 2001) in a final volume of 12.5 µL with primer/probe concentrations as shown else- where (Table 1, West et al., 2011), but with the addition of 0.5 µL BSA (20 mg mL−1)and 6.25 µL TaqMan Mix (Life Technologies, Carlsbad, CA, USA). Dilution series of plas- mids containing the target gene were used as standards as described (Lam et al., 2007; Löscher et al., 2012). Nitrogen cycle key functional genes amoA, nirS, hzo and nifH were amplified and quantified from DNA and cDNA following es- tablished protocols (Lam et al., 2007; Langlois et al., 2008;
Löscher et al., 2012, 2014). Detection limits of qPCR assays were determined from no-template controls, which were run in duplicate for each primer (and probe) set, and were un- detectable after 45 cycles, thus setting the theoretical detec- tion limit of our assay mixtures to one gene copy. However, detection limits additionally depend on the amount of fil- tered seawater per sample, elution volume after extraction, and the amount of sample loaded to the qPCR assay. Based on a filtration volume of 2 L seawater, a detection limit of 20 copies L−1has been determined. qPCR efficiencies were
calculated using the formulaE=10−1/slope−1, and were be- tween 95.3 and 96.8 %.
2.5.1 PCR amplification of bacterial and archaeal 16S rDNA for Illumina MiSeq amplicon sequencing
For the analysis of the bacterial community, hypervariable regions V1 and V2 of the 16S rDNA was amplified from genomic DNA using the primer set 27 forward (Frank et al., 2007) and 338 reverse (Fierer et al., 2008). Beside the target-specific region the primer sequence contained a linker sequence, an 8-base barcode and the Illumina-specific re- gion P5 (forward primer) or P7 (reverse primer), respectively, as recently described (Kozich et al. 2013). The PCR reac- tion mixture consisted of 13.6 µL DEPC H2O (Roth, Karl- sruhe, Germany), 0.4 µL of 10 mM dNTPs (Thermo Fisher Scientific), 4 µL 5× HF-buffer (Thermo Fisher Scientific, Waltham, MA, USA), 0.8 µL primers (5 µM, Eurofins, Ebers- berg, Germany), 0.2 µL Phusion high-fidelity polymerase (2 U µL−1, Thermo Fisher Scientific, Waltham, MA, USA) and 1 µL genomic DNA with a concentration between 10 and 100 ng µL−1. Negative controls consisted of the reaction mixture as described above without the addition of DNA.
PCR reaction conditions started with an initial denaturation step for 5 min at 95◦C followed by 30 cycles of 15 s denatu- ration at 95◦C, 30 s primer annealing at 52◦C and 30 s elon- gation at 72◦C and a final elongation at 72◦C for 5 min.
For analysis of the archaeal community, hypervariable re- gions V5-V7 of the 16S rDNA were amplified from ge- nomic DNA using the primer set 787 forward and 1059 re- verse (Yu et al., 2005) with 8-base barcode and Illumina spe- cific adapters. Reaction mixture, PCR protocol and purifi- cation were identical to the amplification of bacterial com- munity DNA amplification, the only difference was the an- nealing temperature (58◦C). Amplification was checked for correct size and band intensity on a 2.5 % agarose gel. Am- plicons were purified using the MinElute Gel Extraction Kit (Qiagen, Hildesheim, Germany) and quantified on a spec- trophotometer (Nanodrop 1000, Thermo Fisher Scientific, Waltham, MA, USA). Pooled purified amplicons were pre- pared and sequenced according to the manufacturer’s proto- col on a MiSeq Instrument using the MiSeq reagent Kit V3 chemistry (Illumina, San Diego, CA, USA). Sequences were submitted to NCBI Sequence Read Archive under accession number PRJNA288724.
2.5.2 Sequence analysis of 16S rDNA gene amplification
Sequence processing was performed using mothur software version 1.32.1 (Kozich et al., 2013; Schloss et al., 2009).
4 054 723 bacterial sequence read pairs could be concate- nated to contiguous sequences (contigs) using the com- mand make.contig. Contigs containing ambiguous bases, ho-
mopolymers longer than eight bases or contigs longer than 552 bases were deleted from the data set. Redundant se- quences were clustered using the command unique.seqs, which led to 645 444 unique sequences. Sequences were con- secutively aligned with align.seqs against a modified version of the SILVA database release 102 (Pruesse et al., 2007) con- taining only the hypervariable regions V1 and V2. The align- ment was optimized by removing sequences not aligning in the correct region with screen.seqs, and by the removal of gap-only columns using filter.seqs. The optimized alignment contained 636 701 sequences of lengths between 255 and 412 bases. Rare sequences with up to three positional differences compared to larger sequence clusters were merged with the latter by the pre.cluster command. Chimeric sequences were removed with the implemented software UCHIME (Edgar et al., 2011) using the command chimera.uchime, followed by remove.seqs.
Taxonomic classification of the remaining sequences was done using the Wang approach based on a modified version of the Greengenes database (DeSantis et al., 2006) with a bootstrap threshold of 80 %. Sequences of archaea, chloro- plasts and mitochondria were removed with remove.lineage.
Operational taxonomic units (OTUs) were formed by aver- age neighbor clustering using the cluster.split command, par- allelizing the cluster procedure by splitting the data set at the taxonomic order level. A sample-by-OTU table was gener- ated with make.shared at the 97 % sequence similarity level.
The resulting table contained 15 509 OTUs. OTUs were clas- sified taxonomically using the modified Greengenes database mentioned above and the command classify.otu.
Archaeal sequences showed lower quality in the reverse read, which lead to multiple ambiguous bases in the con- tigs formed. For this reason only the forward read starting from base 36 was used for analysis. Sequence analysis was performed as described above for bacterial 16S sequences, except that the alignment (align.seqs) was accomplished us- ing the SILVA archaeal reference release 102 (Pruesse et al., 2007) fitted for hypervariable regions V5-V7. Classification (classify.seqs and classify.otu) was conducted using the RDP database file release 10 (Cole et al., 2014; Wang et al., 2007).
Results and additional information on the archaeal commu- nity structure are listed in the Supplement.
An overview of the sequencing output is given in Table S1 in the Supplement.
2.6 Statistics
Low-abundance OTUs were removed to reduce noise and computation time. Statistical downstream analysis was per- formed in R v3.1.3 (R Core Team, 2015) with custom scripts (available from the authors on request). As OTUs of very low abundance only increase computation time without con- tributing useful information, they were removed from the data set as follows: after transformation of counts in the sample-by-OTU table to relative abundances (based on the
total number of reads per sample), OTUs were ordered by de- creasing mean percentage across samples. The set of ordered OTUs for which the cumulative mean percentage amounted to 99 % was retained in the filtered OTU table.
Distribution of OTUs across samples was modeled by a set of environmental variables (Table S2) with minimal interde- pendence. The variance in OTU composition (i.e., the extent of change in OTU abundance across samples) explained by the measured environmental variables was explored by re- dundancy analysis (RDA) with Hellinger-transformed OTU counts (Langfeldt et al., 2014; Stratil et al., 2013, 2014) using the R package vegan (Oksanen et al., 2013). In order to mini- mize collinearity of explanatory variables in the RDA model, a subset of the recorded environmental variables was chosen according to their variance inflation factor (VIF), employ- ing vegan’s functions rda and vif.cca. Starting with an RDA model that contained all explanatory variables, the variable with the highest VIF was iteratively determined and removed from the model until all remaining explanatory variables had a VIF < 2.5.
OTU distribution was subject to “Realm” depending on O2 concentration. Model selection started with a full RDA model containing all main effects and possible interactions based on the set of explanatory variables with minimal collinearity. This model was simplified by backward selec- tion with function ordistep. The final RDA model exhib- ited a significant interaction effect “Realm:O2” (see results section). For plotting and indicator analysis (see below), the continuous variable “O2” was converted into a factor with two levels “high O2” (> 90 µmol L−1) and “low O2” (≤90 µmol L−1); the threshold of 90 µmol L−1 was chosen for two reasons: (1) to obtain sample groups of fairly equal size between stations, which include low O2 parts of the water column at all sampling stations in order to enable a comparison between the ETNA OMZ (outside the eddy) and the eddy OMZ. (2) 90 µmol L−1has previously described the highest concentration of O2at which denitrification has been detected to be active (Gao et al., 2010). The presence of nirS transcripts (see Sect. 3.4) indicated a potential importance for denitrifiers in the eddy, therefore the theoretical upper limit of 90 µmol L−1was chosen.
We determined OTUs typical for a given combination of levels of factors “Realm” and “O2”. OTUs significantly cor- related with any axis in the final RDA model were deter- mined using the function envfit with 105 permutations, fol- lowed by Benjamini-Hochberg correction (false discovery rate, FDR) (Benjamini and Hochberg, 1995). In order to re- duce the number of tests in this procedure, OTUs were pre- filtered according to their vector lengths calculated from cor- responding RDA scores (scaling 1) by profile likelihood se- lection (Zhu and Ghodsi, 2006).
OTUs significant at an FDR of 5 % were further subject to indicator analysis with function multipatt of the R package indicspecies v1.7.4 (De Cáceres and Legendre, 2009) with 105permutations. Indicator OTUs – in analogy to indicator
species sensu De Cáceres and Legendre (2009) – are OTUs that prevail in a certain sample group (here: a level of factor
“Realm” within a chosen O2level) while being found only irregularly and at low abundance in other sample groups.
In order to remove the effects of the covariate “Depth” in indicator analysis, Hellinger-transformed counts of signifi- cant OTUs were first subjected to a linear regression with
“Depth”; residuals of this regression were then transformed to positive values by subtraction of their minimum and used as input for indicator analysis.
3-D visualizations of the RDA model were produced in kinemage format (Richardson and Richardson, 1992) using the R package R2Kinemage developed by S.C.N., and dis- played in KiNG v2.21 (Chen et al., 2009).
Diversity within samples was related to environmental variables by advanced linear regression. For alpha diversity analysis, effective OTU richness (Shannon numbers equiva- lent, 1D, Jost, 2006, 2007) was calculated from the filtered OTU table. 1D was fitted to the set of explanatory vari- ables with minimal collinearity in a generalized least squares (GLS) model using function gls of the R package nlme v3.1- 120 (Pinheiro et al., 2015). The variable “NO2” was square root-transformed to decrease the potential leverage effect of its two highest values (0.25 and 0.28 µmol L−1, respec- tively) on 1D. Apart from main effect terms, the interac- tion term “Realm:O2” was included into the GLS model for comparability with beta diversity analysis (see results sec- tion). The variance structure of the GLS model was chosen to account for both different variances per level of “Realm”
and an overall decreasing variance by “Depth”. The result- ing model was validated following the recommendations of Zuur et al. (2009). While only the “Realm” effect was sig- nificant, the other terms were kept in the model to maintain a valid residual distribution. For visualization of the (partial) effect of only factor “Realm” on1D, partial response resid- uals were extracted from the full GLS model re-fitted with- out the “Realm” main effect. These partial response residuals were then modelled by the “Realm” main effect alone, using the same variance structure as for the full GLS model.
2.7 Carbon fixation rate measurements
Seawater incubations were performed in triplicate at two sta- tions, one inside the eddy (station 10, M105 cruise) and one in ETNA open waters (station 15, M105 cruise, both stations indicated in Fig. 1c). Seawater was sampled from a CTD system and directly filled into 2.8 L polycarbonate bottles (Nalgene, Thermo Fisher Scientific, Waltham, MA, USA). For carbon fixation measurements, NaH13CO3(Cam- bridge Isotope Laboratories, MA, USA) was dissolved in sterile deionized water (> 18.2 Mcm−1, MilliQ, Merck- Millipore, Darmstadt, Germany; 5 g/294 mL). A volume of 1 mL (2.8 L bottles) was added to the incubations with a syringe (∼4.4 at % final). After amendment, bottles were stored on deck in a seawater-cooled Plexiglas incubator
covered with light foils (blue-lagoon, Lee filters, Andover, Hampshire, UK) that mimic light intensities at corresponding sampling depths (5/10/30/70 m). Samples from below the eu- photic zone were stored at 12◦C in the dark. The depth of the euphotic zone was estimated from photosynthetically active radiation (PAR) sensor measurements from CTD profiles as the depth where PAR is < 1 % of the surface value. This cor- responded to 60 m water depth during this survey. After 24 h of incubation, 1.5–2.8 L of seawater was filtered onto pre- combusted (450◦C, 5 h) 25 mm diameter GF/F filters (What- man, Maidstone, UK) under gentle vacuum (−200 mbar).
Filtrations were stopped after 1 h since high particle load of surface water led to a clogging of the filters. Filters were oven dried (50◦C) for 24 h and stored over desiccant until analysis. Environmental samples of 2.8 L untreated seawater were filtered and prepared in the same way to serve as blank values. For isotope analysis, GF/F filters were acidified over fuming HCl overnight in a desiccator. Filters were then oven- dried for 2 h at 50◦C and pelletized in tin cups. Samples were analyzed for particulate organic carbon and nitrogen (POC and PON) and isotopic composition using a CHN analyzer coupled to an isotope ratio mass spectrometer.
3 Results and discussion
3.1 Hydrography of low-O2eddy reveals similarities to shelf waters
As the detailed properties of the investigated eddy are de- scribed in Schütte et al. (2015) only the main characteristics are mentioned here.
The surveyed low-O2 eddy belongs to the group of the anticyclonic modewater eddies (ACME) (Karstensen et al.
2015a). It has been reported that ACME promote intense pri- mary production in surface and mixed layer waters (Mahade- van, 2014) fueled by nutrient supply to the euphotic zone.
The surveyed eddy had a diameter of about 100 km and was characterized by highly elevated mixed-layer chlorophyll a (chla) concentrations, a positive SLA signature (Fig. 1) and a low O2/low-salinity core (Fig. 2). The O2-depleted core, with concentrations of less than 5 µmol kg−1, was centered rather deep for an ACME at∼100 m depth. Concentrations of less than 30 µmol kg−1were observed in the eddy water column between 70 to 150 m depth (Figs. 2, 3a), which is significantly below average O2concentrations in that region.
O2concentrations in the core decreased over the survey pe- riod (March 2014), (see Fiedler et al. (2015), for a detailed description of O2properties). During the metagenomic sam- pling of the background signal (“no eddy”) on the shelf (Me- teor M107 cruise station 675, 18.22◦N/16.56◦W, Fig. 1), O2 concentrations of 33.9 µmol kg−1 were observed at 115 m depth, which corresponds to the potential density layer of the low O2core in the eddy. The open-ocean background mini- mum O2concentrations of about 70 µmol kg−1were detected
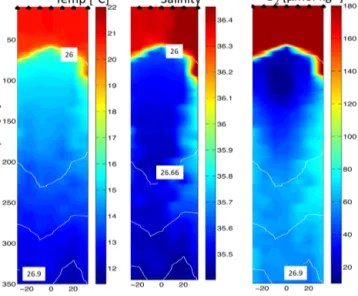
Figure 2. Temperature (left panel), salinity (middle panel) and O2 concentration (right panel) measured during a section of R/V Meteor Cruise M105 across the studied eddy. Minimum O2 was 4.8 µmol kg−1 at∼100 m water depth on that section; however, even lower O2was detected with a glider (1.2 µmol kg−1). Isopy- cnals are indicated by white lines.
at∼250 m depth at CVOO (Fig. 1). This can be considered average O2 concentrations for the open ETNA (Karstensen et al., 2008).
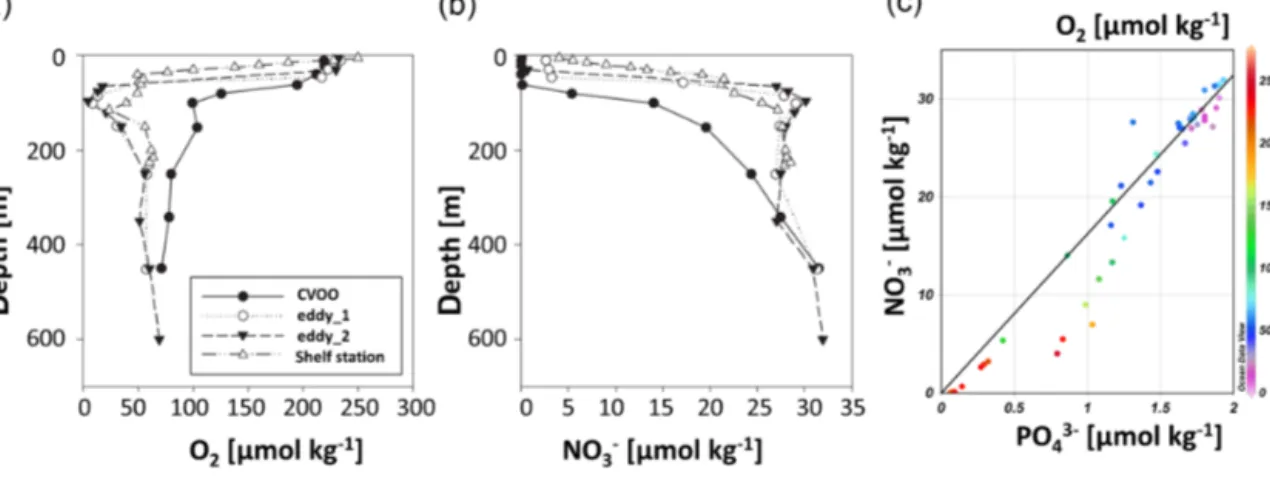
In the low-O2 eddy core, we observed nitrate and phos- phate concentrations around twice as high as background concentrations at CVOO at the same depth (Fig. 3). How- ever, N : P ratios below the mixed layer were close to Red- field stoichiometry (16.15±0.63, Fig. 3) and thus compara- ble to surrounding waters. Nitrate concentrations in the O2- min core (∼100 m depth) were similar to concentrations on the Mauritanian shelf at 100 m depth (Fig. 3) and most likely generated by very efficient local remineralization of nitrate from the sinking material (Karstensen et al. 2015b).
3.2 Loss of phylogenetic diversity in low-O2eddy waters
A critical issue regarding climate change induced pressures on ocean ecosystems is to understand the effects of ocean acidification and deoxygenation on microbial communities as major drivers of the ocean’s biogeochemistry (Riebesell and Gattuso, 2015). Thus, we investigated phylogenetic di- versity of the microbial community with a 16S rDNA ampli- con sequencing approach of bacteria and archaea inside and outside the eddy.
Although the bacterial community was dominated by Pro- teobacteria in all samples, there were distinct differences be- tween the community structures inside compared to outside the eddy (Fig. 4). Increased abundances of the uncultivated
SUP05 clade (up to 20 % of proteobacterial sequences) have been recovered from eddy samples compared to surrounding waters (Supplement Fig. S1, Table S3). This clade is known to occur frequently in O2depleted environments (Swan et al., 2011). Phyla such as Bacteroidetes, Actinobacteria and Fir- micutes were only present in the eddy and increased in rel- ative abundance over time. Those phyla were also detected in potential source waters on the shelf (Supplement Fig. S2).
Interestingly, the family of Pelagibacteraceae, which belong to the ubiquitous SAR11 clade (Giovannoni et al., 1990), were strongly decreased in the eddy (to∼1 % of all reads), compared to CVOO samples (∼65 % of all reads). SAR11 was previously described as being sensitive to decreasing O2
concentrations (Forth et al., 2014), which may explain the absence of this classically highly abundant group from the eddy. In addition to the dissimilarity in bacterial diversity, we also detected a substantial difference in archaeal commu- nity composition between eddy stations and CVOO (Fig. S3).
This was most obvious in samples from the eddy_2 station, where Methanomicrobia dominated the archaeal community in the O2-depleted parts of the water column but was absent in CVOO samples. The presence of methanogens in the low- O2 eddy core samples may indicate potential for methano- genesis. Although the eddy has not been shown to become fully anoxic, methanogenesis tolerates O2concentrations at low ranges (Angel et al., 2011).
Redundancy analysis (RDA) confirmed that the distribu- tion of bacterial OTUs strongly differed between the two eddy stations and CVOO samples (Fig. 6a; RDA model:
F6,24=4.48, p< 0.001). Changes in OTU composition mirrored the depth gradient (RDA “Depth”: F1,24=2.08, p≈0.03; Fig. 5) and were thus strongly correlated to chem- ical (PO3−4 , NO−3, SiO2) and physical (T, S) properties (Fig. S4). The RDA model indicates a noticeable inter- action effect of habitat (“Realm”) and O2 concentration (RDA “Realm:O2”: F2,24=2.03, p≈0.02), meaning that the “Realm” effect on bacterial community structure depends on the O2level and vice versa. An overview of the parame- ters included in the RDA model is given in Table S2. O2and nutrient availability can thus be considered the major deter- mining variables for the composition of the microbial com- munity.
Our results further show a significant decrease in bacte- rial alpha diversity in the eddy relative to CVOO (Fig. 6).
The community in eddy_2 samples was also markedly less diverse compared to those of the other realms (Fig. 6; gener- alized least squares (GLS) model:F7,23=5.37,p=0.001;
GLS “Realm”:F2,23=16.26, p< 0.0001). This may be at- tributed to an aging effect of the eddy, and corresponds to progressive O2 loss and consecutive changes in the eddy biogeochemistry. We calculated an overall O2 loss of 0.18 µmol kg−1d−1 at 100 m depth by respiration, when comparing the eddy core water to the potential origin wa- ters on the shelf, assuming a lifetime of 180 days for the eddy (average O2 concentrations on the shelf from Meteor
Figure 3. (a) O2and (b) nitrate and (c) nitrite concentrations measured at the open-ocean station CVOO (black circles), in the first observation (eddy_1, open circles), second observation (eddy_2, black triangles) and on the Mauritanian shelf (open triangles). (d) Nitrate vs. phosphate concentration at the four sampling stations. The color code denotes the O2concentration and the black line indicates the Redfield ratio of N : P=16 : 1.
Figure 4. Distribution of bacterial phyla along vertical profiles of (a) CVOO, (b) first observation (eddy_1) and (c) second observation (eddy_2) is shown along with the O2gradient (black line). Data sets result from 16S rDNA amplicon sequencing (an overview on archaeal sequence distribution is given in the Supplement).
M107 were 36.69±6.91 µmol kg−1 compared to observed minimum O2 concentrations of 4.8 µmol kg−1 in the eddy core). These results are comparable to previous estimates on low O2-eddies in that region (Karstensen et al., 2015a). Like- wise, Fiedler et al. (2015) also observed a significant increase inpCO2and dissolved inorganic carbon compared to coastal waters, indicating enhanced remineralization and respiration.
Although our data set does not allow differentiation between high-pCO2and low-O2effects on the microbial community, it supports the view of a general loss in diversity. This may be attributed to a direct or indirect response to factors related to deoxygenation and increasing pCO2, such as the impact
on nutrient stoichiometry, as previously suggested (Bryant et al., 2012).
Hence, climate change-related ocean deoxygenation and consequent shifts in nutrient stoichiometry may mean an overall loss of microbial diversity, with potential for substan- tial loss in the spectrum of metabolic functions in the future ocean.
3.3 Specific Prochlorococcus clade contributes to primary production in the eddy
The detected ACME was characterized by shoaling of the mixed layer depth in the center of the eddy. This coin-
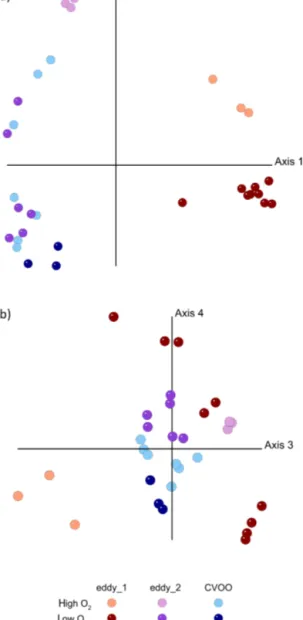
Figure 5. Redundancy analysis (RDA) of OTU distribution in sam- ples from the first eddy observation (eddy_1), from the second eddy observation (eddy_2) and from CVOO based on 16S rDNA se- quences. (a) First and second axis, (b) third and fourth axis of the RDA model, illustrating the interaction effect of factor “Realm” and O2concentration. For plotting, the continuous variable “O2” was converted into a factor with two levels “high O2” (> 90 µM) and
“low O2” (≤90 µM).
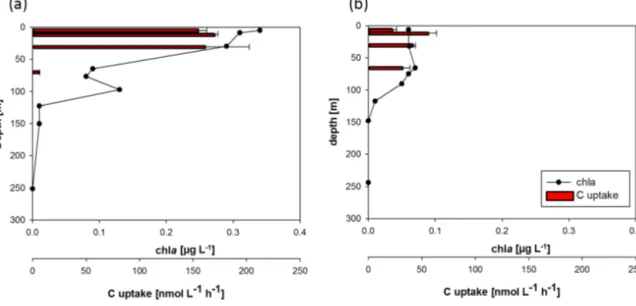
cided with a pronounced surface chl a maximum as ob- served by ocean color based and remotely sensed chl a estimates (Figs. 1a, 7), which was slightly deeper (∼50–
70 m water depth) outside the eddy. In accordance with in- creased chl a concentrations, enhanced carbon uptake was observed via direct rate measurements of H13CO−3 uptake which was potentially fueled by increased nutrient availabil- ity from intermediate depths. We found a 3-fold increase in depth-integrated carbon uptake rate in the chlamaximum of
Figure 6. Alpha diversity analysis of eddy sampling stations (first observation (eddy_1), second observation (eddy_2)) and CVOO ex- pressed as Shannon numbers equivalent (1D). A strong and signif- icant decrease in diversity is observed in the eddy. Partial response residuals (black symbols) were extracted from full GLS model re- fitted without the “Realm” main effect. Predicted values for partial residuals modelled by the “Realm” main effect alone (and thus ad- justed for differences in O2concentration) are shown as blue sym- bols. Error bars represent 95 % confidence interval for fitted values.
the eddy (178.3±30.8 m mol C m−2d−1)compared to sur- rounding waters (59.4±1.2 mmol C m−2d−1).
While the upper chla maximum in the eddy may likely be ascribed to eukaryotic primary producers such as diatoms and flagellates that are widely distributed and abundant in that region (Franz et al., 2012), confirmed by increased abun- dances of plastids in surface samples of our amplicon data set (Table S3). A secondary chla maximum dominated by cyanobacteria was detected in the eddy at about 100 m water depth, coinciding with the O2minimum.
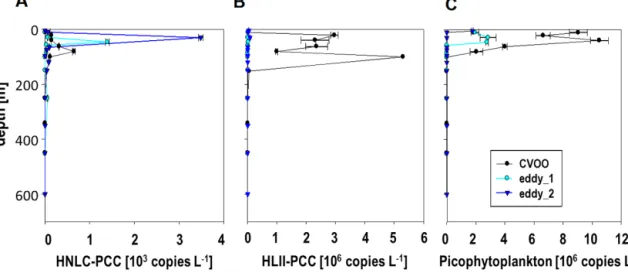
The quantitative analysis of cyanobacterial primary pro- ducers by 16S rDNA-qPCR further revealed dominance of a specific clade of Prochlorococcus in the secondary chla maximum (Fig. S5 depicts phylogenetic relations of detected Prochlorococcus clades). This ecotype has so far not been identified in the ETNA and is only known from high nu- trient low-chlorophyll (HNLC) regions of the eastern trop- ical Pacific Ocean (West et al., 2011). Its described adap- tation to high nutrient conditions such as those present in this O2-depleted ACME points towards a selective advantage for this clade. Gene abundance of this ecotype – for conve- nience further referred to as HNLC-PCC (results of an eco- typespecific16S rDNA based qPCR) – showed a strong cor- relation with chlorophyll (R2=0.95,n=22) below the eu- photic zone within the eddy. This correlation was not present outside the eddy, where HNLC-PCC abundance was approx- imately one third compared to the second eddy observa- tion (Fig. 8). The Prochlorococcus community in surround- ing waters was, however, dominated by another high-light ecotype of Prochlorococcus (further referred to as HL-PCC
Figure 7. Chlorophylla(chla, µg L−1)distribution as determined from discrete measurements and carbon uptake rates (a) inside the eddy (eddy_2, second observation) and (b) at the eddy rim (location denoted in Fig. 1). Error bars indicate the standard deviation of three replicate samples for C uptake.
(West et al., 2011)). Contrary to HNLC-PCC, HL-PCC was not detected inside the eddy. The difference between the CVOO, eddy_1 and eddy_2 observations points towards a community shift of Prochlorococcus related clades depend- ing on specific characteristics of the eddy (O2, nutrient avail- ability) with the potential to alter primary productivity in that region. Under increasing pCO2 levels, Prochlorococcus is predicted to substantially increase in abundance (Flombaum et al., 2013). Elevated pCO2 levels in the eddy core wa- ter may therefore – apart from favorable elevated nutrient concentrations – explain the additional selective advantage of specific Prochlorococcus clades, in this case of HNLC- PCC. This may be critical as Prochlorococcus is one of the most abundant photosynthetic organisms in the ocean and contributes to ∼40 % of dissolved organic carbon support- ing bacterial production (Bertillson et al., 2005).
Besides a direct impact of O2, nutrients and pCO2, in- creased abundances of Prochlorococcus in the eddy may be explained from an interaction effect in the microbial commu- nity present in the eddy. Prochlorococcus is supposed to play a major role in sustaining heterotrophs with organic carbon compounds such as glycine and serine, thus favoring their growth (Biller et al., 2015; Carini et al., 2013). Conversely, Prochlorococcus benefits from the presence of heterotrophs as they diminish the concentration of reactive oxygen species in their immediate surroundings, which is not feasible for Prochlorococcus due to the lack of catalase and peroxidase genes (Berube et al., 2014; Morris et al., 2008). The close proximity of increased abundances of the HNLC-PCC max- imum to the O2 minimum in the eddy may thus point to- wards a beneficial relationship between the HNLC-PCC and
the heterotroph-dominated, eddy core water microbial com- munity.
3.4 Increased primary productivity promotes a specific heterotrophic microbial community in underlying waters
We analyzed species indicative for the eddy and CVOO for either high-O2 conditions (> 90 µmol kg−1)or low-O2 con- ditions (≤90 µmol kg−1). Indicator OTUs for high O2in the eddy were mostly associated with different clades of Pro- teobacteria, whereas Pelagibacteraceae dominated at CVOO in accordance with several studies describing those organ- isms as ubiquitous in open-ocean oxic waters (Morris et al., 2002; Rappé et al., 2002; Poretsky et al., 2009; DeLong, 2009; Brown et al., 2014). High-O2samples of all three sam- pling stations were dominated – as most parts of the ocean – by indicator OTUs belonging to the Proteobacteria. The Prochlorococcus clade HNLC-PCC targeted by qPCR could be recovered in the 16S rDNA amplicon sequences, as well.
For low-O2 conditions, indicator species present in the eddy were mostly affiliated to the Cytophaga-Flavobacteria- Bacteroides (CFB) group (Glöckner et al., 1999) (Ta- ble S4). Members of Bacteroidetes and Proteobacteria (Gramella, Leeuwenhoekiella marinoflava, unclassified Co- mamonadaceae species) were found to be indicative for the low-O2realm. Gramella-like organisms are usually a quan- titatively important fraction of the heterotrophic marine bac- terioplankton, often attached to marine snow but also found free-living in nutrient-rich microenvironments (Buchan et al., 2014). Frequently associated with extensive phytoplankton blooms (Buchan et al., 2014), their ability to degrade high
Figure 8. Vertical distribution of Prochlorococcus and Synechococcus ecotypes quantified by qPCR. While the HNLC-PCC (a) dominates the eddy water mass and increases from the first observation (eddy_1) to the second observation (eddy_2) it is nearly absent outside the eddy (CVOO). HLII-PCC (b) occurs in highest abundances outside the eddy, while being close to the detection limit inside the eddy. (c) shows the distribution of pico-phytoplankton as detected with a general primer-probe system (Suzuki et al., 2001).
molecular weight compounds in both the dissolved and par- ticulate fraction of the marine organic matter pool points to- wards a specific role in respiration processes and the ma- rine C cycle (as described for “Gramella forsetii” KT0803, Bauer et al. (2006). Karstensen et al. (2015a) described a par- ticle maximum associated to the low-O2core of those eddies which likely harbors this specific heterotrophic community.
Further, in the core of the ACME presented here, the inte- grated abundance (upper 600 m) of large aggregates was five times higher than in surrounding waters (Hauss et al., 2015).
Enhanced productivity and consecutive respiration and O2
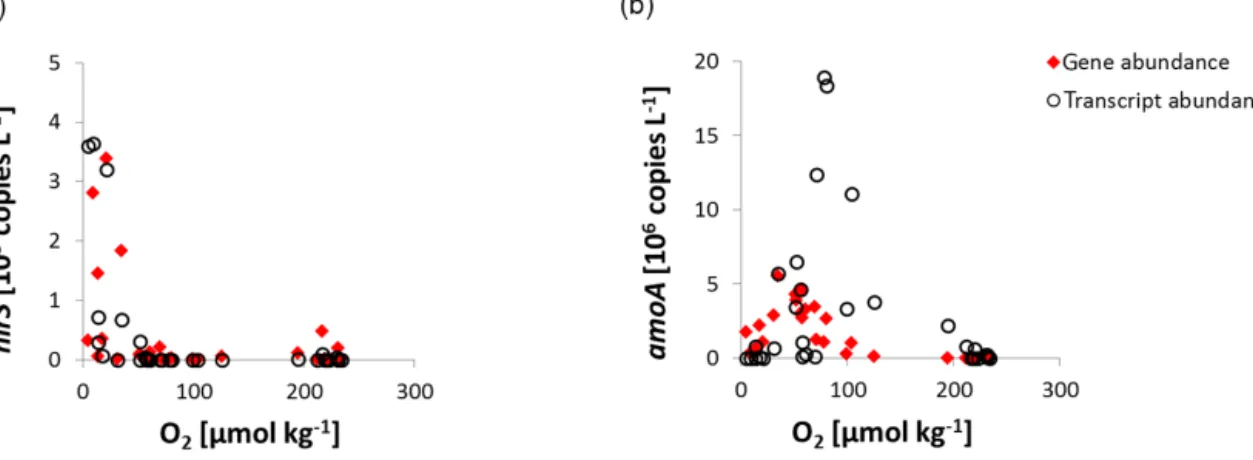
decrease may enable N loss processes to occur in the open ETNA, which have previously not been described for the ETNA waters (Löscher et al., 2012, 2015; Ryabenko et al., 2012). qPCR results of key gene distribution (amoA for ni- trification as sum of bacterial and archaeal nitrifiers, nirS as key gene for denitrification) in that area show a decrease of amoA in the eddy, while nirS shows higher abundances inside the eddy with ∼3000 copies L−1 at depth of the O2 mini- mum (compared to∼100 copies L−1outside the eddy). Be- sides a direct sensitivity of nitrifiers to anoxic conditions, the decrease in amoA gene abundance (determined by qPCR) to- wards the O2minimum in the eddy may result from an effect of elevated pCO2 (see Fiedler et al., 2015) and the corre- sponding drop in pH on ammonia due to a shift in the ammo- nia/ammonium equilibrium. The latter has previously been described to alter the efficiency of nitrification (Beman et al., 2011). Further, nirS transcripts as quantified by qPCR were detected in abundances up to 3600 transcripts L−1in the eddy O2minimum, while no transcripts were detected outside the eddy (Fig. 9).
The presence and expression of nirS supports the view that potential for N loss is also present in the usually oxic
open ETNA. This is in line with another study on nitrous ox- ide (N2O) production from the same eddy (Grundle et al., 2015), where the authors observed massively increased N2O concentrations in the oxygen deficient eddy core waters in connection with denitrification. Observations from e.g. the eastern tropical Pacific Ocean demonstrated previously that mesoscale eddies are drifting hotspots of N loss (Altabet et al., 2012). This might be explained by feedback mechanisms between eutrophication, enhanced primary productivity and consecutive enhanced export production, which may pro- mote denitrification in those systems as suggested by Kalve- lage et al. (2013). Our results strongly suggest that N loss is possible in eddy systems of that region, thus altering one major biogeochemical cycle with unknown consequences for the ETNA biogeochemistry.
In case of the described eddy, we neither detected key genes for anammox (hzo, Schmid et al., 2008) nor significant abundances of the key genes for dinitrogen fixation. The lat- ter has been investigated by screening for the functional key gene, nifH, which has been tested for classical diazotrophs as Trichodesmium, UCYN-A, UCYN-B, UCYN-C, gamma proteobacterial diazotrophs and DDAs; all of which were not quantifiable by qPCR. This may be explained by the high availability of inorganic N sources, as well as the prevalence of N : P close to the Redfield ratio of 16 : 1 as mentioned above.
Although N2fixation does not appear to play a role in the low-oxic core waters or adjacent surface waters of the eddy, it may occur as a result of increasing N loss and resulting excess P as previously discussed for other O2depleted ma- rine habitats (Deutsch et al., 2007; Fernandez et al., 2011;
Löscher et al., 2014; Ulloa et al., 2012).
Figure 9. Gene and transcript abundance vs. O2concentrations of samples from the eddy observations (eddy_1 and eddy_2) and CVOO.
(a) shows the key gene for denitrification, nirS, coding for the nitrite reductase, (b) shows archaeal amoA as key functional gene of ammonia oxidation, coding for the ammonia monooxygenase. Gene abundances are denoted in red, transcript abundances are indicated by black circles.
4 Conclusions
We investigated the microbial community structure and gene expression in a severely O2-depleted anticyclonic modewater eddy in the open waters of the ETNA OMZ region. This was then compared to the eddy observations to background sig- nals from the ETNA open-ocean CVOO time series site and the Mauritanian upwelling region, where the eddy was likely formed.
A significant difference between microbial communities outside and inside the eddy along with an overall loss in bac- terial diversity in the low-O2core of the eddy was observed.
Similarity was found between the microbial community in the eddy core and on the shelf. This unique microbial com- munity may shape the specific character of this O2-depleted eddy progressively over time.
We observed enhanced primary production in the eddy, presumably due to an increased nutrient supply related to the eddy dynamics (Karstensen et al. 2015b). We found a spe- cific HNLC ecotype of Prochlorococcus, which may play a role in mediating inorganic C to certain organic C sources for the associated heterotrophic community present in the eddy.
Importantly, we found the first indication for N loss processes in the ETNA region. Low-O2eddies in that region thus rep- resent an isolated ecosystem in the open ocean, forced by strongly elevated biological productivity, which travels with the eddy. This leads to consequent enhanced respiration and further deoxygenation in its core waters.
At one stage the low-O2eddies will lose coherence and the extreme signatures will be released into and mixed with the surrounding waters (Karstensen et al., 2015a). The ACME formation frequency for the ETNA (12–22◦N and 15–
26◦W) has been estimated to be about 2 to 3 yr−1(Schütte et al. 2015), hence no large-scale impact of the eddies are ex- pected. However, an unexpected shift in elemental ratios or other anomalies, normally expected for regions with much
lower minimal oxygen levels than the ETNA, may be de- tected and explained by the dispersal of low-O2eddies. An- other factor to consider is the impact of deoxygenation of the ETNA (Stramma et al., 2008) as it may result in even lower O2conditions to be created in the low-O2eddies. With regard to the distinct character of the low-O2eddies and the critical shift in microbial diversity and biogeochemistry that occur over relatively short times, this study contributes to under- stand and evaluate the far-reaching effects of future and past ocean deoxygenation.
The Supplement related to this article is available online at doi:10.5194/bg-12-7467-2015-supplement.
Author contributions. C. R. Löscher designed the study together with B. Fiedler, A. Körtzinger, H. Hauss and J. Karstensen;
M. Philippi and C. R. Löscher validated the NGS primer sets for marine samples, performed the molecular analysis, processed the molecular data and analyzed hydrographic data. S. Künzel performed the high-throughput sequencing runs. M. A. Fischer and S. C. Neulinger performed bioinformatic analysis of high- throughput data sets. A. Singh performed C-uptake measurements and data analysis, F. Philippi, J. Karstensen and A. Körtzinger designed the eddy detection and tracking system. B. Fiedler, F. Philippi, A. Körtzinger, H. Hauss and C. R. Löscher planned the sampling campaign and B. Fiedler performed hydrographical mea- surements and analyzed the data. S. C. Neulinger performed statisti- cal analysis and modeling. C. R. Löscher wrote the manuscript with input from all co-authors.
Acknowledgements. We thank the authorities of Cape Verde and Mauritania for the permission to work in their territorial waters. We acknowledge the support of the captains and crews of R/V Islandia
and R/V Meteor as well as the chief scientist of M105, M. Visbeck, for his spontaneous support. Moreover, we acknowledge I. Mon- teiro and M. Lohmann for performing oxygen and nutrient mea- surements, D. Grundle for sampling on R/V Islandia, C. Hoffman for technical assistance and the captains, crews and chief scientists of Meteor M107, S. Sommer and M. Dengler, for providing hy- drographical data. We acknowledge H. Bange, G. Krahmann and R. Kiko for helpful discussion of the results. G. Petrick, flying to Cape Verde to repair the liquid N2 generator was priceless – we thank you a lot for this personal effort. We thank T. Treude for edit- ing this manuscript. Further, we thank J. M. Beman and two anony- mous reviewers for helpful discussion of the manuscript and A. Paul for language editing.
Financial support for this study was provided by a grant from the cluster of excellence “The Future Ocean” to C. R. Löscher, A. Körtzinger and H. Hauss. Authors C. R. Löscher, S. C. Neulinger, H. Hauss and M. Philippi were funded by the DFG Collaborative Research Centre754 (www.sfb754.de). M. A. Fischer was funded and S. C. Neulinger was co-funded by the BMBF project BioPara funded to R. A. Schmitz (grant no. 03SF0421B), A. Singh was funded by the cluster of excellence “The Future Ocean”, B. Fiedler was funded by the BMBF project SOPRAN (grant no. 03F0662A).
Edited by: T. Treude
References
Ahlgren, N., Rocap, G., and Chisholm, S.: Measurement of Prochlorococcus ecotypes using real-time polymerase chain re- action reveals different abundances of genotypes with similar light physiologies, Environ. Microbiol., 8, 441–454, 2006.
Altabet, M. A., Ryabenko, E., Stramma, L., Wallace, D. W.
R., Frank, M., Grasse, P., and Lavik, G.: An eddy-stimulated hotspot for fixed nitrogen-loss from the Peru oxygen minimum zone, Biogeosciences, 9, 4897–4908, doi:10.5194/bg-9-4897- 2012, 2012.
Angel, R., Matthies, D., and Conrad, R.: Activation of Methanogen- esis in Arid Biological Soil Crusts Despite the Presence of Oxy- gen, PlosOne, 6, e20453, doi:10.1371/journal.pone.0020453, 2011.
Arévalo-Martínez, D. L., Kock, A., Löscher, C. R., Schmitz, R. A., Stramma, L., and Bange, H. W.: Influence of mesoscale eddies on the distribution of nitrous oxide in the eastern tropical South Pa- cific, Biogeosciences Discuss., 12, 9243–9273, doi:10.5194/bgd- 12-9243-2015, 2015.
Baird, M. E., Suthers, I. M., Griffin, D. A., Hollings, B., Pattiaratchi, C., Everett, J. D., Roughan, M., Oubelkheir, K., and Doblin, M.:
The effect of surface flooding on the physical-biogeochemical dynamics of a warm-core eddy off southeast Australia, Deep-Sea Res. Pt. II, 58, 592–605, 2011.
Bauer, M., Kube, M., Teeling, H., Richter, M., Lombardot, T., Allers, E., Würdemann, C. A., Quast, C., Kuhl, H., Knaust, F., Woebken, D., Bischof, K., Mussmann, M., Choudhuri, J. V., Meyer, F., Reinhardt, R., Amann, R. I., and Glöckner, F. O.:
Whole genome analysis of the marine Bacteroidetes’Gramella forsetii’ reveals adaptations to degradation of polymeric organic matter, Environ. Microbiol., 8, 2201–2213, 2006.
Beman, J. M. and Carolan, M. T.: Deoxygenation alters bac- terial diversity and community composition in the ocean’s largest oxygen minimum zone, Nat. Commun., 4, 2705, doi:10.1038/ncomms3705, 2013.
Beman, J. M., Chow, C. E., King, A. L., Feng, Y. Y., Fuhrman, J. A., Andersson, A., Bates, N. R., Popp, B. N., and Hutchins, D. A.:
Global declines in oceanic nitrification rates as a consequence of ocean acidification, P. Natl. Acad. Sci. USA, 108, 208–213, doi:10.1073/pnas.1011053108, 2011.
Benjamini, Y. and Hochberg, Y.: Controlling the false discovery rate: A practical and powerful approach to multiple testing, J.
Roy. Stat. Soc. B, 57, 289–300, 1995.
Bertillson, S., Berglund, O., Pullin, M. J., and Chisholm, S. W.: Re- lease of dissolved organic matter by Prochlorococcus, ie et milieu – Life and environment, 55, 225–231, 2005.
Berube, P. M., Biller, S. J., Kent, A. G., Berta-Thompson, J.
W., Roggensack, S. E., Roache-Johnson, K. H., Ackerman, M., Moore, L. R., Meisel, J. D., Sher, D., Thompson, L. R., Camp- bell, L., Martiny A., and Chisholm, S. W.: Physiology and evolu- tion of nitrate acquisition in Prochlorococcus, ISME J., 9, 1195–
1207, doi:10.1038/ismej.2014.211, 2014.
Biller, S. J., Berube, P. M., Lindell, D., and Chisholm, S. W.:
Prochlorococcus: the structure and function of collective diver- sity, Nat. Rev. Microbiol., 13, 13–27, 2015.
Brown, M. V., Ostrowski, M., Grzymski, J. J., and Lauro, F. M.:
A trait based perspective on the biogeography of common and abundant marine bacterioplankton clades, Marine Genomics, 15, 17–28, 2014.
Bryant, J. A., Stewart, F. J., Eppley, J. M., and DeLong, E. F.: Mi- crobial community phylogenetic and trait diversity declines with depth in a marine oxygen minimum zone, Ecology, 93, 1659–
1673, 2012.
Buchan, A., LeCleir, G. R., Gulvik, C. A., and González, J. M.:
Master recyclers: features and functions of bacteria associated with phytoplankton blooms, Nat. Rev. Microbiol., 12, 686–698, doi:10.1038/nrmicro3326, 2014.
Carini, P., Steindler, L., Beszteri, S., and Giovannoni, S. J.: Nutrient requirements for growth of the extreme oligotroph “Candidatus Pelagibacter ubique” HTCC1062 on a defined medium, ISME J., 7, 592–602, 2013.
Chavez, F. P. and Messié, M.: A comparison of Eastern Boundary Upwelling Ecosystems, Prog. Oceanogr., 83, 80–96, 2009.
Chelton, D. B., Gaube, P., Schlax, M. G., Early, J. J., and Samelson, R. M.: The Influence of Nonlinear Mesoscale Eddies on Near- Surface Oceanic Chlorophyll, Science, 334, 328–332, 2011.
Chen, V. B., Davis, I. W., and Richardson, D. C.: KING (Kinemage, Next Generation): A versatile interactive molecular and scientific visualization program, Prot. Sci., 18, 2403–2409, doi:10.1002/pro.250, 2009.
Cole, J. R., Wang, Q., Fish, J. A., Chai, B., McGarrell, D. M., Sun, Y., Brown, C. T., Porras-Alfaro, A., Kuske, C. R., and Tiedje, J. M.: Ribosomal Database Project: data and tools for high throughput rRNA analysis, Nucleic Acids Res., 42, 633–
642, doi:10.1093/nar/gkt1244, 2014.
De Cáceres, M. and Legendre, P.: Associations between species and groups of sites: indices and statistical inference, Ecology, 90, 3566–3574, doi:10.1890/08-1823.1, 2009.
DeLong, E. F.: The microbial ocean from genomes to biomes, Na- ture, 459, 200–206, doi:10.1038/nature08059, 2009.
DeSantis, T. Z., Hugenholtz, P., Larsen, N., Rojas, M., Brodie, E.
L., Keller, K., Huber, T., Dalevi, D., Hu, P., and Andersen, G. L.:
Greengenes, a chimera-checked 16S rRNA gene database and workbench compatible with ARB, Appl. Environ. Microb., 72, 5069–5072, doi:10.1128/aem.03006-05, 2006.
Deutsch, C., Sarmiento, J. L., Sigman, D. M., Gruber, N., and Dunne, J. P.: Spatial coupling of nitrogen inputs and losses in the ocean, Nature, 445, 163–167, doi:10.1038/nature05392, 2007.
Edgar, R. C., Haas, B. J., Clemente, J. C., Quince, C., and Knight, R.: UCHIME improves sensitivity and speed of chimera detection, Bioinformatics, 27, 2194–2200, doi:10.1093/bioinformatics/btr381, 2011.
Fernandez, C., Farias, L., and Ulloa, O.: Nitrogen Fixa- tion in Denitrified Marine Waters, Plos One, 6, e20539, doi:10.1371/journal.pone.0020539, 2011.
Fiedler, B., Grundle, D., Hauss, H., Krahmann, G., Schütte, F., Monteiro, I., Silva, P., Vieira, N., and Körtzinger, A.: Biogeo- chemistry of oxygen depleted mesoscale Eddies in the open east- ern tropical North Atlantic, Biogeosciences Discuss., in prepara- tion, 2015.
Fierer, N., Hamady, M., Lauber, C. L., and Knight, R.: The influ- ence of sex, handedness, and washing on the diversity of hand surface bacteria, P. Natl. Acad. Sci. USA, 105, 17994–17999, doi:10.1073/pnas.0807920105, 2008.
Fischer, G., Karstensen, J., Romero, O., Baumann, K.-H., Donner, B., Hefter, J., Mollenhauer, G., Iversen, M., Fiedler, B., Mon- teiro, I., and Körtzinger, A.: Bathypelagic particle flux signatures from a suboxic eddy in the oligotrophic tropical North Atlantic:
production, sedimentation and preservation, Biogeosciences Dis- cuss., 12, 18253–18313, doi:10.5194/bgd-12-18253-2015, 2015.
Flombaum, P., Gallegos, J. L., Gordillo, R. A; Rincon, J., Zabala, L. L., Jiao, N., Karld, D. M., Li, W. K. W., Lomas, M. W., Veneziano, D., Vera, C. S., Vrugt, J. A., and Martiny, A. C.:
Present and future global distributions of the marine Cyanobac- teria Prochlorococcus and Synechococcus, P. Natl. Acad. Sci.
USA, 110, 9824–9829, 2013.
Forth, M., Liljebladh, B., Stigebrandt, A., Hall, P. O. J., and Treusch, A. H.: Effects of ecological engineered oxygenation on the bacterial community structure in an anoxic fjord in west- ern Sweden, ISME J., 9, 656–669, doi:10.1038/ismej.2014.172, 2014.
Frank, D. N., St Amand, A. L., Feldman, R. A., Boedeker, E. C., Harpaz, N., and Pace, N. R.: Molecular-phylogenetic characteri- zation of microbial community imbalances in human inflamma- tory bowel diseases, P. Natl. Acad. Sci. USA, 104, 13780–13785, doi:10.1073/pnas.0706625104, 2007.
Franz, J. M. S., Hauss, H., Sommer, U., Dittmar, T., and Riebesell, U.: Production, partitioning and stoichiometry of organic matter under variable nutrient supply during mesocosm experiments in the tropical Pacific and Atlantic Ocean, Biogeosciences, 9, 4629–
4643, doi:10.5194/bg-9-4629-2012, 2012.
Ganesh, S., Parris, D. J., DeLong, E. F., and Stewart, F. J.: Metage- nomic analysis of size-fractionated picoplankton in a marine oxygen minimum zone, ISME J., 8, 187–211, 2014.
Gao, H., Schreiber, F., Collins, G., Jensen, M. M., Kostka, J. E., Lavik, G., de Beer, D., Zhou, H.-Y., and Kuypers, M. M. M.: Aer- obic denitrification in permeable Wadden Sea sediments, ISME J., 4, 417–426, 2010.
Giovannoni, S. J., Britschgi, T. B., Moyer, C. L., and Field, K. G.:
Genetic diversity in Sargasso Sea bacterioplankton, Nature, 345, 60–63, doi:10.1038/345060a0, 1990.
Glöckner, F. O., Fuchs, B. M., and Amann, R.: Bacterioplankton compositions of lakes and oceans: a first comparison based on fluorescence in situ hybridization, Environ Microbiol., 65, 3721–
3726, 1999.
Grasshoff, G., Kremling, K., and Erhardt, M.: Methods of seawater analysis, 3 Edn., Wiley VCH, Weinheim, 1999.
Grundle, D. S., Löscher, C. R., Krahmann, G., Altabet, M. A., Bange, H. W., Karstensen, J., Körtzinger, A., and Fiedler, B.:
Extreme N2O activity in an oxygenated ocean, Nature Scientific Reports, submitted, 2015.
Hauss, H., Christiansen, S., Schütte, F., Kiko, R., Edvam Lima, M., Rodrigues, E., Karstensen, J., Löscher, C. R., Körtzinger, A., and Fiedler, B.: Dead zone or oasis in the open ocean? Zooplank- ton distribution and migration in low-oxygen modewater eddies, Biogeosciences Discuss., 12, 18315–18344, doi:10.5194/bgd- 12-18315-2015, 2015.
Hood, E. M., Sabine, C. L., and Sloyan, B. M.: The GO-SHIP Re- peat Hydrography Manual: A Collection of Expert Reports and Guidelines, IOCCP Report Number 14, ICPO Publication Series Number 134, available at: http://www.go-ship.org/HydroMan.
html (last access: 19 March 2013), 2010.
Jickells, T. D., An, Z. S., Andersen, K. K., Baker, A. R., Bergametti, G., Brooks, N., Cao, J. J., Boyd, P. W., Duce, R. A., Hunter, K.
A., Kawahata, H., Kubilay, N., laRoche, J., Liss, P. S., Mahowald, N., Prospero, J. M., Ridgwell, A. J., Tegen, I., and Torres, R.:
Global iron connections between desert dust, ocean biogeochem- istry, and climate, Science, 308, 67–71, 2005.
Jost, L.: Entropy and diversity, Oikos, 113, 363–375, doi:10.1111/j.2006.0030-1299.14714.x, 2006.
Jost, L.: Partitioning diversity into independent alpha and beta com- ponents, Ecology, 88, 2427–2439, doi:10.1890/06-1736.1, 2007.
Kalvelage, T., Lavik, G., Lam, P., Contreras, S., Artega, L., Löscher, C. R., Oschlies, A., Paulmier, A., Stramma, L., and Kuypers, M.
M. M.: Nitrogen cycling driven by organic matter export in the South Pacific oxygen minimum zone, Nat. Geosci., 6, 228–234, 2013.
Karstensen, J., Stramma, L., and Visbeck, M.: Oxygen minimum zones in the eastern tropical Atlantic and Pacific oceans, Prog.
Oceanogr., 77, 331–350, doi:10.1016/j.pocean.2007.05.009, 2008.
Karstensen, J., Fiedler, B., Schütte, F., Brandt, P., Körtzinger, A., Fischer, G., Zantopp, R., Hahn, J., Visbeck, M., and Wallace, D.: Open ocean dead zones in the tropical North Atlantic Ocean, Biogeosciences, 12, 2597–2605, doi:10.5194/bg-12-2597-2015, 2015a.
Karstensen, J., Schütte, F., Pietri, A., Krahmann, G., Fiedler, B., Körtzinger, A., Löscher, C. R., Grundle, D., and Hauss, H.:
Anatomy of open ocean dead-zones based on high-resolution multidisciplinary glider data, Biogeosciences Discuss., in prepa- ration, 2015b.
Kozich, J. J., Westcott, S. L., Baxter, N. T., Highlander, S. K., and Schloss, P. D.: Development of a dual-index sequencing strat- egy and curation pipeline for analyzing amplicon sequence data on the MiSeq Illumina sequencing platform, Appl. Environ. Mi- crob., 79, 5112–5120, doi:10.1128/aem.01043-13, 2013.