Characteristics and impact of mesoscale eddies in the eastern tropical North Atlantic
Dissertation
zur Erlangung des Doktorgrades
der Mathematisch-Naturwissenschaftlichen Fakult¨ at der Christian-Albrechts-Universit¨ at
zu Kiel
vorgelegt von Florian Sch¨ utte
Kiel 2016
Referent: Prof. Dr. Peter Brandt Korreferent: Prof. Dr. Arne Biastoch
Datum der m¨ undlichen Pr¨ ufung: 22.7.2016 Zum Druck genehmigt:
Gez.: Prof. Dr. Wolfgang J. Duschl, Dekan
Zusammenfassung
In dieser Studie wurden die Eigenschaften mesoskaliger Wirbel im tropischen Nordost Atlan- tik (12-22◦N und 15-26◦W) untersucht. Hierf¨ur wurden die mittleren Oberfl¨achensignaturen der Wirbel und Anomalien der Vertikalstrukturen relativ zum umgebenden Wasser aus einer Kombi- nation von mehreren ozeanographischen Messsystemen (Verankerungen, Argo-Floats, Satelliten, Schiffen und Gleitern) erstellt. Ber¨ucksichtigt man ausschließlich die Rotationsrichtungen, las- sen sich Wirbel in Zyklone und Antizyklone unterteilen. Mithilfe der vertikalen Schichtung kann ein dritter Wirbeltyp unterschieden werden, der sogenannte antizyklonale Modewasser-Wirbel (ACME), welcher auch intra-thermokliner Wirbel genannt wird. Der Kern eines ACME besteht aus einer vergleichsweise homogenen Wassermasse, und wird von nach oben und unten aus- gelenkten Dichtefl¨achen eingeschlossen. Somit transportieren ACMEs starke hydrographische Anomalien innerhalb eines relativ schmalen Dichtebereichs. Alle drei Wirbeltypen konnten via Satellitenbeobachtung durch die Kombination der folgenden Parameter identifiziert und klas- sifiziert werden: Meeresoberfl¨achenauslenkung (SLA), Meeresoberfl¨achentemperatur (SST) und Meeresoberfl¨achensalzgehalt (SSS). Die Oberfl¨achensignaturen von Antizyklonen/Zyklonen wei- sen erh¨ohte/reduzierte SLA, SST und SSS auf. Von allen antizyklonal rotierenden Wirbeln zeig- ten etwa 20% reduzierte SST und SSS auf und konnten somit als ACMEs identifiziert werden.
Im gesamten Untersuchungsgebiet wurden 146±4 Wirbel pro Jahr mit einer Lebensdauer von mehr als 7 Tagen gez¨ahlt (52% Zyklone, 39% Antizyklone, 9% ACMEs). Alle untersuchten Wir- bel waren isoliert und transportierten Wassermassen von der K¨uste in den offenen Ozean (∼2.1 Sv; 1 Sv = 106 m3s−1). Der vom Wirbeltyp abh¨angige W¨armefluss (Salzfluss) entsprach -0.46 T W (-23.15 x 10³ kgs−1) / 0.35T W (12.9 x 10³kgs−1) / -0.49T W (-29.9 x 10³kgs−1) f¨ur einen Zyklon / Antizyklon / ACME. Des Weiteren zeichneten sich Zyklone und ACMEs mit einer sehr niedrigen Sauerstoffkonzentration in ihren Wirbelkernen, einer verst¨arkten Prim¨arproduktion an der Oberfl¨ache (erh¨ohter Chlorophyll Gehalt) sowie einem, verglichen mit dem Hintergrundfeld, 3-5 mal h¨oheren Sauerstoffverbrauch innerhalb des isolierten Wirbelkerns aus. Trotz der starken Isolation des Kerns, bedingt die erh¨ohte Prim¨arproduktivit¨at eine vertikale Zufuhr von N¨ahr- stoffen in die euphotische Zone. Es wird die Hypothese aufgestellt, dass die Bildung kritischer Schichten und infolgedessen eine intensive vertikale Durchmischung am Wirbelrand auftritt. Her- vorgerufen wird diese durch die Wechselwirkung der Rotationsbewegung des Wirbels mit Wellen, die eine Frequenz nahe der Tr¨agheitsfrequenz aufweisen. Dieser Prozess k¨onnte einen Weg be- schreiben, der vertikalen Transport von N¨ahrstoffen in die euphotische Zone und die zeitgleiche Existenz eines isolierten Kerns m¨oglich macht. Im Durchschnitt lag die Sauerstoffverbrauchsrate f¨ur Zyklone (ACMEs) in den isolierten Kernen bei 0.10±0.12 (0.19±0.08) µmolkg−1d−1. Bei einer Wirbellebenszeit von bis zu einem Jahr f¨uhrt das zu den gemessenen hypoxischen, teilweise sogar suboxischen Bedingungen in den Wirbelkernen. Die Analyse zeigt, dass die beobachteten Wirbelkerne, die durch extreme Wassermassenanomalien gekennzeichnet sind, h¨aufiger als zuvor erwartet und sogar nahe dem ¨Aquator (8◦N) auftreten. Die Dispersion der niedrigen Sauerstoff- konzentration, entlang von Isopyknen, kann laut regionalen Budgetberechnungen bis zu 6% des Sauerstoffverbrauchs in der oberen Schicht des Nordostatlantiks erkl¨aren.
Abstract
A combination of multiple ocean observing system elements (moorings, Argo floats, satellites, ships, gliders) is used to assess the mesoscale eddy activity in the tropical Atlantic off northwe- stern Africa (12-22◦N and 15-26◦W) and to construct mean surface patterns as well as vertical anomalies relative to the surrounding water for the different eddy types. Considering just the rotation direction of the surface flow field, eddies are categorized into cyclonic and anticyclonic eddies. If vertical stratification is considered additionally, a refinement can be made by distinguis- hing between anticyclonic and anticyclonic modewater eddies (ACMEs, also intra-thermocline eddies). ACMEs are characterized by a subsurface mode of rather homogenous water located between upward and downward displaced isopycnals. Consequently, these eddies may transport large hydrographic anomalies in a relatively narrow density range. Eddies can be identified and classified from space by investigating a combination of three sea surface parameters: Sea level anomaly (SLA), sea surface temperature (SST) and sea surface salinity (SSS). Anticyclo- nes/cyclones are associated with an elevation/depression of SLA and enhanced/reduced SST and SSS in their cores. For both eddy types, SST dominates sea surface density and consequent- ly anticyclones/cyclones are associated to reduced/enhanced surface density. However, 20% of all anticyclonic eddies are associated with reduced SST and SSS instead and are identified as ACMEs. In the area of interest, about 146±4 eddies per year with a minimum lifetime of 7 days are identified (52% cyclones, 39% anticyclones, 9% ACMEs). All observed eddies are isolated and serve as transport agents, exporting water from the coast into the open ocean (∼2.1Sv; 1 Sv = 106 m3s−1). The associated eddy type dependent heat (salt) flux is estimated to be -0.46 T W (-23.15 x 10³ kgs−1) / 0.35 T W (12.9 x 10³ kgs−1) / -0.49 T W (-29.9 x 10³ kgs−1) for single cyclone / anticyclone / ACME, respectively. In cyclones and ACMEs low oxygen cores are identified and related to enhanced primary production at the surface (enhanced chlorophyll) and an associated elevated respiration rates (3-5 times higher than the background) within the isolated eddy cores. Despite the isolation of the eddy core, the enhanced primary productivity at the surface requires a vertical supply of nutrients into the euphotic zone. It could be observed that the phase speed of near inertial waves and the speed of the mean eddy flow are of similar magnitude. Therefore, critical layer formation is expected and mixing is likely to occur close to the euphotic zone/mixed layer at the eddy periphery. These processes describe a scenario that supports an upward nutrient flux towards the euphotic zone, but still maintains a highly isolated eddy core, which is seen by the observations. On average the apparent oxygen utilization rate (aOUR) for cyclones (ACMEs) in their isolated cores is 0.10±0.12 (0.19±0.08)µmolkg−1d−1. If the aOUR is continuously active during a typical eddy life time hypoxic or even suboxic condi- tions in the eddy cores can occur. The analysis of mesoscale eddies in the eastern tropical North Atlantic shows that anomalous environments associated with eddy cores occur more frequently than previously expected and can be observed even in the proximity to the equator (8◦N). From regional budget calculations it is shown that an isopycnal dispersion of the low oxygen water after the decay of the eddies can explain up to 6% of the oxygen consumption in the upper northeast Atlantic.
Contents
1 Introduction 1
1.1 The eastern tropical North Atlantic . . . 2
1.2 Mesoscale dynamics . . . 4
1.2.1 Rossby number, Richardson number and the Rossby radius of deformation 5 1.2.2 Nonlinearity of eddies . . . 6
1.2.3 Overall motivation to study mesoscale eddies . . . 7
1.3 Observations of mesoscale eddy activity . . . 8
1.3.1 Past - The last hundred years . . . 8
1.3.2 Present - Improvements and open questions . . . 11
1.4 Approach and data strategy of this thesis . . . 15
1.5 Scientific key questions . . . 16
2 Open ocean dead zones in the tropical North Atlantic Ocean 17 3 Occurrence and characteristics of mesoscale eddies in the tropical northeastern At- lantic Ocean 28 4 Characterization of dead-zone eddies in the tropical Northeast Atlantic Ocean 53 5 Upwelling and isolation in oxygen-depleted anticyclonic modewater eddies and impli- cations for nitrate cycling 80 6 Summary 107 6.1 Progress on scientific key questions . . . 107
6.2 Integration of the results into the current level of knowledge . . . 111
6.3 Related results obtained in co-authored publications . . . 112
6.4 Outlook . . . 113
6.5 Own Publications . . . 115
7 Acknowlegdements 131
1 Introduction
The ocean is inherently turbulent on several spatial scales. Some of these turbulent motions are characterized by horizontal shear, grow and develop into linear wave-like patterns and/or nonlinear vortices, whereas the latter are loosely described as eddies. The so-called mesoscale eddies are ubiquitous in the world oceans and an essential part of the oceanic motion on pe- riods greater than the inertial and tidal periods [Stammer and Wunsch, 1999; Chelton et al., 2007, 2011b]. Mesoscale eddies have radii of about 10 to 200kmand lifetimes from a few days to one year or even longer [Chelton et al., 2011b]. In contrast to linear waves, coherent mesoscale eddies have the capability to transport physical properties (e.g. heat, salt, mass, momentum) and numerous other biogeochemical tracers over long distances and across frontal boundaries [e.g. McWilliams, 1985; Flierl, 1981;Chaigneau et al., 2008;Zhang et al., 2014]. Thereby they impact the large-scale water mass distribution, the general circulation and ocean biology [e.g.
Robinson and Leslie, 1985; Roemmich and Gilson, 2001; Jayne and Marotzke, 2002; Biastoch et al., 2009;Nagai et al., 2015]. For a while, mesoscale eddies and other random fluctuations were regarded as nuisance, masking the mean flow. Improvements in ocean observing, in particular from satellite missions, but also from high resolution global ocean models revealed that instead they are a prominent feature of the ocean circulation [e.g. Chelton et al., 2007, 2011b; Capet et al., 2008a]. Over the last 20 years mesoscale eddies, and as such the turbulent character of the ocean, have gained much attention. It got obvious that knowledge about the characteristics and impacts of mesoscale eddies will improve our understanding of the whole ocean system covering various research disciplines [e.g. Lachkar and Gruber, 2012; Frenger et al., 2013; Nagai et al., 2015]. On the one hand, they physically interact with the mean flow by e.g. energy exchange, dispersing of tracers or play an important role in preconditioning of deep convection and sub- duction processes [e.g. Marshall, 1997; Qiu et al., 2008; Xu et al., 2014]. On the other hand, they influence biogeochemical properties and have an impact on marine life in forming isolated open ocean ecosystems, which could evolve due to vertical transport processes within the eddies [e.g.McGillicuddy et al., 2007;Mahadevan et al., 2008; Gaube et al., 2014b].
The aim of this thesis is to enhance the understanding of the occurrence, characteristics, evo- lution and impact of mesoscale eddies in the boundary upwelling system of the eastern tropical North Atlantic (ETNA; 4◦N to 22◦N and from the shelf at the eastern boundary to 38◦W) on the basis of observational data. With the aid of satellite data, the general eddy activity is assessed and mean eddy surface signatures are constructed. Due to a combination of satellite data with vertical profiles a mean eddy-type dependent vertical structure, heat, salt and oxygen fluxes are derived. In addition, the physical and biogeochemical co-variability and the associated vertical transport processes within mesoscale eddies are investigated using high-resolution glider surveys.
1 Introduction
1.1 The eastern tropical North Atlantic
The ETNA region (4◦N to 22◦N, extending from the eastern boundary shelf offshore to 38◦W) includes the area of the unventilated shadow zone [Luyten et al., 1983] as well as one of the world oceans four highly productive eastern boundary upwelling systems (EBUSs) [e.g.Bakun, 1990;Pauly and Christensen, 1995; Carr et al., 2008;Messi´e et al., 2009;Lachkar and Gruber, 2012, Fig. 1.1]. Within the EBUSs equatorward winds result in offshore Ekman transport driving coastal upwelling and alongshore (under-) currents [e.g.Bakun and Nelson, 1991;Tomczak et al., 1994;Capet et al., 2008a]. On the continental shelf upwelling of cold, fresh, nutrient-rich waters with high concentrations in nitrate and organic and inorganic carbon, can create intense fronts over short distances separating coastal from offshore waters, which are warmer, saltier, nutrient- depleted and characterised by low concentrations in nitrate as well as organic and inorganic carbon [e.g.Wyrtki, 1962; Strub et al., 1998; Chavez and Messi´e, 2009; Nagai et al., 2015].
150
oW 130
oW 110
oW 90
oW 70
oW 50
oW 30
oW 10
oW 10
oE 30
oE 40
oS
20
oS 0
o20
oN 40
oN
PCUS °C
30
2 16 23 9 CALUS
BENUS CANUS
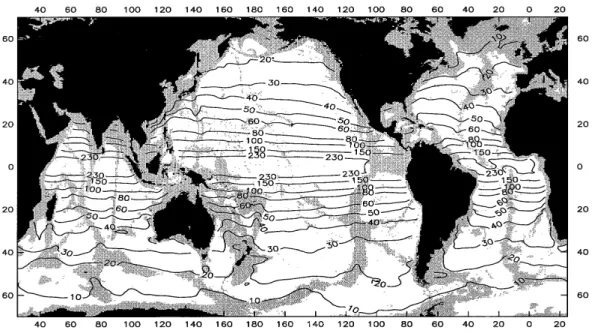
Figure 1.1: Sea surface temperature snapshot (May 4th, 2016) based on satellite measurements (Microwave Infrared Fusion SST from www.remss.com) of the east Pacific and Atlantic Ocean.
The boxes highlight the four major eastern boundary upwelling systems (EBUS), namely the Peru-Chile and California upwelling systems (PCUS and CALUS, respectively) in the Pacific Ocean, and the Canary and Benguela upwelling systems (CANUS and BENUS, respectively) in the Atlantic Ocean.
In the EBUSs mesoscale eddies act as a major transport agent between coastal waters and the open ocean [e.g. Marchesiello et al., 2003; Correa-Ramirez et al., 2007; Chaigneau et al., 2008;Pegliasco et al., 2015]. Eddies are generated mostly close to the coast [e.g. Chelton et al., 2011b;Liang et al., 2012], where large horizontal/vertical shears exist in an otherwise quiescent region. The eddies enclose specific coastal water mass properties and, in translating westward, they transport the properties offshore within their core [e.g. Johnson and McTaggart, 2010;
Chaigneau et al., 2008, 2011; Nagai et al., 2015]. In the open ocean the water mass properties are redistributed once the eddy decays [e.g. Swart et al., 2008]. Regional studies on mesoscale
1.1 The eastern tropical North Atlantic eddy dynamics and transports in EBUSs are available for the southeastern Pacific Ocean [e.g.
Chaigneau and Pizarro, 2005; Chaigneau et al., 2008, 2011] and the northeastern Pacific [e.g.
Kurian et al., 2011; Liang et al., 2012; Chang et al., 2012], but for the Atlantic Ocean regional eddy studies are rare.Sangr`a et al.[2009] studied eddies in the northeastern Atlantic but focusing more on the northern Canary Islands and the Mediterranean outflow. The general characteristics of mesoscale eddies in the ETNA as well as their contribution to the dispersal of water mass properties and biogeochemical tracers are undocumented so far. Even less is known about the rich biology and associated strong biogeochemical cycles within eddies and their impact on the open ocean environment. This study will investigate how eddies contribute to the communication of the coastal upwelling region with the open ocean in the ETNA region.
The ETNA region is characterized by a weak, large-scale mean circulation, but pronounced mesoscale eddy variability [Mittelstaedt, 1991;Stammer and Wunsch, 1999;Brandt et al., 2015].
Strong coastal upwelling between 10◦N to 20◦N usually occurs in boreal winter and spring, giving rise to a strong phytoplankton bloom near the African coast [e.g.Messi´e et al., 2009; Lachkar and Gruber, 2012]. During the upwelling season the ETNA is governed by substantial variability with intense interweaving of warm offshore waters with cold, upwelled waters as observational evidence indicates (e.g. like in the California current: [Brink and Cowles, 1991], or off Peru [Capet et al., 2008b]). In general, in the ETNA region surface heating results in strong stratification of the upper ocean. Beneath the surface waters, a mixture of North Atlantic Central Water (NACW), which is formed in the ventilated part of the subtropical gyre of the North Atlantic, and South Atlantic Central Water (SACW), which is upwelled in coastal and equatorial regions, is typically found. The Cape Verde Frontal Zone (CVFZ) separates these two water masses, with NACW in the northwest and SACW in the southeast of the ETNA region [Zenk et al., 1991].
The upwelling region itself is supplied by waters with South Atlantic origin via a pathway along the North Brazil Current (NBC), the North Equatorial Undercurrent (NEUC) and the Poleward Undercurrent (PUC) [Glessmer et al., 2009; Pe˜na Izquierdo et al., 2015]. The PUC is a highly variable coastal undercurrent induced by the large-scale alongshore pressure gradient set by the southward winds off the African coast [Barton, 1989]. It is strongest during the upwelling season with a mean transport estimate of about 1 Sv (1Sv= 106 m3s−1) [Tomczak, 1973;Mittelstaedt, 1991; Schafstall et al., 2010]. Simultaneously to the suppression of coastal upwelling south of Cap Blanc at 21◦N, a northward surface boundary current called Mauretania Current (MC) is established at the eastern boundary of the ETNA region [Pe˜na Izquierdo et al., 2012, Fig. 1.2a].
The strength of the MC is strongly related to the seasonality of the North Equatorial Counter Current (NECC) being strongest in boreal summer and weaker and more unsteady in boreal winter [Mittelstaedt, 1991; L´azaro et al., 2005]. In addition, the ETNA region is characterized by a distinct oxygen minimum zone (OMZ) with a core depth of about 450 m [Karstensen et al., 2008; Brandt et al., 2015]. The OMZ is primarily controlled by sluggish ventilation along the respective isopycnals [Wyrtki, 1962; Luyten et al., 1983]. It extends from the eastern boundary into the open ocean and is located within the so-called shadow zone of the ventilated thermocline, bounded by the more energetic circulation of the subtropical gyre in the north and the energetic equatorial current regime in the south [Luyten et al., 1983;Karstensen et al., 2008;Brandt et al.,
1 Introduction 2015, Fig.1.2a].
−17 −16.9 −16.8 −16.7 −16.6 −16.5 −16.4
0
200
400
600
800
1000
1200
40
40
50 50 50 50
50
50 50
60
60 60
60
90
90 90
120
120200 120
Depth [m]
Longitude
Oxygen (O2) µMol/kg and density ( ) in kg/m3 along the 18°N Section FS Meteor cruise M107, June 8−14 2014
µMol/kg
20 40 60 80 100 120 140 160 180 200 220
200 400 600 800 1000 1200
Depth [m]
-17 -16.9 -16.8 -16.7 -16.6 -16.5 -16.4 Longitude
50 50
50 50
50
60 90 120
40 40
60
µmol/kg 220
20 120 170
70
35oW 30oW 25oW 20oW 15oW 4oN
8oN 12oN 16oN 20oN
40 60 80 100 120 140 160
35oW 30oW 25oW 20oW 15oW 4oN
8oN 12oN 16oN 20oN
40 60 80 100 120 140 160
µmol/kg
NECC/NEUC NEC
MC
a) b)
Figure 1.2: a) Map of the ETNA, where colored contours indicate the oxygen minimum in the upper 200 m (in µmolkg−1) as obtained from the MIMOC climatology [Schmidtko et al., 2013]. Superimposed is a schematic of the surface currents adapted from Brandt et al. [2015]
(black arrows: North Equatorial Current (NEC), Mauretania Current (MC), North Equatorial Countercurrent (NECC), North Equatorial Undercurrent (NEUC), Guinea Current (GC); black dashed arrows indicate weak zonal current bands observed in the region). The white line marks the shelf section at 18◦N off Mauretania shown on the right. b) Shelf section of oxygen in µmolkg−1 along 18◦N conducted during the Meteor cruise M107 (June 8-14th, 2014). Black line represent density layer in kgm−3.
Besides the deep OMZ with a core at about 450 m depth and created from the gyre scale ventilation, the local ventilation and consumption in the upper layer of the ETNA results in a secondary, shallower oxygen minimum, with a core depth at about 80 m [Brandt et al., 2015;
Karstensen et al., 2008, Fig.1.2b]. The shallow oxygen minimum intensifies from the equator towards the north with minimum values between 35-40µmolkg−1 on the African shelf at about 20◦N [Brandt et al., 2015, Fig.1.2]. It is assumed that the shallow OMZ develops due to enhanced biological productivity and an increased respiration associated with sinking particles in the upper water column [Wyrtki, 1962; Karstensen et al., 2008;Brandt et al., 2015].
1.2 Mesoscale dynamics
Turbulent motions characterize processes over a wide range of scales in the ocean [Olbers et al., 2012]. Mesoscale eddies with diameters of several hundred kilometers compose the upper end of turbulent motions, whereas internal waves with wavelengths on centimeter scale, which can break and stimulate diapycnal mixing taking place on a millimeter scale constitute the lower end of sca- les of turbulent motions. Traditionally turbulent motions have been classified in three regimes:
the two-dimensional geostrophic mesoscale, the internal wave field and the three-dimensional microscale [Ferrari and Wunsch, 2009]. In this thesis the characteristics and impacts of geostro- phic mesoscale eddies in the described ETNA region are investigated. Mesoscale eddies (the prefix “meso” means “intermediate”) describe features with radii of about 10 to 200 km and a lifetime of a few days to one year or even longer [Chelton et al., 2007]. In addition, with sub-
1.2 Mesoscale dynamics mesoscale processes, a fourth regime expanding the traditional view of the classification will be investigated within the underlying thesis. It is defined as slightly smaller than the mesoscale, with horizontal scales of 100 m to 10 km (or less than the first baroclinic mode Rossby radius of deformation (Rd)), vertical scales smaller than the depth of the main pycnocline and a life- time of one day [McWilliams and Molemaker, 2011; Levy et al., 2012]. Submesoscale processes play an important role in the upper layers of the ocean, particularly when ageostrophic motions are relevant [Thomas, 2008;Levy et al., 2012]. In order to explain and examine mesoscale and submesoscale processes in the following thesis, it is helpful to define certain metrics of different dynamical regimes.
1.2.1 Rossby number, Richardson number and the Rossby radius of deformation The Richardson (Ri) and Rossby (Ro) number are non-dimensional numbers, which are used in oceanography to distinguish between dynamical regimes.
Ro is defined as,
Ro=U/f L, (1.1)
where f is the Coriolis parameter and U, L are the characteristic velocity and length scale, which in case of eddies are the maximum circumpolar velocity and eddy radius, respectively. It is a measure to decide whether advection or the Coriolis force dominate within the momentum equation. Large-scale planetary flows have smallRo of up to 0.2, while local rotational effects gain importance withRoapproaching 1. For typical velocity and length scales of mesoscale eddies examined within this thesis, Ro is low or close to 1. Consequently, the horizontal component of the momentum equation reduces to a balance between the pressure gradient force and the Coriolis force, called a geostrophic balance.
Ro can also be expressed as
Ro=ξ/f, (1.2)
whereξ = ∂v∂x−∂u∂y is the vertical component of the relative vorticity, with u and v being zonal and meridional velocity, respectively. Counter-clockwise (clockwise) rotating eddies have positive (negative) relative vorticity and can modify the absolute vorticity, which isη = f+ξ [Kunze, 1985;Lee and Niiler, 1998].
Ri is defined as
Ri =N2/S2, (1.3)
whereN2 =−ρg0∂ρ∂z is the Brunt-V¨ais¨al¨a frequency, withg being the acceleration due to gravity, ρ0 being a reference density,ρbeing the locally defined density andS2= (∂u∂z)2+ (∂v∂z)2represen- ting vertical shear. Accordingly,Ri describes the ratio between stratification and vertical shear.
IfRi is smaller than 14 the flowstructure is more likely to be instable, than stable. The examined mesoscale eddies in this thesis show largeRi(Ri >>1).
The eddy length scale depends on latitude and ocean stratification and is closely related to the first baroclinic mode Rossby radius of deformation,
Rd=c0/f, (1.4)
1 Introduction
where c0 is the phase speed of an internal gravity wave of baroclinic mode one and f is the Coriolis parameter.Rdvaries with latitude (due to the dependency onf, Fig. 1.3) and describes the threshold size of an eddy to be in a geostrophic (Ro <1) or ageostrophic (Ro >1) regime.
The ETNA region is characterized byRdbetween 40 to 60 km (Fig.1.3).
MARCH1998 C H E L T O N E T A L . 439
FIG. 5. The global zonally averaged first baroclinic gravity-wave phase speedc1(in m s21) obtained from the 18griddedc1shown in Fig. 2.
FIG. 6. Global contour map of the 18 318first baroclinic Rossby radius of deformationl1in kilometers computed by Eq. (2.3) from the first baroclinic gravity-wave phase speed shown in Fig. 2. Water depths shallower than 3500 m are shaded.
sparse regions of the ocean (e.g., most of the Southern Hemisphere), broadens the spatial scales of water prop- erty distributions in regions of sloping isopycnals. Lo- zier et al. (1994, 1995) have shown that this problem
is further exacerbated by the use of isobaric averaging.
Because mixing in the ocean occurs primarily along isopycnal surfaces, spatial gradients of water properties are smaller on isopycnal surfaces than on isobaric sur- faces. For a given choice of spatial smoothing, spatial gradients of water properties are thus better retained by averaging and smoothing historical hydrographic data along isopycnal surfaces than by isobaric averaging and smoothing. Lozier et al. (1994) showed that isobaric averaging can actually yield spurious water mass anom- alies that are purely artifacts of the isobaric averaging process.
A new 18 318climatological-average North Atlantic hydrographic dataset has recently been constructed by Lozier et al. (1995, referred to hereafter as LOC) based on isopycnal averaging and minimal spatial smoothing over scales on the order of 200 km. Expansions of this dataset to include the South Atlantic and North Pacific are under way. The sensitivity of the Rossby radius calculation presented in section 3a to the density cli- matology from whichN2(z) is estimated is investigated here by comparison with 18 318Rossby radius esti- mates computed from the LOC climatological average hydrographic profiles.
Figure 1.3: Global map of the first baroclinic mode Rossby radius of deformationRdin kilometer.
Water depths shallower than 300m are shaded [taken fromChelton et al., 1998].
Due to the so-calledβ-effect, all reasonably large eddies must propagate in a westward direction.
The latitudinal dependency of f results in different Coriolis parameters at the northern and southern edges of the eddies and the pressure gradient force, which is equal at both edges, is not balanced equally. As a compensation, theβ-drift introduces an additional westward velocity which compensates for the imbalanced force.
1.2.2 Nonlinearity of eddies
Eddies can be distinguished from linear waves by the nonlinearity parameter U/c, where U is the maximum circumpolar velocity and c is the translation speed of the eddy. Features with U/c > 1 are considered as nonlinear eddies, whereas features with U/c < 1 describe linear waves. Within this study only coherent, nonlinear mesoscale eddies (in the following referred to as eddies) are examined. A nonlinear eddy implies that fluid is trapped within the eddy core and that the exchange between the core and surrounding waters is reduced [e.g. McWilliams, 1985; Flierl, 1981; Chelton et al., 2011b]. The transport associated with these eddies can be considered as the mean eddy mass flux similar to the Stokes drift. Due to their ability to transport water mass properties in their cores and eventually release them, the isopycnal slopes at the water mass fronts are reduced with time. This mechanism leads to a dispersal of heat, salt, nutrients and other tracers in the ocean and a degradation of fronts due to eddies. This process is particularly important in regions where strong oceanic fronts with steep isopycnal
1.2 Mesoscale dynamics surfaces develop, for example at the western boundaries, the Antarctic Circumpolar Current (ACC), within the EBUSs or the tropical oceans [e.g. Roemmich and Gilson, 2001; Jayne and Marotzke, 2002;Zhang et al., 2014; Biastoch et al., 2009; Pegliasco et al., 2015].
1.2.3 Overall motivation to study mesoscale eddies
Despite a long history in studies of eddy activity, various aspects regarding processes and impacts of eddies still remain unclear. Studies using climate and ocean-only numerical model simulations show that a poor representation of eddies due to coarse horizontal resolution and/or incorrect parameterisation of the effects of eddies, can lead to major errors in e.g. representing the large scale circulation [e.g.Oschlies, 2002;Fox-Kemper et al., 2008;Delworth et al., 2012;Br¨uggemann and Eden, 2014;Xu et al., 2014]. For example, mesoscale eddies contain a considerable amount of the total energy of the oceans [Ferrari and Wunsch, 2009]. During their generation, they remove potential energy from the mean flow by barotropic/baroclinic instability transferring it to Eddy Kinetic Energy (EKE) [Olbers et al., 2012]. In the traditional view, an eddy with a length scale larger than Rd, will feed kinetic energy into larger scales transferring energy and momentum back into the mean flow according to the theory of geostrophic turbulence [Charney, 1971;Capet et al., 2008c]. On the other hand, if an eddy is smaller than the ambientRd, kinetic energy is transferred towards smaller scales until it is lost to heat by dissipation [Kolmogorov, 1941]. However, several studies have shown that it is not as simple as that: at the same time EKE can cascade from large eddies towards Rd and simultaneously from smaller eddy scales towards Rd [Nagai et al., 2015; Br¨uggemann and Eden, 2014]. This demonstrates the lack of understanding of the energy flux between the small-scale and geostrophic scales. However, as ocean currents do not accelerate unlimited in time, the total energy input must be balanced by dissipation. The exact role of eddies transferring and dissipating energy is, however, not clear and needs further investigation. One difficulty in the past and still today is the acquisition of a sufficient database to study these short-lived and small-scale phenomena.
1 Introduction
1.3 Observations of mesoscale eddy activity
1.3.1 Past - The last hundred years
1.3.1.1 Eddy observations on a global scale
The first observation of eddies was documented by Columbus Iselin and colleagues in 1930 during repeated cruises between Montauk and Bermuda, which were conducted to obtain Gulf Stream sections [Cullen, 2005]. Iselin interpreted some features that appeared to have crossed the Gulf Stream several times as solitary internal waves, but in fact, these rotating currents most likely were eddies. The improvements in ship navigation and the invention of the bathythermographs during World War 2 increased the probability to successfully identify eddies. First intentional measurements of a cyclonic cold core Gulf Stream ring were performed by Iselin and Fuglister [1948]. However, it took another twenty years until Fuglister [1972] published the first study focusing solely on the dynamics of eddies. This can be considered as the beginning of scientific investigations of eddies and meanders. The first observations of bio/physical interactions and the influence of eddies on marine ecosystems were conducted late in the last century [The Ring Group, 1981; Robinson and Leslie, 1985]. All of these early observations were limited in data coverage and only provide snapshots of individual eddy events. The breakthrough came along with the launch and progress made in satellite altimetry in the following years. The first studies using global ocean satellite altimetry data (conducted from one satellite) allowed the conclusion of westward propagating mesoscale variability, associated mainly with free, linear Rossby waves [Le Traon, 1992;Chelton and Schlax, 1996]. Simultaneously,Chelton and Schlax [1996] pointed out that the observed westward drift is twice as fast as the predicted drift from the Rossby wave theory [LeBlond and Mysak, 1978]. In years to come, theories on Rossby wave propagation were adapted and extended with e.g. bathymetric effects or the vertical shear in background flow, which led to at least some harmonization of observations and theory [Killworth et al., 1997; Dewar, 1998; Szoeke and Chelton, 1999; Tailleux and McWilliams, 2001; LaCasce and Pedlosky, 2004]. However, the observed propagation velocity remained faster than predicted by theory. Other observations showing only little evidence of dispersion [Chelton et al., 2003] or small meridional deflections [Challenor et al., 2001] were also not in line with the Rossby wave theory. With increased resolution of the global satellite monitoring in the early 2000s, obtained from merging two simultaneously operating satellite altimeters, it became evident that sea sur- face height (SSH) variability consists largely of coherent isolated nonlinear mesoscale vortices (eddies) and not linear Rossby waves [Chelton et al., 2007]. These eddies could be separated in cyclones (clockwise surface rotation) and anticyclones (anticlockwise surface rotation). The dominance of eddies explained the observed weak dispersion [Chelton et al., 2003] as the shape of eddies remains rather constant during their propagation. Hence, the energy at every wave- number propagates at the same speed i.e. non-dispersively [Chelton et al., 2007]. The observed small meridional deflections could be explained by a combined consequence of theβ effect and self-advection of large nonlinear eddies [McWilliams and Flierl, 1979; Cushman-Roisin et al., 1990; Early et al., 2011]. The effect of poleward/equatorward meridional deflection of cyclo- nes/anticyclones could also be verified in subsequent observational studies on regional [Morrow
1.3 Observations of mesoscale eddy activity
et al., 2004] and global scale [Chelton et al., 2011b].
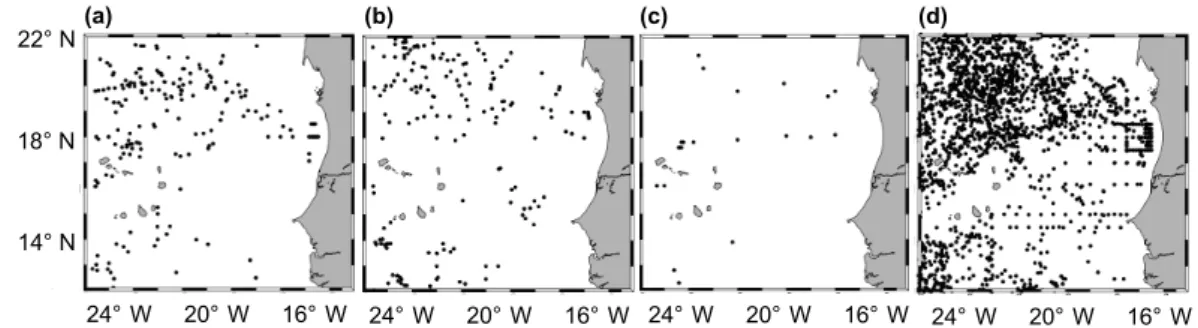
Due to improved satellite observations and the ability of global ocean models to resolve the mesoscale eddy field in the following years, various studies have identified and tracked eddies based on mapped sea level anomaly (SLA) data using a variety of different automatic eddy identification techniques. Algorithms are based on the Okubo-Weiß parameter [Isern-Fontanet et al., 2003; Chelton et al., 2007], the skewness of the relative velocity [Niiler et al., 2003], criteria based on sea-level contours [Fang and Morrow, 2003; Chaigneau and Pizarro, 2005;
Chelton et al., 2011b;Faghmous et al., 2015], wavelet decomposition [Lilly et al., 2003], geometric criterion [Nencioli et al., 2010; Souza et al., 2011], or the segmentation of SLA patterns [Wu, 2014]. In fact, many studies use a combination of different methods. Depending on the chosen method and the individual adjustment of parameters, the number of eddies and their associated properties can vary largely.
However, all of these studies show that eddies are a ubiquitous part of the ocean circulation (e.g. Fig. 1.4ab). In addition, the studies agree on common characteristics of eddy propagation describing a general westward propagation of all eddies due to the β-effect [Cushman-Roisin et al., 1990]. Exceptions are regions of strong mean eastward currents such as the Kuroshio region [Isoguchi and Kawamura, 2003], the ACC region [Hughes et al., 1998; Fu, 2009] or the Gulf Stream region [Brachet et al., 2004], where eddies are advected to the east. A global analysis of first eddy detections for long-lived eddies (lifetime>4 months) shows that eddy generation hot spots are strong western boundary currents, the ACC, as well as defined regions along the eastern boundaries of the ocean basins and near bathymetric gradients [Chelton et al., 2011b, Fig.1.4a].
These eddy hot spots result in a few distinct and observable eddy corridors, which bring some regularity into the chaotic eddy behavior [e.g. Calil et al., 2008; Sangr`a et al., 2009]. However, considering all long-lived eddies (lifetime >4 months) 6% more cyclones than anticyclones are identified globally, whereas anticyclones tend to propagate over larger distances and have a longer lifetime [Chelton et al., 2011b]. This phenomenon could be verified in other observational studies [e.g. Chaigneau et al., 2009] and was theoretically proposed by Cushman-Roisin et al.
[1990]. The latter study shows that cyclones show a higher tendency for self-destruction and anticyclonic eddies are more robust and merge more freely.
The results of [Chelton et al., 2011b, Fig.1.4] indicate that identification and tracking of eddies from satellite data is difficult in the equatorial band due to fast propagation speeds, weaker nonlinearity and large spatial scales of eddies associated with the largeRd in that region. Here, linear Rossby wave signals a more dominant than coherent mesoscale eddies.
A consistent picture is obtained when comparing the global map of EKE [Stammer and Wunsch, 1999] and the global map of the amplitudes of long-lived eddies analyzed by [Chelton et al., 2011b, Fig.1.4c]. It can be shown that eddies have larger amplitudes when they are generated in the vicinity of strong currents like the western boundary currents or along the ACC. The mean eddy radius (Fig.1.4d) and the nonlinearity of the long-lived eddies observed byChelton et al.[2011b]
decreases with latitude, similar to the Rd. However, at mid to high latitudes the mean eddy radius is much larger than the Rd. Consequently, at the mid to high latitudes band the eddy energy is most likely injected into the large-scale flow, following the surface quasi geostrophic

![Figure 1.2: a) Map of the ETNA, where colored contours indicate the oxygen minimum in the upper 200 m (in µmolkg −1 ) as obtained from the MIMOC climatology [Schmidtko et al., 2013]](https://thumb-eu.123doks.com/thumbv2/1library_info/5482504.1684754/12.892.121.732.161.398/figure-colored-contours-indicate-minimum-obtained-climatology-schmidtko.webp)