Study of the ATLAS MDT Spectrometer using High Energy CERN combined Test
beam Data
C. Adorisio
f, G. Aielli
k, Th. Alexopoulos
r, M. Alviggi
h, C. Amelung
b, Ch. Anastopoulos
ah, G. Avolio
f,5, R. Avramidou
m,5, K. Bachas
ah, P. Bagnaia
j, R. Ball
m, M. Barisonzi
o, A. Baroncelli
`, M. Barone
c, F. Bauer
v,1, M. Bellomo
i, Y. Benhammou
z, J. Bensinger
a, M. Beretta
c,
R.M. Bianchi
`,6, M. Bianco
g, C. Bini
j, G. Bobbink
o, A. Borisov
u, H. Boterenbrood
o, I. Boyko
d, P. Branchini
`, E. Brambilla
g, G. Brandenburg
ad, U. Bratzler
aa, S. Bressler
y,
G. Brouwer
o, M. Cambiaghi
i, V. Canale
h, M. Caprio
h, R. Cardarelli
k, F. Cerutti
b,7, J. W. Chapman
m, G. Chelkov
d,
L. Chevalier
v, G. Chiodini
g, M. Cirilli
b,9, R. Coco
af, M. Curatolo
c, T. Dai
m, R. De Asmundis
h, D. Dedovich
d,
M. Della Pietra
h, D. Della Volpe
h, G. DeZorzi
j,
A. Di Ciaccio
k, A. DiDomenico
j, S. Di Luise
`, A. Di Simone
k, M. Dris
r, A. Dushkin
a, J. Ernwein
v, B. Esposito
c, E. Etzion
z, R. Fakhrutdinov
u, S. Falciano
j, D. Fassouliotis
s, R. Ferrari
i,
A. Formica
v, C.Fukunaga
aa, G. Gaudio
i, Ev. Gazis
r, P.-F. Giraud
v, E. Gorini
g, F. Grancagnolo
g, J. A. Gregory
m,
H. Groenstege
o, J. Guimaraes da Costa
ad, C. Guyot
v, A. Harel
y, R. Hart
o, K. Hashemi
a, S. Hassani
v, G. Herten
ac,
S. Horvat
n, P. Hurst
ad, R. Ichimiya
q, P. Iengo
h, M. Ikeno
p, P. Ioannou
s, M. Iodice
`, M. Ishino
e, H. Iwasaki
p, Y. Kataoka
e,
A. Khodinov
ag, A. Konig
ai, O. Kortner
n, S. Kotov
n, C. Kourkoumelis
s, A. Kozhin
u, A. Krepouri
ah, H. Kroha
n, Z. Krumshteyn
d, H. Kurashige
q, U. Landgraf
ac, F. Lacava
j,
E. Lan¸con
v, A. Lanza
i, J.-F. Laporte
v, D. Lellouch
ab, D. S. Levin
m, L. Levinson
ab, B. Liberti
k, R. Lifshitz
y, F. Linde
o, C. Luci
j, N. Lupu
y, G. Maccarrone
c, T. Maeno
b,
K. Mair
b, S. Maltezos
r, A. Manz
n, M. Marchesotti
b,11,
ATL-MUON-PUB-2008-005
08 April 2008E. Meoni
f, G. Mikenberg
ab, W. Mohr
ac, S. Mohrdieck-Moeck
n, K. Nagano
p, R. Nicolaidou
v,2, K. Nikolaev
d, K. Nikolopoulos
s,
A. Nisati
j, H. Nomoto
e, J. Oliver
ad, D. Orestano
`, L. S. Osborne
af, A. Ouraou
v, S. Palestini
b, E. Pasqualucci
j,
A. Passeri
`, F. Pastore
j, S. Patricelli
h, R. Perrino
g,
Ch. Petridou
ah, F. Petrucci
`,3, S. Podkladkin
g, A. Policicchio
f, D. Pomarede
v, P. Ponsot
v, L. Pontecorvo
j, M. Primavera
g,
D. Rebuzzi
i,10, R. Richter
n, A. Rimoldi
i, S. Rosati
b,4,8, J. Rothberg
w, H. Sakamoto
e, D. Salvatore
f, D. Sampsonidis
ah,
R. Santonico
k, O. Sasaki
p, A. Schricker
a, S. Schuh
b, P. Schune
v, M. Shoa
ab, N. Skvorodnev
a, K. Sliwa
x,
E. Solfaroli Camillocci
k,8, S. Spagnolo
g, L. Spogli
`, E. Strauss
ag, Y. Sugaya
t, S. Tanaka
p, S. Tarem
y, F. E. Taylor
af, S. Todorova
x, I. Trigger
b,12, I. Tsiafis
ah, G. Tsipolitis
r, Ch. Valderanis
ah, P. Valente
j, W. Vandelli
i,5,
H. van der Graaf
o, R. Vari
j, S. Veneziano
j, A. Ventura
g, S. Ventura
c, J. Vermeulen
o, S. Vlachos
r, M. Vreeswijk
o,
Y. Yasu
p, H. Wellenstein
a, P. Werneke
o, T. Wijnen
ai, M. Wolter
x, J. Wotschack
b, M. Woudstra
ae, F. Zema
f,5, Z. Zhao
m, A. Zhemchugov
d, B. Zhou
m, S. Zimmerman
aca
Brandeis University, Mailstop 057, 415 South Street, Waltham, MA 02454, USA
b
CERN, CH-1211 Gen`eve 23, Switzerland
c
INFN Laboratori Nazionali di Frascati, via Fermi, 40, I-00044, Frascati, Italy
d
Joint Inst. for Nuclear Research (JINR), 141980, Dubna, Moscow Region, Russia
e
ICEPP, University of Tokyo, 7-3-1 Hongo, Bunkyo-ku, Tokyo 113-8654, Japan
f
Universit` a della Calabria and INFN, Cosenza, p. Bucci, I-87036 Arcavacata di Rende (Cosenza), Italy
g
Universit` a del Salento and INFN, Lecce, via Arnesano, 73100 Lecce, Italy
h
Universit` a di Napoli ”Federico II” and INFN, Napoli, via Cintia, I-80126, Napoli, Italy
i
Universit` a di Pavia and INFN, Pavia, via Bassi, 6, I-27100, Pavia, Italy
j
Universit` a di Roma La Sapienza and INFN, Roma, p.le Moro 2, I-00185, Roma, Italy
k
Universit` a di Roma Tor Vergata and INFN, Roma 2, v. Ricerca Scientifica 1,
I-00133, Roma, Italy
`
Universit` a di Roma Tre and INFN, Roma Tre, via della Vasca Navale, 84, I-00146, Roma, Italy
m
Michigan University, Ann Arbor, MI 48109, USA
n
Max-Planck-Institut f¨ ur Physik, F¨ ohringer Ring 6, 80805 M¨ unchen, Germany
o
Nikhef National Institute for Subatomic Physics, and University of Amsterdam, Kruislaan 409, P.O. Box 41882, NL-1009 DB Amsterdam, The Netherlands
p
High Energy Accelerator Res. Organ. (KEK), 1-1 Oho, Tsukuba, Ibaraki 305-0801 Japan
q
Kobe University, 1-1 Rokkodai-cho, Nada-ku, Kobe 657-8501 Japan
r
National Technical University Athens, Zografou Campus, GR-157, 80 Zografou, Greece
s
University of Athens, 15701 Ilissia, Greece
t
Research Center for Nuclear Physics, Osaka University, Osaka, Japan
u
Institute for High Energy Physics (IHEP), Pobeda str. 1, 142281, Protvino, Moscow Region, Russia
v
Dapnia, CEA - Saclay, F-91191 Gif sur Yvette Cedex, France
w
University of Washington, 3910 15th Ave. NE, Seattle, WA 98195-1560, USA
x
Tufts University, Medford, MA 02155, USA
y
Technion - Israel Institute of Technology, Haifa 32000, Israel
z
Tel Aviv University, P.O. Box 39040, Tel Aviv 69978, Israel
aa
Tokyo Metropolitan University, 1-1 Minami-Osawa, Hachioji-shi Tokyo, 192-0397 Japan
ab
Weizmann Institute of Science, P.O. Box 26, Rehovot 76100, Israel
ac
University of Freiburg, Fakult¨ at f¨ ur Physik, Hermann-Herder-Str. 3, 79104 Freiburg i. Br., Germany
ad
Harvard University, LPPC, 18 Hammond Street Cambridge, MA 02138, USA
ae
Univ. of Massachusetts, Department of Physics 1126 Lederle Graduate Research Tower (LGRT) Amherst, MA 01003-9337 USA
af
Massachusetts Institute of Technology, LNS, 77 Massachusetts Avenue, Cambridge, MA 02139-4307, USA
ag
Physics and Astronomy, SUNY, Stony Brook, NY 11794-3800, USA
ah
Department of Physics, Aristotle University of Thessaloniki, 54124, Thessaloniki, Greece
ai
Radboud University Nijmegen/Nikhef, Dept. of Exp. High Energy Physics,
Toernooiveld 1, NL - 6525 ED Nijmegen , The Netherlands
Abstract
In 2004, a combined system test was performed in the H8 beam line at the CERN SPS with a setup reproducing the geometry of sectors of the ATLAS Muon Spec- trometer, formed by three stations of Monitored Drift Tubes (MDT). The full AT- LAS analysis chain was used to obtain the results presented in this paper. The basic design performances of the Muon Spectrometer were verified. The stability of MDT calibration constants, the alignment system using optical devices and high energy tracks, as well as the intrinsic sagitta resolution of the Muon Spectrometer were studied and found to agree with expectations. The reconstruction of muon tracks using the combined information from both the Inner Detector and the Muon Spectrometer are also presented.
1
Corresponding author. E-mail address : Florian@hep.saclay.cea.fr
2
Corresponding author. E-mail address : Rosy.Nicolaidou@cern.ch
3
Corresponding author. E-mail address : petrucci@roma3.infn.it
4
Corresponding author. E-mail address : Stefano.Rosati@roma1.infn.it
5
Now at CERN, CH-1211 Gen`eve 23, Switzerland
6
Now at University of Freiburg, Fakult¨at f¨ ur Physik, Hermann-Herder-Str. 3, 79104 Freiburg i. Br., Germany
7
Now at INFN Laboratori Nazionali di Frascati, via Fermi, 40, I-00044, Frascati, Italy
8
Now at Universit`a di Roma La Sapienza and INFN, Roma, p.le Moro 2, I-00185, Roma, Italy
9
Now at Michigan University, Ann Arbor, MI 48109, USA
10
Now at Max-Planck-Institut f¨ ur Physik, F¨ohringer Ring 6, 80805 M¨ unchen, Ger- many
11
Now at Universit`a di Pavia and INFN, Pavia, via Bassi, 6, I-27100, Pavia, Italy
12
Now at TRIUMF, 4004 Wesbrook Mall, Vancouver, BC, V6T 2A3 Canada.
1 Introduction
The Muon Spectrometer [1] of the ATLAS detector was designed to pro- vide a stand-alone trigger for muons with transverse momentum of several GeV/c as well as a measurement of final state muons with a momentum reso- lution of about 3% over most of the momentum range. Tracking in the Muon Spectrometer is based on the magnetic deflection of muon tracks in large su- perconducting air-core toroid magnets. Over the range |η| ≤ 1.0, magnetic bending is provided by the large barrel toroid which provides a field integral
R
Bdl between 2 and 6 T m. For 1.4 ≤ |η| ≤ 2.7 muon tracks are bent by two smaller end-cap toroid magnets contributing between 4 and 8 T m. The bending in the region 1.0 ≤ |η| ≤ 1.4, usually referred to as the transition region, is provided by a combination of barrel and end-cap fields.
The Muon Spectrometer is a 4π detector, which consists of four detec- tor technologies. Over most of the spectrometer acceptance, Monitored Drift Tube (MDT) chambers are used for the precision measurement of muon tracks with Cathode Strip chambers (CSC) deployed in the high rapidity region (2.0 ≤ |η| ≤ 2.7) of the first detection layer of each end-cap. The MDTs are made of gas filled aluminum tubes with a central wire and measure charged particle tracks with an average spatial resolution of 80 µm. Resistive Plate Chambers (RPC) provide the trigger for muons in the barrel region, whereas Thin Gap Chambers (TGC) serve the same purpose in the higher background region of the end-cap. The signals from the trigger chambers are digitized on the detector and sent to ASIC-based coincidence matrix boards. These boards perform the functions needed for the trigger algorithms and apply p
Tcuts according to preset thresholds. The trigger chambers are also used to provide the coordinate along the drift tubes (the second coordinate), which is not measured by MDT chambers.
The determination of the muon momentum is based on the measurement of three points along the track of the particle deflected in the magnetic field.
Each of the three stations
13in the muon system provides one measurement point along the track. It is convenient to express the curvature in terms of the sagitta, which is the distance from the point measured in the middle station to the straight line connecting the points in the inner and outer stations. The precision of the sagitta measurement is a direct measure of the precision of the muon momentum.
A muon of momentum 1 T eV /c has a sagitta of about 500 µm in the bar-
13
An ATLAS muon station is made of 6 to 8 layer of Monitored Drift Tubes (MDT)
for precision measurements, which in addition can be equipped with trigger cham-
bers: Resistive Plate Chambers (RPC) in the barrel, Thin Gap Chambers (TGC)
in the end-cap. The MDTs (and CSCs) provide a number of hits reconstructed as
a segment.
rel. The target momentum measurement precision of ∆p
T/p
T= 10% requires a sagitta precision of 50 µm. The actual precision depends not only on the local precision of the points measured in the muon chambers, but also on the relative positions of the three stations. These positions need therefore to be known with an accuracy that is comparable to the individual chamber point measurement precision. The total contribution of the chamber point measure- ments to the sagitta precision should be less than 40 µm. Permanently active alignment systems are needed to continuously monitor the chamber positions and deformations with the needed accuracy.
The reconstruction of muon tracks is also affected by the accuracy of the relation between drift times and impact radii in the tubes (r(t) in the follow- ing). A 30 µm uncertainty in the knowledge of this relation combined with an average single-wire resolution of 80 µm has an effect on the momentum resolution for η ≤ 1.4 (the barrel region) which varies between 1% and 10%
for muon momenta in the range 100 to 1000 GeV /c. For η > 1.4 (the end-cap region) the effect on momentum resolution varies between 1% and 6% for the same muon momenta range.
A large test stand of ATLAS detectors, including all the Muon Spectrom- eter components was operated at CERN in the H8 beam line from 2000 to 2004. A detailed description of the system test performed at the H8 beam line during 2003 can be found in [2]. The setup exposed to the beam repre- sented about 1 % of the ATLAS detector including two sectors of the Muon Spectrometer for both the barrel and the end-cap, Inner Tracking detectors [3], modules of the hadronic calorimeter [4] and of the electromagnetic Liq- uid Argon calorimeter [5]. Large samples of events were collected with various operating conditions and layouts. Data were taken either independently with the various subdetectors (non-combined runs) or using the same trigger and DAQ (combined runs). A particle beam of momentum up to 350 GeV/c from the SPS accelerator was used to study various aspects of the spectrometer. In this paper the performance of the muon system and its components during the 2004 H8 test period is reported. The results are based on tools and analysis that are reported in detail in the following references [6],[7],[8],[9] and [10].
2 The experimental setup
The setup of the 2004 ATLAS System Test consists of four parts: the Inner Detector, the Calorimeters, the Muon Detectors and the beam line elements.
In the Combined Test Beam (CTB), the Inner Detector consisted of three lay-
ers of silicon pixel modules, four layers of two silicon strip detectors (SCT) and
two wedges of the straw drift tube detector (TRT). The Liquid Argon (LAr)
electromagnetic calorimeter module and the hadronic calorimeter (TileCal)
modules were both placed on a table which could be rotated and translated
to expose specific cells to the beam. The dump between H8A and H8B was a 3.2 m long block of iron along the beam direction with a transverse area of 800 mm
2. It was kept in place for most of the data taking. A detailed descrip- tion of the setup can be found in [2].
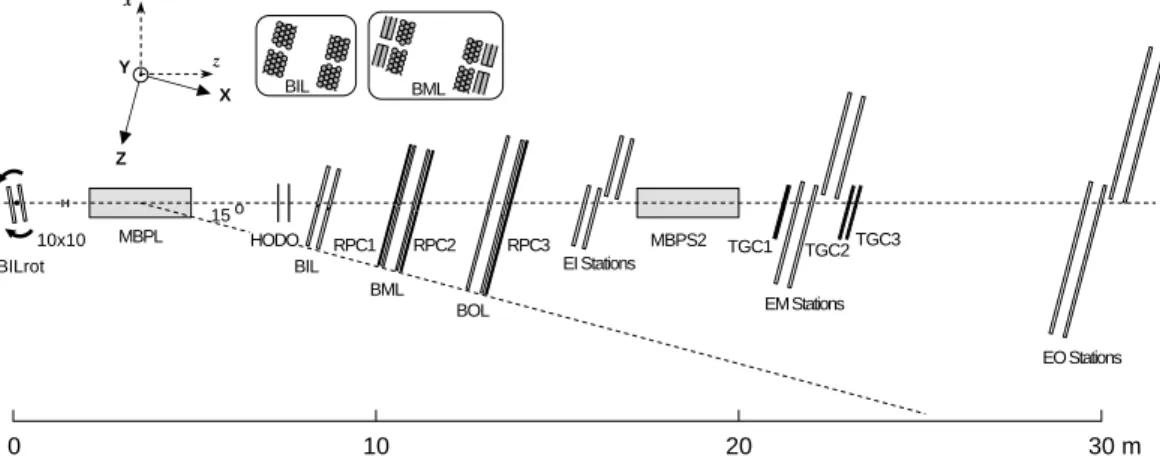
The H8 muon stand, as shown in Fig. 1, consists of two parts, a barrel stand and an end-cap stand. The barrel setup reproduced one ATLAS barrel sector with its MDT [11] and RPC [12] stations. It consisted of six MDT chambers, two of each type: inner (BIL), middle (BML) and outer (BOL) chambers, fully instrumented with Front End electronics (FE) [13] read out with a Muon Readout Driver (MROD) [14] and fully equipped with an optical alignment system. Each MDT triplet (BIL, BML, BOL) formed an ATLAS-like tower.
Tubes of the barrel sector are vertical. In the barrel setup there were six RPC doublets: four middle chambers (BML) and two outer chambers (BOL).
In the end-cap stand, which reproduced a muon spectrometer end-cap sec- tor, there were 6 MDT chambers (Small and Large): two inner (EI), two mid- dle (EM) and two outer (EO). As in the barrel they were fully instrumented with FE and read out through one MROD. The chambers were equipped with calibrated sensors for absolute alignment. Two alignment bars, discussed in section 3.2.3, were part of each End Cap station, in order to perform a test of all functionalities of the alignment system. For triggering in the end-cap, there were three TGC units [15] : one triplet and two doublets fully instrumented with on-chamber electronics.
Two additional muon stations were installed in the test stand. One inner station (called BILrot in the following) was placed on a remotely operated rotating support. The support allowed the rotation of the chamber of up to
±15 degrees around the vertical axis of the chamber which made it possible
10x10 HODO
BIL BML
BOL RPC2
RPC1 RPC3
MBPL
EI Stations
EM Stations
EO Stations TGC1 TGC2TGC3
15 o Z
X Y
BIL BML
0 10 20 30 m
BILrot x
z
MBPS2
Fig. 1. Schematic view of the 2004 test beam setup in the H8 area. From left to
right: the BIL rotating chamber, 10 x 10 trigger, the MBPL bending magnet, the
hodoscope trigger, the barrel BIL, BML, BOL stations equipped with the trigger
RPC, the end-cap EI stations, the MBPS2 bending magnet, the first TGC trigger
chamber, the end-cap EM stations, the other two TGC chambers and and the
end-cap EO stations. The coordinates in capital letters are used by the alignment
system; the ones in small letters are used by the offline reconstruction software.
to enlarge the angular range of muon tracks for the calculation of the space versus time relation (r(t) in the following). One inner station (BIS) was placed in front of the Liquid Argon Calorimeter to measure accurately the particle trajectory at the entrance of the calorimeter, in order to study in detail the response of the calorimeter for different impact points within the electrode structure.
Three bending magnets, namely MBPSID, MBPL, and MBPS2, were used during different periods. Both the pixel and the SCT detectors were located inside the magnetic field of the MBPSID magnet not shown in Fig. 1, whereas the TRT was installed outside the magnet. The orientation of the field was horizontal to deflect particles vertically, a geometry which emulates the layout in ATLAS. The MBPL magnet was installed in front of the muon barrel stand and was used to bend tracks horizontally, in the plane perpendicular to the MDT tubes, in order to move the beam spot over the muon chambers, emu- lating tracks of different polar angle, and allowing a more complete validation of the system. This magnet was operated with various currents and both po- larities. Finally, the MBPS2 magnet was installed between the EI and the EM stations of the end-cap muon stand for muon momentum measurements.
Two coordinate systems are used throughout this paper and are identified by capital and small letters as shown in Fig. 1. In the first one (used by the alignment system), the X-axis is along the H8-beam, the Z-axis is horizontal and the Y-axis is vertical to form an orthogonal reference frame. In the sec- ond one (used by the offline reconstruction software), the z-axis is along the H8-beam and the x-axis is horizontal. The origins of the systems (perigee) are on the axis of the H8 beam-line, at the entrance surface of the Inner Detector magnet (MBPSID). It was chosen as similar as possible to the ATLAS refer- ence system for the barrel stand.
Two trigger systems were available: a small area trigger given by the coin- cidence of two (10 x 10) cm
2scintillators centered on the beam line and a large area trigger of (60 x 100) cm
2, called hodoscope trigger, given by the coinci- dence of the signals from two planes of six scintillator slabs of (10 x 100) cm
2each and the small area trigger in negative logic.
The monitoring of the parameters of the detectors working conditions was realised via the Detector Control System (DCS) [16]. This included the set- tings of the programmable parameters of the front-end electronics and the monitoring of the environmental parameters. The discriminator threshold was set between 34 and 52 mV in different runs. The nominal discriminator thresh- old of 40 mV corresponded to about 16 primary electrons. In particular the temperature of each chamber was measured at regular time intervals at several locations by means of temperature probes. The measurements were recorded in the Conditions Data Base.
The MDT gas mixture was the nominal [17] Ar(93%) and CO
2(7%) at
3 bar absolute pressure. The gas gain was set to 2 · 10
4.
3 Data analysis
Data samples corresponding to different operating conditions were taken with the muon system only (non-combined runs) during summer 2004, and later during fall together with the Tile and LAr calorimeters (combined runs).
In the runs taken with the (10 x 10) cm
2trigger, the beam spot illuminates three tubes and was observed to be stable, from summer to fall, within ap- proximately one tube width. For some runs, a scan of beam momentum was performed between 100 and 250 GeV /c, by varying the settings of the H8 beam-line. These nominal values refer to the beam momentum at the H8 en- trance, before the calorimeters and the beam dump. Alignment studies related to controlled movements of the MDT chambers were performed with runs from both data taking periods. The data from summer were used for testing the alignment with tracks and for determining the efficiency of MDTs for various beam momenta and signal thresholds. The effect of placing material in front of a barrel MDT was studied with the fall data.
3.1 Calibration procedures
A sequence of calibrations have to be performed to reconstruct tracks from raw MDT data (i.e. tube identifiers and TDC information). The first step is the determination of the t
0for each tube defined as the drift time associated to a particle crossing the tube at a distance r=0 from the wire and representing a relative delay between different channels. This value has to be subtracted from the time measurements. t
0is computed using a fit procedure to the drift time distributions which yields also other parameters of the drift time distribution such as the maximum drift time t
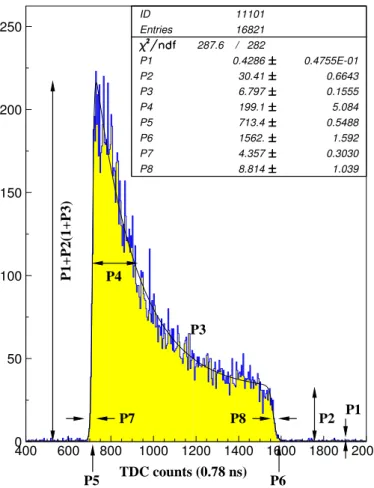
1. This first procedure does not require any track reconstruction. Drift times are expressed in units of TDC counts, one TDC count corresponding to 25 ns/32 = 0.78125 ns. The drift time distribution of each MDT tube is fitted with an analytic function which consists of two distinct Fermi Dirac functions describing the leading edge, the trailing edge and an exponential function for the central part. The analytic expression of the function is given below:
f (t) = p
1+ p
2
1 + p
3e
−t−p5 p4
1 + e
−t−p5
p7
1 + e
t−p6 p8
(1)
The parameter p
1is the uncorrelated (assumed flat) background, p
2, p
3and
p
4describe the shape of the central part of the distribution, p
5is an estimate
of t
0of that given tube, p
6is the maximum drift time, p
7and p
8describe the
leading and trailing edges. As an example, a typical drift-time distribution and
P2 P1 P4
P5 P6
P7 P8
P3
P1+P2(1+P3)
TDC counts (0.78 ns)
Fig. 2. Typical drift time distribution at nominal operating conditions. The fitted Classic
t0function described in the text is also shown.
the corresponding fit is shown in Fig. 2. p
5does not correspond to the start of the physical drift time window but it is close to the half height position of the leading edge and is thus significantly shifted to later times with respect to the start of the physical drift time window. However, as all drift times are related to this value, determined for each tube, the systematic shift will be reabsorbed in the definition of the r(t) relation.
The leading edge slope and p
5are observed to be correlated. This observa- tion suggests that the start of the MDT drift distribution is better identified by a combination of the two parameters. The use of Monte Carlo generated samples shows that the optimal combination is t
0= p
5− 1.5 × p
7. This defini- tion will be used in the rest of the paper. The algorithm gives a resolution of 0.75 TDC counts for samples of 5k events and 0.25 TDC counts for samples of 50k events.
A procedure similar to that used to find the best t
0indicator has been
used to study the measurement of the drift spectrum length t
max. The Fermi
Dirac function which describes the trailing edge of the drift time spectrum is
characterized by a p
6value and by a trailing edge slope p
8. As in the previous
case the drift spectrum length t
max, defined to be t
1− t
0, has been studied
and found to reach the minimum spread for a value of the correction factor which is equal to 1.2. A resolution of 1.9 and 1.0 TDC counts is observed for sample sizes of 5k and 50k events, respectively.
The drift time distribution depends on a number of environmental param- eters like pressure, temperature, B field, gas composition. At H8 there was no B field inside the MDT chambers, the pressure was expected to be stable, the temperature was continuously monitored. The effects of temperature variation are studied in this paper.
Once the drift time has been computed, it is converted into a drift radius assuming an r(t) relation. This relation is determined by an iterative pro- cedure, autocalibration, that minimizes the space residuals in a straight line fit to the drift circles of a candidate track. The procedure starts with a trial r(t) relation to convert the drift time measurements into drift radii that are used in the track fit. The mean value of the residuals, as a function of r, are then used to obtain the first-order correction to the r(t) relation. After a few iterations the minimization procedure converges to a stable solution. As an estimator of the stability of the solutions the mean square correction, defined as ∆
2k=
Pj(d
2kj)/N , is used. In this expression (d
2kj) is the mean value of the residuals in the time bin j for the k
thiteration and N is the number of bins. A good solution corresponds to a value of ∆ below 20 microns. The mean value of the distribution of the residuals and the number of iterations are figures of merit in evaluating the overall performance of a chamber. All the calibration analysis presented in this work was performed using the Calib program [18].
Comparison between data and the result of the simulation package GARFIELD [19], that describes in details the response of gaz ionization de- tectors, are discussed in section 4.1.
3.2 Alignment procedures
3.2.1 Alignment devices
The ATLAS muon alignment system [20] is based on optoelectronic sensors that measure the positions and the deformations of the MDT chambers. In addition, temperature sensors are used to correlate chamber expansions with temperature. In the barrel part, the optical sensors are placed on the chambers to directly determine their alignment. In the end-cap, chambers are aligned relative to a set of aluminum bars [21] whose positions and deformations are monitored by optical and temperature sensors.
Two different optical systems are used in the ATLAS alignment: RASNIKs
and BCAMs/SaCams. Both systems are based on the principle of a three-
point straightness monitor: an optoelectronic image sensor (CCD or CMOS)
monitors the position of an illuminated target through a lens. The sensor
image is analysed online and converted into four parameters characterising
the deviation from the nominal geometry: two translations perpendicular to the optical axis, the rotation around and the longitudinal position along the axis, the latter being derived from the optical magnification.
In the RASNIK [22] system, an image sensor monitors through a lens an illuminated target carrying a chessboard-like pattern imprinted on a mask. For a symmetric RASNIK with the lens halfway between image sensor and mask, a transverse resolution of 1 µm and a magnification resolution of 2 × 10
−5have been obtained.
The BCAM [24] is a camera consisting of a CCD image sensor which monitors the position of a laser diode through a lens. The BCAM housing also contains a set of two or four laser diodes which can be used as targets by another BCAM. BCAMs are mostly used in pairs, facing each other. The image sensor is placed close to the focal plane of the lens (76 mm), while the target with the laser diodes is placed at a distance of 0.5 m to 16 m. The image of a laser diode on the CCD appears as a circular spot.
BCAMs achieve a relative resolution of 5 µrad for a target distance of 16 m. If the target consists of two or more laser diodes with a known separation, relative angles can be extracted, which yield magnification and rotation around the optical axis. If BCAM’s are used in pairs, the absolute angular position of the partner can be determined with 50 µrad accuracy.
Like the BCAM, the SaCam [23] consists of a camera with an image sensor and a lens at fixed distance. The target consists of four back-illuminated holes, covered by a light diffuser. The lens is mounted at distances ranging from 25 mm to 80 mm, depending on the distance between image sensor and target.
A relative resolution of 5 µrad has been achieved with the SaCam, a result similar to that of the BCAM.
3.2.2 Barrel alignment setup
The corner stone of the barrel alignment system are optical lines called the projective lines, pointing toward the interaction point and connecting the three layers of BIL, BML and BOL chambers. The used technology is the RASNIK system, where the mask is placed on BIL, the lens on BML and the image sensor on BOL chambers. In ATLAS, the 6 MDT towers of one half sector will be typically equipped with 8 projective lines. In H8 the 2 MDT towers were equipped with 8 projective line, leading to an overconstrained system which permits to better study systematic effects.
Besides the projective system, other systems used in ATLAS were studied.
These systems are: (1) the inplane system, which monitors deformation of
the mechanical structure supporting the multilayer, (2) the axial and praxial
system which permits to monitor the translation/orientation of 2 adjacent
chambers in one layer, (3) the reference system which permits to monitor the
position of the chambers relative to a reference system connected to the coils
of the barrel toroid. In H8, the reference system was mounted on a stable
external structure.
3.2.3 End-cap alignment setup
The alignment strategy used in the barrel would require many projective lines of sight traversing the closed vessel of the end-cap toroidal magnets, which turned out to be impossible. The solution that was adopted is a grid of optically connected alignment bars which are used as precision reference rulers. The bars are equipped with internal RASNIKs and temperature sen- sors to determine their deviations from the initial shape (measured prior to installation with a long range 3D coordinate measuring machine). The spatial relationship between the bars is established by a network of BCAMs on the bars, each measuring the bearing angle of laser diodes on BCAMs on other bars. The chambers in turn are referenced to the alignment grid using the proximity system, where cameras on chambers view RASNIK masks on bars or other chambers, and laser sources on chambers are viewed by BCAMs on bars.
The end-cap setup in H8 corresponds to one octant of an ATLAS end-cap, consisting of six alignment bars and six chambers (two bars and two chambers in each station, EI, EM and EO), and a complete set of alignment sensors.
3.2.4 Alignment software
Two geometry reconstruction software have been developed, called ASAP
14[25] for the Barrel and ARAMyS
15[26] for the end-cap. The aim of these 2 packages is to convert the optical sensor measurements into MDT positions, ro- tations and internal deformations, using standard fitting methods. The main feature of both software packages is their precise description of the optical elements within the barrel or End-cap detector, taking into account all the individual sensor calibration constants which have previously been measured in the laboratories.
Using the same parameters provided by the online image analysis, two alignment modes are implemented, relative and absolute. In the relative mode, the current positions of the MDT chambers are calculated with respect to ini- tial positions - the reference geometry - previously measured by other means, e.g. with straight tracks. In the more ambitious absolute alignment, the po- sitions of the chambers are estimated using only the current measurements.
This mode requires an accurate calibration of the geometry of all alignment components.
The resulting data is stored in the Conditions Database for later use by the muon tracking software packages. Both alignment procedures are internal
14
ASAP:
Atlas SpectrometerAlignment Program15AlignmentReconstruction and Simulation for theAtlas Myon Spectrometer
to either the barrel or the end-cap part of the Muon Spectrometer; in both the H8 setup and in ATLAS no optical link exists between the Muon Spectrometer and other detectors. Particle tracks will be used for aligning, e.g., the Inner Detector and the Muon Spectrometer.
3.3 Data analysis programs
A prototype of the full ATLAS software chain was tested to analyze the data collected in the H8 test-beam. The event reconstruction was performed within the ATLAS offline reconstruction framework ATHENA [27]. The in- puts of the muon reconstruction package are the calibration constants, the alignment corrections, and the magnetic field map. In this framework, the various inputs needed to run the reconstruction packages, are stored in a Conditions Data Base and are fed to the packages through dedicated ATHENA services. During the H8 beam test, the Conditions Data Base was opera- tional only for the alignment corrections.
• The calibration constants (t
0and r(t) relation) needed to make the trans- formation from time to radius for each MDT hit were produced for different configurations of H8 test-beam data; they were written to ASCII files and fed to the reconstruction packages through a dedicated ATHENA service.
• The alignment data, taken asynchronous to the test-beam data every 15 min- utes, were written into the Conditions Data Base and provided the inputs to the alignment reconstruction packages (ASAP and ARAMyS) which were operated outside ATHENA. Using this information, the alignment packages calculated the difference between the nominal detector geometry (provided by the ATLAS muon system data base AMDB ) and the actual geometry.
The results were written back into the Conditions Data Base. A dedicated alignment ATHENA service was retrieving the result of the alignment from the Conditions Data Base to feed it to the reconstruction packages.
• Finally for the magnetic field response a dedicated ATHENA service pro- vided the map of the magnetic field at every point in space.
M uonboy is the track pattern recognition program used in the ATHENA framework for most of the analysis presented in this paper. The pattern recog- nition strategy in M uonboy is to proceed sequentially through the following steps:
• Identification of regions of activity (ROAs), guided by trigger chamber in- formation
• Reconstruction of local straight track segments in each muon station be-
longing to a ROA
• Combination of track segments from different muon stations, to form muon candidate tracks
• Global re-fit of muon track candidates using individual hit information.
Details concerning the algorithm can be found in [1]. The command parame- ters of M uonboy can be set to produce straight track segments only, or they can be set to provide fully reconstructed tracks by performing a full fit, which includes the effects of material traversed. Straight track segments were used in this paper for the alignment studies and for the MDT efficiency analysis, whereas fully reconstructed tracks were used to perform tracking analysis.
The analysis of MDT sagitta resolution described in section 6.2 and 6.3 has been performed using the reconstruction algorithm MOORE in the ATHENA framework. A detailed description of the MOORE algorithm can be found in [28]. The pattern recognition and track reconstruction steps in MOORE can be summarized as follows:
• Track patterns are built in the x-y plane of the ATLAS reference system, starting from RPC/TGC strips measuring φ;
• Track segments in the r-z plane are built from hits in the MDT detectors and combined to φ patterns to build roads of hits; the r-z MDT segments are fitted;
• A track is fitted out of each road found in the event, and accepted if the fit is successful.
3.4 Determination of the intrinsic M DT sagitta resolution
The measured sagitta resolution depends not only on the intrinsic chamber resolution and alignment but also on multiple scattering. A momentum scan is thus needed to disentangle the two contributions. The method is described here. The rotating BIL chamber measures the angle (ϑ
RotBIL) between the z−axis and the muon track upstream of the MBPL magnet (see Fig.1). The barrel chambers measure the same angle for the deflected track downstream of the magnet (ϑ
barrel). The track is computed as the line that connects the two super-points associated with the track segments separately in the BIL and BOL chambers, where the super-point is calculated as the crossing point of the track segment, reconstructed through a linear fit of the chamber hits, at the center of the chamber. Using the difference between these two angles (∆ϑ
B) the beam momentum is calculated through the formula:
p (GeV /c) = 0.3BL (T m)
∆ϑ
B(rad) (2)
where BL is the bending power of the magnetic field, which is known as a
function of the magnet current. As for a given run, the actual orientation of the
rotating BIL chamber and the barrel chambers is not known, the measurement of the deflections ∆ϑ
Bas in (2) has to be repeated with the magnetic field switched off (∆ϑ
0). The final formula is then:
p (GeV /c) = 0.3BL (T m)
(∆ϑ
B− ∆ϑ
0) (rad) (3)
The measurement of the momenta cannot be performed in the same way as in ATLAS, since in the H8 setup the tracks crossing the chambers are straight lines. With this method the muon momentum has been measured using the Muon Spectrometer chambers for the first time.
4 Study of M DT calibration constants
A detailed report on the analysis of MDT calibration constants using test beam data can be found in [6]. While t
maxhas a well known and significant temperature and gas composition dependence, t
0is expected to be almost temperature independent but sensitive to the electronics threshold settings.
The effect of the variation of these environmental parameters on t
0and t
maxwill be studied in sections 4.1 and 4.2 respectively.
4.1 t
0Systematics
The most illuminated tube of each layer of each chamber was used to study the time stability of t
0. The three barrel chambers and three end-cap cham- bers give a total of 40 layers. Trace plots of these tubes are observed to be more scattered in summer than in fall runs due to a significant difference in the average run length. The t
0distribution for each tube and separately for the summer and for the fall, has been constructed and fitted with a Gauss distribution to quantify the stability of the measured t
0values. The fitted rms width has been taken to be a good indication of the stability of tubes. The width of t
0fall data taking period is seen to cluster around a value of about 0.5 TDC counts (0.4 ns) dispersion. The spread of t
0observed during the summer data taking period is larger than in the fall by a factor of about 2 and is again fully understood as being due to a difference in statistics. In particular the t
0average spread observed in the summer and in the fall agrees well with the calculation described in section 3.1 for an average run length of 5k and 10k events, respectively.
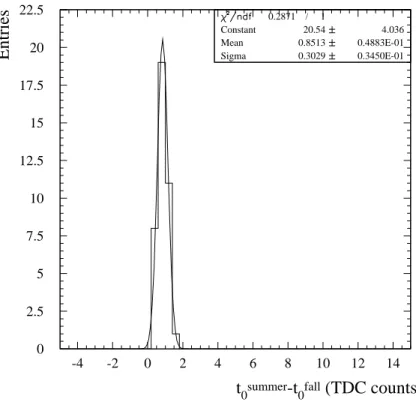
The distribution of the difference of the average t
0value between summer and
fall is shown in Fig. 3. The distribution has been fitted with a Gaussian with
an average value of 0.85 TDC counts (0.66 ns) and a rms width of 0.30 TDC
0 2.5 5 7.5 10 12.5 15 17.5 20 22.5
-4 -2 0 2 4 6 8 10 12 14
0.2871 / 1
Constant 20.54 4.036
Mean 0.8513 0.4883E-01
Sigma 0.3029 0.3450E-01
t
0summer-t
0fall(TDC counts)
Entries
Fig. 3. Distribution of
t0variation between summer and fall.
counts (0.23 ns). This effect has also been studied using GARFIELD [19]. The predicted shift for a temperature difference of 5
oC was found to be 0.6 ± 0.1 TDC counts (∼ 0.47 ± 0.08 ns), in qualitative agreement with experimental findings. A variation of about +5
◦C between summer and fall induces an in- crease of the drift spectrum length (p
6- p
5) which may result in a change of the correlation between p
5and p
7. As a counter-proof no significant shift in the t
0is observed (both in the data and in the simulation) if only the first part of the distribution is fitted using the function of Eq. 1. The observed temper- ature variation of about 5
◦C between summer and fall induces a reduction of the gas density in a regime of constant pressure which accounts for this effect.
At small radii this causes a reduction of the ionization density and thus an increase of the time until the signal crosses the threshold, i.e. t
0. At large radii the reduction of the gas density causes an increase of the drift velocity and a corresponding reduction of the length of the drift time distribution.
The MDT readout electronics has an adjustable discriminator threshold value which affects the value of t
0. Data taken at different thresholds have been used to study the variation of t
0at different electronics thresholds. Since most data were taken at a threshold value of 40 mV, chosen as the standard working point of M DT chambers, the difference t
threshold0− t
40mV0, expected to be the same for all chambers, was chosen to quantify the variation of t
0with threshold. The same sample of well populated tubes in different cham-
-1.5 -1 -0.5 0 0.5 1 1.5 2 2.5
30 32.5 35 37.5 40 42.5 45 47.5 50
Data GARFIELD
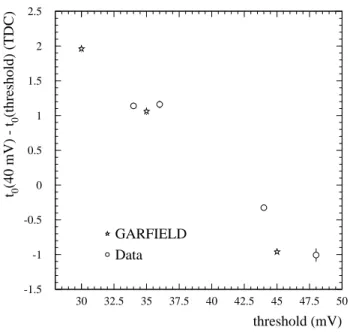
threshold (mV) t0(40 mV) - t0(threshold) (TDC)
Fig. 4. Variation of
t0as a function of threshold.
bers used in the analysis of stability of single t
0’s has also been used to study t
threshold0− t
40mV0. Fig. 4 shows t
40mV0− t
threshold0with respect to t
threshold0in the range between 34 and 48 mV for the rotating BIL chamber. Stars were obtained using GARFIELD at 30, 35 and 45 mV. The agreement between data and simulation is good. As expected the slope of the variation is nega- tive and amounts to about 0.13 ns/mV. The same quantity computed using GARFIELD gives a value of 0.15 ns/mV, in good agreement with data.
4.2 t
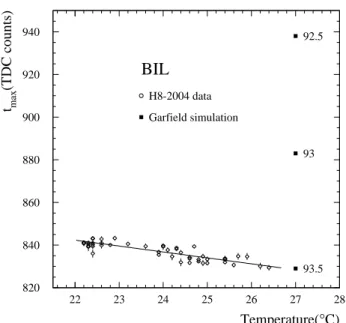
maxtemperature systematics.
While t
0is known to have very little temperature dependence, t
maxis ex- pected to have a significant dependence on temperature. Due to the non neg- ligible systematic temperature difference among the different chambers the comparison of the length of the drift time distribution t
maxof different cham- bers was studied as a function of the chamber temperature. The correlation plot between t
maxand temperature is shown in Fig. 5 for the BIL chamber.
The GARFIELD simulation was used to compute t
maxfor a temperature of
27
◦C and for three different CO
2fractions of the MDT gas and not con-
sidering the presence of other contaminants in the mixture. The point at the
nominal gas composition is observed to disagree with data while a good agree-
ment is observed for a gas composition of about Ar:CO
2of 93.5:6.5. It has to
be observed that while the gas composition is believed to be stable in time,
820 840 860 880 900 920 940
22 23 24 25 26 27 28
Temperature(°C) tmax(TDC counts)
BIL
92.5
93
93.5 H8-2004 data
Garfield simulation
Fig. 5. Observed drift spectrum length temperature dependence for the BIL chamber. GARFIELD simulated points at 27
◦C and for different gas compositions are also shown.
the absolute gas mixture, as produced by the gas system is not accurately known. However, the disagreement can be also explained by the presence of other contaminants as discussed below.
The correlation plot between t
maxand temperature for different chambers was then fitted with a straight line defined as t
max= (T-24
◦C) · slope + t
24max◦C The average value of the distribution of the slope and of t
24max◦for the different chambers has a mean value -(2.5±0.1) ns/
◦C and of 673.9±0.5 ns respectively.
The spread of the two distributions is of 0.4±0.1 ns/
◦C and of 2.0±0.4 ns, re- spectively. The spread of t
24max◦is non negligible and can attributed to different gas properties in the different chambers as discussed in section 4.3.
4.3 Study of r(t) relation.
The r(t) relation depends on pressure, temperature and gas composition.
The gas distribution system of the H8 setup was made of a single gas mixer
which supplies all the chambers. Thus the gas composition (Ar/CO
2percent-
age) is assumed to be the same for all chambers while a difference in gas
contamination (air or water vapor) and in pressure can occur because of leaks
in any gas connection. The only directly measured parameter is the tempera-
ture which changes with time and, at the same time, for the different chambers
because of the different positions. A mean temperature difference of the order
of 5
◦C is observed between summer and fall while a difference of the order of
-0.1 -0.05 0 0.05 0.1
0 200 400 600
time (TDC counts)
δ r (mm)
-0.1 -0.05 0 0.05 0.1
0 200 400 600
time (TDC counts)
-0.1 -0.05 0 0.05 0.1
0 200 400 600
time (TDC counts)
δ r (mm)
-0.1 -0.05 0 0.05 0.1
0 200 400 600
time (TDC counts)
-0.1 -0.05 0 0.05 0.1
0 200 400 600
time (TDC counts)
δ r (mm)
-0.1 -0.05 0 0.05 0.1
0 200 400 600
time (TDC counts)
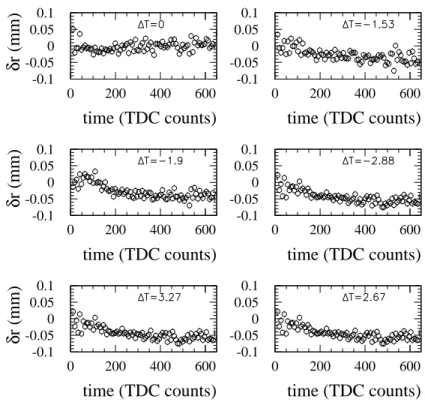
Fig. 6. Temperature effects as measured in the summer as obtained using
BILrotdata for different temperature variations
2
◦C is measured between the coldest and the warmest chamber at the same time.
The effect of temperature variation on the r(t) has already been studied in laboratory tests [29] and presented as difference between two r(t)s as measured at two different temperatures T
0and T . The difference has been observed to vary with the drift time and in particular for a positive temperature difference it is lower than zero for small drift times (lower than approximately 100 TDC counts) and smoothly rising for larger drift times up to a value which proved to scale linearly with the temperature differences as 25 µm/
◦C. In Fig. 6 the r(t) difference as measured in different pairs of runs is shown. These variations, δr(t), can be parametrized with the function:
δr(t) =
T
0+ ∆ T T
0− 1
"
r(t) − t · dr(t) dt
#
(4)
where T
0is the reference absolute temperature, ∆T = T −T
0is the temper-
ature difference, the r(t) function is the one at the reference temperature and
the time derivative of the r(t) function is computed with a fit with Chebytchev
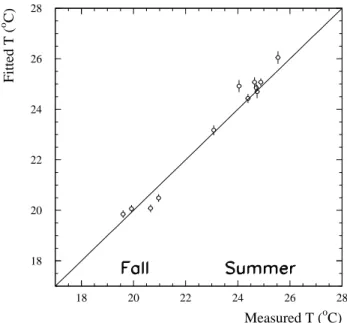
polynomials to the r(t) function at the reference temperature. To check this
parametrization, the parameter ∆T has been determined with a fit to δr(t)
Measured T (oC) Fitted T (o C)
18 20 22 24 26 28
18 20 22 24 26 28
Fig. 7. Correlation plot between temperature as measured with probes and as derived from the variation of the r(t) relation in
BILrotdata.
-0.05 -0.04 -0.03 -0.02 -0.01 0 0.01 0.02 0.03 0.04 0.05
100 200 300 400 500 600
Residuals in Barrel Chambers
Barrel Chambers Barrel Chambers Barrel Chambers
Barrel Chambers time (tdc counts)
residuals (mm)
BOL BML BIL
Barrel Chambers Barrel Chambers Barrel Chambers
Barrel Chambers time (tdc counts)
residuals (mm)
BOL BML BIL
-0.05 -0.04 -0.03 -0.02 -0.01 0 0.01 0.02 0.03 0.04 0.05
100 200 300 400 500 600
Fig. 8. Residuals versus time for barrel chambers and for two different runs as obtained using a temperature corrected r(t) relation extrapolated from
BILrotand compared with the measured temperature changes. This correlation plot
as obtained using runs with a 40 mV threshold, with the BILrot in rotation
by more than 6 degrees and with a number of events larger than 20k, is shown
in Fig. 7. It has to be underlined that the set of runs with a temperature lower than 22
◦C refers to the fall period while the others to the summer time.
The line shown in the figure is the bisector line. The good agreement between fitted and measured temperature values over a period of many months indi- cates the stability of the r(t) over time once corrected for temperature effects using equation (4). The r(t) computed in the rotating BIL can be used for reconstruction in the other chambers as well once corrected for temperature variation. This leads to good average residuals (of less than 20 µm) only if the gas properties of the chamber under study are close to those of the rotating BIL itself.
The temperature correction can be checked, for example, looking at the value of t
24max◦introduced in the previous section. Fig. 8 shows the average resid- uals of barrel chambers as a function of time as obtained using a temperature corrected r(t) relation extrapolated from BILrot. The two parts of the figure refer to two different runs. Solid line histograms of each part refer to BIL and BM L chambers while full points refer to BOL chamber. In both runs the pattern is the same: while the residuals of inner chambers are within 20 µm at all times (and normally less than 10 µm) the BOL chamber shows average residuals that are significantly larger than for the other two chambers. The dif- ference in residuals observed in different chambers can be correlated to the fact that the average t
maxvalue of BOL is 4 TDC counts larger than the average of BIL and BM L chambers. Furthermore the t
maxrms value of BIL and BM L chambers of 0.70 TDC counts indicates that the difference is statistically sig- nificant. The observed change ∆t
maxis expected to induce residuals at a time t of the order ≈ ∆t
max/t
max× v
d(t) in good agreement with findings. This finding suggests a slightly different gas composition in the different chambers.
In [30] the effect of the presence of water, Nitrogen, Oxygen, Methane in the standard MDT gas mixture has been studied. While water is shown to induce a variation ∆t
maxin the t
maxvalue like ∆t
max= .066 ns / (ppm of water), the other contaminants have a negligible effect. The observed difference of the t
maxvalue between BOL and BIL and BM L chambers may then be at- tributed to the presence of ≈ 50 (ppm of water) due to the permeability of the plastic gas pipes, the tube O-rings and endplugs to water.
5 Study of M DT chamber alignment
The large amount of data provided by the alignment system of both the
barrel and the end-cap muon stand during the 2004 test-beam period has been
analysed. Results are presented in this section.
-0.24 -0.22 -0.2 -0.18 -0.16 -0.14 -0.12 -0.1 -0.08 -0.06
20 22 24 26 28 30
Sagitta (mm)
Temperature (
0C)
0.46 0.48 0.5 0.52 0.54 0.56 0.58 0.6 0.62 0.64
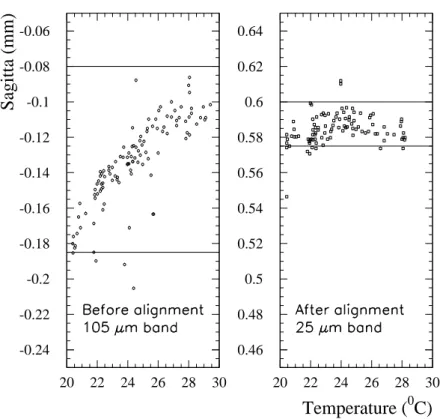
20 22 24 26 28 30
Fig. 9. Left (right) plot: sagitta variations as a function of temperature in the barrel before (after) applying the relative alignment corrections
5.1 Monitoring M DT alignment with optical sensors
The continuous monitoring of chamber distortions and shifts of chambers positions was done with alignment data. The variations of the relative positions of the chambers are mostly due to the daily temperature variations within a chamber itself and are reflected in the change of the mean value of the sagitta distribution. The sagitta was calculated separately in the barrel and the end-cap stands by considering straight track segments. Quality criteria were applied to reconstructed tracks: only one segment per chamber with at most one missing hit. Therefore accepted segments had at least 7 associated hits in the BIL/EIL chambers made of 2 x 4 layers of tubes and 5 hits in the BML, BOL/EML, EOL chambers made of 2 x 3 layers.
5.1.1 Temperature effects
Day/night temperature variations induce large variations of the sagitta of
reconstructed muon tracks in the end-cap stand, which covers a period of one
week. Before applying alignment corrections, variations of the order of several
Sagitta(mm)
Entries
0 2 4 6 8 10 12 14 16
0.1 0.125 0.15 0.175 0.2 0.225 0.25 0.275 0.3 0.325 0.35
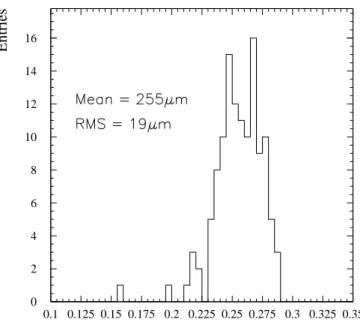
Fig. 10. Mean values of the sagitta in the end-cap, calculated after applying the alignment corrections, for various runs recorded during a one week period.
Note that the definition of the sign of the sagitta in this plot is the opposite of what was used in a previous analysis [2].
hundred microns are seen.
In the barrel muon stand the sagitta distribution for events taken over a period of one month is shown in Fig. 9 as a function of the temperature, before (left plot) and after (right plot) applying the alignment corrections.
In the barrel stand, the temperature variations explain most of the sagitta variations. Furthermore, the mean values of the sagitta distribution in the barrel muon stand are stable within a few microns over this one month period.
The distribution of mean values of the sagitta distribution in the end-cap, calculated after applying the alignment corrections, is shown in Fig. 10 for a period of one week. The stability of the results is reflected in the rms dispersion of this distribution (19 µm) which is well within specifications.
5.1.2 Controlled movements of barrel MDT chambers
Several runs were recorded to check the response of the alignment system
to controlled movements of all barrel MDT chambers in conditions close to
the dynamical range of the optical alignment sensors. Translations were in the
horizontal Z direction and rotations around the vertical Y axis, parallel to
the tubes. Table 1 summarizes the range of these movements. Both alignment
modes, relative and absolute, were tested by studying the distributions of the
Period Chamber Translation Rotation
not combined BIL 0 to 20 mm -8 to +8 mrad combined BIL 0 to 4.5 mm -3 to +2 mrad BML 0 to 4 mm -3 to +3 mrad BOL 0 to 6 mm -2 to 0 mrad Table 1
Range of barrel
M DTmovements during the 2004 test beam period.
track sagitta. In July 2004, three runs with barrel chamber movements were taken and data were recorded with a hodoscope triggered beam of pions. The sagitta residuals have a dispersion of 78 µm after absolute alignment correc- tions and 14 µm in the relative alignment mode. In the November 2004 test beam period, 18 runs were recorded with controlled movements (translations and rotations) of all barrel MDT chambers. This time, a muon beam was used and the trigger was (10 x 10) cm
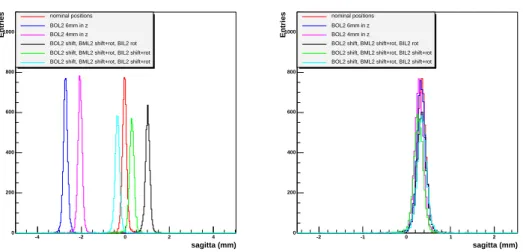
2. Data from some of these runs were discarded as several optical sensors were either out of range or did not work properly. Results are shown in Fig. 11: before the alignment corrections are applied, the mean value of the sagitta varies by several millimeters reflecting MDT chamber movements. After alignment corrections are applied, all sagitta distributions are centered at the same mean value around zero, as expected.
The sagitta residuals have a dispersion of 18 µm in the relative alignment mode. In the absolute mode, the mean value of the sagitta is ∼ 350 µm which indicates that final calibrations of the optical sensors are needed to improve the alignment performance.
This study shows that the geometrical range of operation of the alignment sensors is adequate for accommodating several mm of misplacements of the muon chambers, which is the accuracy achieved when installing some ”diffi- cult” chambers in ATLAS. Using the alignment corrections delivered by the system, muons can be reconstructed with the required accuracy.
5.2 Results on alignment with tracks
An essential part of the alignment is to find the initial geometry. This serves as a reference which is extrapolated to any later time using the optical system in relative mode. A survey may be used for this, but it lacks the neces- sary precision and it cannot be performed for the entire ATLAS spectrometer.
Therefore the initial geometry needs to be determined with tracks. The H8
test beam data were used to check the feasibility of this method.
sagitta (mm)
-4 -2 0 2 4
Entries
0 200 400 600 800 1000
nominal positions BOL2 6mm in z BOL2 4mm in z BOL2 shift, BML2 shift+rot, BIL2 rot BOL2 shift, BML2 shift+rot, BIL2 shift+rot BOL2 shift, BML2 shift+rot, BIL2 shift+rot
sagitta (mm)
-2 -1 0 1 2
Entries
0 200 400 600 800 1000
nominal positions BOL2 6mm in z BOL2 4mm in z BOL2 shift, BML2 shift+rot, BIL2 rot BOL2 shift, BML2 shift+rot, BIL2 shift+rot BOL2 shift, BML2 shift+rot, BIL2 shift+rot