Z-Boson resonance as a Calibration and Alignment Process for the ATLAS Muon Spectrometer
Nectarios Benekos and Matthias Schott
Abstract— The study of the Z Boson at ATLAS provides several interesting aspects. The measurements of cross section and transverse momentum spectrum (
) of the Z Boson provide additional tests of the standard model and may be sensitive to exotic physics processes. Moreover, the mass and the width of the Z Boson is known to a very high precision through LEP experiments. These parameters can be used for precision tests of the detector, in particular for alignment issues of the ATLAS Muon Spectrometer.
Various effects of misalignments in the ATLAS Muon Spec- trometer on the reconstructed Z-Boson resonance are discussed.
These alignment effects are compared to effects due to a variation of the expected magnetic field. Moreover, techniques to measure these impacts on the efficiency and precision of muon momentum reconstruction with early data are studied.
Index Terms— LHC, ATLAS, Muon Spectrometer, Z-Boson.
I. I NTRODUCTION
The Large Hadron Collider (LHC) [1] at CERN will offer an unparallel opportunity to probe fundamental physics at an energy scale well beyond that reached by current experiments.
The ATLAS detector [2], currently being installed at CERN, is designed to provide precise measurements of 14 TeV proton- proton collisions at the LHC, starting in 2007. The apparatus, one of the biggest and most complex ever designed, requires a detailed and flexible simulation to deal with questions re- lated to design optimization and to issues raised by staging scenarios, enabling detailed physics studies which will lay the basis for the first physics discoveries. Given the complexity of the apparatus in this demanding environment, an Object- Oriented(OO) methodology is required to manage the full detector simulation. The GEANT4 [3], [4] package simulation of the ATLAS Muon Spectrometer(MS) [5], implemented in a OO perspective, is an ambitious task since it deserves not only a very detailed description of the apparatus geometry, but also it covers issues connected to a fast but precise simulation and a correct implementation of the different detector responses. It deals with the new physics environment, testing extensively the apparatus prototypes and exploiting comparison with real data from the ATLAS Combined Test-Beam (CTB).
The ATLAS Muon Spectrometer [5] has been designed to provide a three-point measurement of tracks in large supercon- ducting air-core toroid magnets. Its momentum measurement capability combines the highest possible efficiency with a mo- mentum resolution of 2-3% at 10-100 GeV/c and 10% at 1 TeV,
N. Benekos is with the Max Planck Institute, Munich, Germany.
M. Schott is with the Ludwig Maximilians University, Munich, Germany.
taking into account the high-level background environment, the inhomogeneous magnetic field, and the large size of the apparatus (24 m diameter by 44 m length, Figure 1). An optical alignment system controls the relative positioning of muon chambers at the 30 micron level.
In this note we present a review of the activities of the simulation for MS during the last year, starting from an analysis of the program design for the different components of the MS with focus on physics and on the physics validation issues.
II. T HE ATLAS S IMULATION PROJECT
ATLAS has decided to migrate the simulation to GEANT4 [3], [4], using object oriented (OO) software engineering methods. In addition, it has been decided to store parameters describing the detector geometry and materials in a software- neutral database. This will allow all parts of the ATLAS offline software to use the same source of information about the detector instead of having to manually enter information into each program separately.
III. T HE ATLAS M UON S PECTROMETER S IMULATION
The MS of the ATLAS experiment is a large and complex system relying on several detector technologies. The simulation of muon events require a very careful description of these detec- tors, some of which provide a muon trigger (RPC,TGC) while the others make precision measurements of tracks (MDT,CSC).
A detailed description of the passive materials, toroidal magnet systems and shield is also needed to account for Coulomb scattering and energy losses.
Input for simulations comes from event generators after passing a particle filtering stage. The Muon Hit is the response of the detector following the interaction of a particle with its sensitive part (the gas in the CSC for example). Hits are labelled by a Simulation Identifier, SimID, a 32-bit integer in which the geometry information about the hit position is folded. The SimIDs are enough to access to all the geometrical information needed later on in the ATLAS offline full chain. Muon hits are stored in HitCollections, one for each Muon technology, where they are inserted in a random way (no sorting is performed at the simulation level). There are therefore four independent hit collections in the MS, one for each technology, for each event.
The hit information is combined with estimates of internal
noise and subjected to a parametrization of the known response
of the detectors to produce the simulated digital output, the
Muon Digits, which are the input to the offline reconstruction
Chambers Chambers
Chambers
Chambers Cathode Strip Resistive Plate
Thin Gap
Monitored Drift Tube
Fig. 1. Scetch of the ATLAS Muon Spectrometer (taken from [2])
programs. The digitization of GEANT4 hits in ATLAS MS is performed subdetector-by-subdetector. The Muon digit object carries two pieces of information: an offline compact identifier (OID) of a readout element and the simulated data coming from the same element (TDC, ADC counts on MDT tubes, charge on CSC strips, RPC time of flight, etc). The digits can be feed to the pattern recognition and track reconstruction algorithms as if they were real data.
In addition of being capable of handling hits coming from a single bunch crossing, the Muon Digitization is also able to handle piled-up collisions. Hits from several bunch crossings are overlaid taking into account the global time of the hit which is defined as the G EANT 4 hit time, plus the bunch crossing time with respect to the main crossing.
IV. M ISALIGNMENT OF THE ATLAS M UON
S PECTROMETER
To simulate misalignment of the ATLAS Muon Spectrom- eter, each MDT chamber was displaced and rotated randomly according to a gaussian distribution within the ATLAS Monte- Carlo simulation as illustrated in Figure 2. The width of the gaussian implies the uncertainty of the chamber positions and it was chosen to correspond to an average displacement of
in x-, y- and z-direction and for rotations. These values are a conservative estimation of the expected misalignment of Muon Spectrometer for the first data.
Since a misplacement of a MDT-chamber has a direct impact on the
measurement of a muon, we expect a decrease of transversal momentum resolution for a misaligned ATLAS Muon Spectrometer. The normalized
deviation for each single muon is defined as
! #"
%$'&)(+*
! ,"
-$'&)(.*
-/0
21436587
9;:
2<>=@?A
(1) where
143B587stands for the reconstructed and
2<C=!?Afor the Monte Carlo truth information of the muons’ transversal
=
Muon Drift Tube Chamber
Displacement Gaussian Distribution
Fig. 2. Principle of Misalignment
P
T-0.2 -0.15 -0.1 -0.05 -0 0.05 0.1 0.15 0.2 σ
Number of Entries
0 20 40 60 80 100 120 140 160
Fig. 3. Transverse momentum resolution
momentum. The value of
is plotted for each muon in a histogram as shown in Figure 3.
We defined the
2resolution of the Muon Spectrometer as follows: In a first step a Gaussian
Dis fitted to the distribution in Figure 3. In a second step a second Gaussian
DEwith constant background is fitted to the data between the
Flimits of
D. The width of
DEis then defined as
resolution.
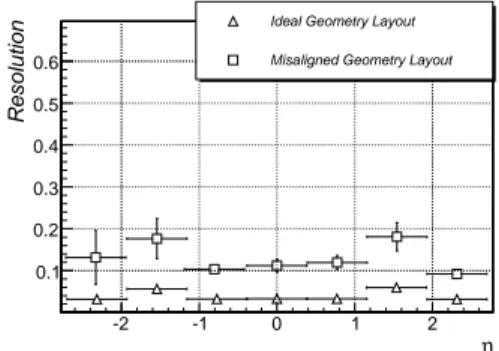
We observe a decrease of
up to 10% in the overall Muon Spectrometer acceptance region for a misalgined geometry as shown in Figure 4.
The mass of Z-Boson can be calculated by
-2 -1 0 1 2 η
Resolution
0.1 0.2 0.3 0.4 0.5 0.6
Ideal Geometry Layout Misaligned Geometry Layout
Fig. 4. Comparison of transversal momentum resolution for an ideal and
misaligned Muon Spectrometer layout
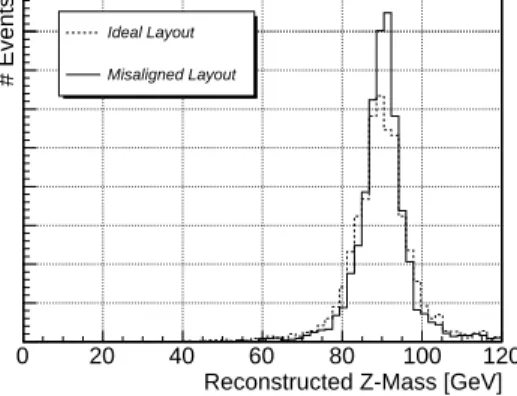
Reconstructed Z-Mass [GeV]
0 20 40 60 80 100 120
# Events
0 50 100 150 200 250 300 350
400
Ideal Layout
Misaligned Layout
Fig. 5. Impact of a misaligned Muon Spectrometer on the measured Z-Boson resonance
-3 -2 -1 0 1 2 η 3
Efficiency
0.7 0.8 0.9 1 1.1
1.2 Ideal Geometry Layout
Misaligned Geometry Layout
Fig. 6. Comparison of efficiency momentum resolution for an ideal and misaligned Muon Spectrometer layout
E
E
E
E
E
E
E
! ! E
" " E
where
,
and
#are the measured quantities of the decay- ing muons of the Z-Boson. Hence the decrease of transversal momentum resolution has also an impact on the measured width of the Z-Boson resonance from a
$&% '('decay.
Figure 5 shows two reconstructed Z-Boson mass distributions for an ideal and misaligned Muon Spectrometer Geometry. A significant effect can be seen already for an average chamber displacement of
F0-0)'.
Since the mass and the width of the Z-Boson is known to a very high precision from LEP experiments [6] the actual measured distribution might be used for alignment purposes.
Preliminarily studies show, that the Z-Boson mass constraint on the
of decaying muons cannot be used as a sufficient alignment method of Muon Spectrometer with first data.
Moreover, the impact of misalignment on the muon recon- struction efficiency of the Muon Spectrometer was studied.
No significant decrease on the overall muon reconstruction efficiency is observed (Figure 6).
-2 -1 0 1 2 η
Resolution
0.025 0.03 0.035 0.04 0.045 0.05 0.055 0.06 0.065
Ideal Magnetic Field Description Rough Magnetic Field Description
Fig. 7. Comparison of efficiency for different Magnetic Field descriptions
-3 -2 -1 0 1 2 η 3
Efficiency
0.7 0.8 0.9 1 1.1
1.2 Ideal Magnetic Field Description
Rough Magnetic Field Description
Fig. 8. Comparison of transversal momentum resolution for different Magnetic Field descriptions
V. I MPACTS OF M AGNETIC F IELD V ARIATIONS
The Muon Spectrometer is surrounded by an aircore toroid magnet and its magnetic field can be calculated by direct application of Bio-Savart law. This field impacts the Muon Spectrometer in several ways like its precise knowledge for muon reconstruction.
The magnetic field is described by a 3d mesh in r-, z- and
#
-direction. To measure the magnetic field impact on the Muon Spectrometer performance two different meshes were applied during simulation and reconstruction. The main difference of these mashes is the step-size between neighboring points. As a preliminarily result no significant differences in the overall muon reconstruction efficiency and the
resolution can be seen as shown in Figure 7 and 8. As a consequence no impact on the Z-Boson width is observed within our statistics.
Therefore it can be concluded that the performance of the Muon Spectrometer at first data is dominanted by alignment issues.
VI. C ALIBRATION OF THE M UON S PECTROMETER WITH
Z-B OSONS
As already mentioned in section IV the properties of the Z-
Boson resonance are well known and can therefore be used for
the determination the momentum resolution and reconstruction
efficiency which is described in the following sections.
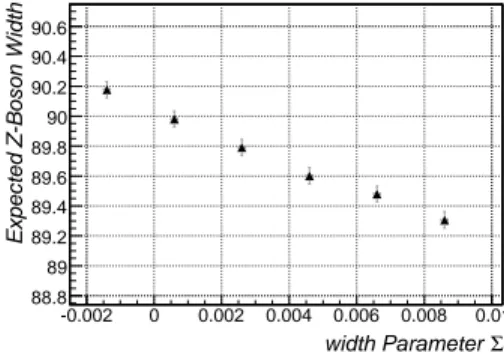
Σ width Parameter -0.002 0 0.002 0.004 0.006 0.008 0.01
Expected Z-Boson Width
88.8 89 89.2 89.4 89.6 89.8 90 90.2 90.4 90.6
Fig. 9. Width Parameter vs. Width of Z-Boson
A. Determination of Transversal Momentum Resolution The
-distribution for an ideal Muon Spectrometer geom- etry is shown in Figure 3. This distribution can be parametrized by
0 /
0 / !
"$#%'&'
0 /0-0(
(2) It is assumed that this parametrization holds also for the
- distribution in a misaligned ATLAS Muon Spectrometer with different values of
)
and
. The basic procedure is for the determination of the transversal momentum resolution of the Muon Spectrometer within data is then as follows
*
Measurement the mean
and width
of a Z-Boson in data
*
Smear the
of Monte Carlo muons from a
$ %&'('sample according to
for different values of
*
Calculate the resulting Z-Boson width within the smeared Monte Carlo Muons.
*
We observe a linear dependence between the reconstructed Z-Boson width and the smearing parameter
(Figure 9).
*
Determine the corresponding value of
for the measured Z-Boson width
*
Repeat the procedure from step 2 for the determination of
9
This procedure has been extended and validated for the de- termination of the
-resolution for different
-ranges (Figure 10).
B. Determination of Muon Reconstruction Efficiencies The muon reconstruction efficiency of the Muon Spectrom- eter is defined as ratio
+-,/.
Correct Reconstructed Track
.
Monte Carlo Truth Muons
(3) where a track is defined as correctly reconstructed if its
and
#parameter fulfill the condition
143B587
2<>=@?A E #
143B587 #
2<>=@?A
E10
0 /0(
(4)
-2 -1.5 -1 -0.5 0 0.5 1 1.5 2 η Resolution T p
0.02 0.025 0.03 0.035 0.04 0.045 0.05
Fig. 10. PT-Resolution determined with data
Tag Muon
Probe Muon Z−Boson
The invariant mass of the two tracks should be near the Z−Boson mass corresponding track in the MS Probe, if there is a
Inner Detector Muon Spectrometer
Fig. 11. Principle of Tag and Probe Method
This condition requires that the reconstructed particle track lies within a cone radius of
0 /0(around the Monte Carlo truth muon track. The so-called Tag- and Probe-method was used to determine
+within data (Figure 11). The basic idea of this method is to use muons from a Z-Boson decay. One muon is required to be reconstructed in the ATLAS Inner Tracker as well as in the Muon Spectrometer. This muon is called Tag muon. In a second step a further track in the Inner Tracker is searched which gives together with the Tag muon an invariant mass near the Z-Boson mass of
2 435 6. This second track is called Probe Muon and it is assumed that this track is a real muon since it comes from a Z-Boson decay. It is now probed if a corresponding track to the Probe Muon is reconstructed in the Muon Spectrometer. In this way the muon reconstruction efficiency can be determined.
This method assumes that the probabilities of the reconstruc- tion of the Tag- and Probe-Muons is not correlated. Moreover, fake Probe tracks which fulfill the Z-Mass constraint by chance must be avoided. Therefore the following cuts have been applied for both tracks
*
Opposite charge requirement
* 87 -0935 6
*;:
0<35 6>=@? = @0-0<35 6
*
Isolation criteria for both muon tracks
The comparision of the efficiency determined with Tag and
Probe and Monte Carlo Truth is shown in Figure 12 and no
significant difference can be observed. The contribution due to
background events like
A % 'B DC EFis also believed to be
-3 -2 -1 0 1 2 η 3
Efficiency
0.7 0.8 0.9 1 1.1
Tag and Probe Efficiency Monte Carlo Truth Efficiency
Fig. 12. Comparison of Monte Carlo Truth to Tag and Probe results
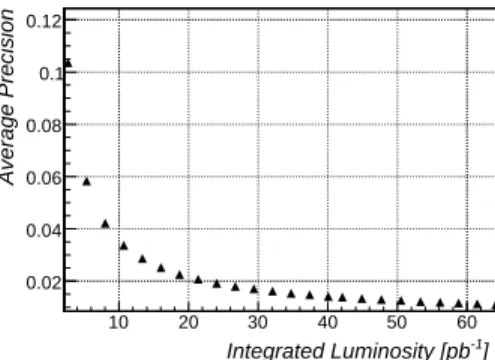
-1 ] Integrated Luminosity [pb
10 20 30 40 50 60
Average Precision
0.02 0.04 0.06 0.08 0.1 0.12
Fig. 13. Achievable Precision with Tag and Probe vs. integrated luminosity
below
0 /.within our current statistics.
Not only the overall reconstruction efficiency of the ATLAS Muon Spectrometer can be determined with this method but also the efficiency of smaller sections. An average precision of 1% for 224 sections, defined by 14 bins in
-direction and 16 bins in
#-direction, is expected the be reached with an integrated luminosity of
0