Physik-Department
Technical University of Munich
Master Thesis
Test of High-Resolution Muon Drift-Tube Chambers for the
Upgrade of the ATLAS Experiment
Šejla Hadžić
September 2019
Technical University of Munich Arcisstraße 21, Munich
Physics Department
Max Planck Institute for Physics (Werner Heisenberg Institute) Föhringer Ring 6, Munich
Master Thesis
Test of High-Resolution Muon Drift-Tube Chambers for the
Upgrade of the ATLAS Experiment
Šejla Hadžić
Supervisor: PD Dr. Oliver Kortner
Second examiner: Prof. Dr. Lothar Oberauer
Abstract
High-resolution muon drift-tube chambers were studied as a part of the planned upgrades of the ATLAS detector for the high luminosity (HL) LHC. To suppress fake muon triggers, observed in the transition region from the barrel to the end- caps of the ATLAS muon spectrometer, 16 new so-called "BIS-78" sMDT chambers will be installed in this region. As a part of this thesis, functionality tests of the eight A-side sMDT chambers are performed prior to their installation in the ATLAS detector, during the 2019/20 shutdown of the LHC. All chambers are tested in a cosmic-ray test stand. The chamber performance is characterized by measuring the noise rates, spatial resolution and the muon detection efficiency of each drift tube in the chamber. The second part of this thesis is dedicated to determination of the operational point of the amplifier-shaper-discriminator (ASD) chips for the new read-out electronics, which was developed for the operation at the HL-LHC. The noise rates, spatial resolution and muon detection efficiency are determined with two read-out cards carrying new ASD chips.
Contents
Introduction 1
1. The ATLAS experiment 3
1.1. Detector components . . . 4
1.1.1. The muon spectrometer . . . 6
1.1.2. Muon chamber types . . . 6
1.2. Trigger and Data Aquisition System . . . 7
1.3. ATLAS detector upgrades . . . 9
1.4. BIS78 upgrade project . . . 10
2. ATLAS BIS78 sMDT chambers 13 2.1. Functioning principle of cylindrical drift tubes . . . 14
2.2. Design and working principle . . . 16
2.2.1. Advantages of small-diameter drift tubes . . . 18
2.3. BIS78 sMDT chamber assembly . . . 19
2.4. BIS78 sMDT chamber electronics . . . 22
2.4.1. High voltage side . . . 22
2.4.2. Read-out side . . . 23
I. BIS-78 sMDT chamber tests 27
Introduction 29 3. Experimental set-up 31 3.1. Cosmic test stand . . . 313.1.1. Trigger and Read-Out Scheme . . . 32
4. Noise rate measurement 35 4.1. Off-chamber measurements . . . 36
4.2. On-chamber measurements . . . 36
5. Drift tube calibration 37 5.1. Pedestal determination . . . 37
5.2. The drift time spectrum . . . 38
6. Spatial resolution 41 6.1. Track reconstruction . . . 41
6.2. Spatial resolution determination . . . 42
7. Muon detection efficiency 45
8. Results 47
8.1. Noise measurement . . . 47
8.1.1. Noisy tubes . . . 50
8.2. Maximum drift time . . . 53
8.3. Spatial resolution . . . 55
8.3.1. Spatial resolution at different hysteresis and threshold . . . 58
8.4. Muon detection efficiency . . . 60
8.4.1. Efficiency as a function of drift radius . . . 63
8.4.2. Efficiency as a function of high voltage . . . 64
8.4.3. Efficiency as a function of threshold . . . 67
II. New read-out electronics operational point determina- tion 69
9. Overview 71 10.Results 73 10.1. Noise study . . . 7310.2. Cosmic rays test . . . 74
10.2.1. Spatial resolution . . . 74
10.2.2. Muon detection efficiency . . . 75
10.3. Operational point of the new ASD chip . . . 76
Summary 77
A. Tube numbering and channel mapping 79 A.1. Mezzanine cards . . . 79A.2. Mezzanine card tube numbering . . . 80
A.3. Read-out channel mapping . . . 81
Bibliography 83
Introduction
“What are fundamental constituents of nature ?” - the question that exists since the earliest times of the humankind. The first attempts to answer this question were given in Ancient Greece, where the atom was considered to be the smallest and an indivisible constituent of matter, which gave the foundation for the development of the particle physics. This was just the beginning of the continuous search for new elementary particles, while at the same time pushing the boundaries of our knowledge about nature with the parallel development of larger and more complex particle accelerators and detectors for these purposes.
Our curiosity to understand the world we are living in and its underlying laws led to the construction of the Large Hadron Collider (LHC) [1], the most complex experi- mental facility in the world, designed by the CERN1, with the goal of investigating the structure of matter. Its 13 TeV centre-of-mass energy during the Run 2 data taking was the highest energy ever reached by a collider. Situated at the border of Switzerland and France, near the city of Geneva, LHC accelerates proton and heavy ion beams and collides them at the four crossing points. The products of the collisions are detected and analyzed with the seven different detectors, each designed for specific scientific goal.
In 2012, the successful operation of the LHC (Run 1) was followed by the discovery of a new particle, which was confirmed to be the Higgs boson, with the mass of 125.5 GeV [2, 3], the last missing part of the Standard Model, relativistic quantum field theory representing, for now, our best attempt to classify discovered elementary particles and describe three of four known interactions in the Universe between them, in a self-consistent way. Although the Standard Model is a well-tested theory and all of its predicted particles are discovered, there is experimental evidence for its incompleteness. This is the physics motivation of the many projects around the world to build higher energy colliders and develop better performance detectors which will allow the search for the answers on the many questions that still exist.
In order to extend the operation of the LHC, series of upgrades are planned to increase its luminosity, with an aim to strengthen its discovery potential and search for physics beyond the Standard Model. However, at high integrated luminosity and harsh radiation environment, many detectors and read-out electronics of the LHC will reach the limit of their rate capabilities and subsequently the end of their lifetime, requiring installation of new detectors, designed to cope with newly created conditions.
1
The main focus of this thesis is the test and comissioning of the new high-resolution muon chambers developed for the upgrade of the ATLAS detector at CERN. In the first chapter of this thesis, an introduction to the ATLAS experiment and its subdetector systems will be presented, including a brief overview of the planned ATLAS upgrades for the High Luminosity LHC. The second chapter is dedicated to explain the working principle and main characteristic of the Monitored Drift Tubes, as the main focus of this master thesis. The rest of the thesis is split into two parts. The first part deals with the tests of the BIS78 sMDT chambers with cosmic rays, to investigate noise rates, spatial resolution and muon detection efficiency of the chambers, as a part of their preparation for the installation at CERN. The experimental set-up and the method used in determining investigated quantities is described followed by the obtained results and discussion. The second part is focused on the determination of the operational point for the new read-out electronics, with the discussion of the obtained results.
1. The ATLAS experiment
The ATLAS1 detector [4] is one of the two general-purpose detectors at the Large Hadron Collider, with the same scientific goals but different technological solutions as the CMS. With its length of 46 m and diameter of 25 m, the ATLAS detector is the largest and most complex scientific instrument ever built. To reach the de- sired collision energy, protons are travelling through series of preaccelerators, before they reach the 27 km long LHC tunnel, previously occupied by the Large Electron- Positron Collider (LEP) [6]. The pp collisions for LHC are chosen over LEP e+e− due to significant energy loss through synchrotron radiation present when acceler- ating electrons, which is proportional to m−4. Therefore, this effect is less present when accelerating heavier particles. On the other hand, protons (or hadrons) are composite particles. They have substructure made of valence, sea quarks and gluons called partons. This means that in the hadron collisions, partons do not have defined momentum, but their momenta is distributed according to the parton distribution function.
Figure 1.1.: Complete view of the ATLAS detector. [4]
After reaching the desired energy, the beams of protons are collided at four crossing
1
points. The ATLAS detector, whose complete overview is given in the Figure 1.1, is located at hte Interaction Point 1 of the LHC complex. ATLAS uses a right-handed coordinate system with its origin at the nominal interaction point (IP) in the centre of the detector, the beam direction defines thez-axis and thex−yplane is transverse to the beam direction. The x-axis points from the interaction point to the centre of the LHC ring, whiley-axis points upwards. The A-side of the detector is defined with positivezandC-side with negativez. In terms of cylindrical coordinates,(r, φ) are used in the transverse plane,φbeing the azimuthal angle around the beam pipe.
The pseudorapidity is defined in terms of the polar angle θ as:
η=−ln tan θ
2
(1.1)
Transverse momentum and energy are defined as pT = psinθ and ET = Esinθ, respectively [4].
1.1. Detector components
Figure 1.2.: Schematic cross-section of the ATLAS detector [4] perpendicular to the beam line, with typical signatures left by different types of SM particles, depending on their interaction with detector material [5]
Since products of pp collisions can be any particle from the Standard Model, it is not possible to use only one detector type for detection. Therefore, in the ATLAS
1.1. Detector components detector, collision products are detected with the complex system of different de- tector types organized around the beam line. The size of the ATLAS detector is mainly determined by the nature of the particle interactions with matter. Parti- cles lose energy differently while travelling through a material, depending on their energy, electric charge and type of the material they are travelling through. The cross-section of the ATLAS detector perpendicular to the beam line is shown in Figure 1.2.
The ATLAS detector is divided into three main components. The closest to the beam line, immersed in homogenous 2 T magnet, is the Inner Detector with the purpose of reconstructing the trajectories of the charged particles to determine their charge and momentum as well as identification of secondary vertices. It is constructed as a combination of high-resolution Pixel and silicon microstrip (SCT) trackers and straw tubes of the Transition Radiation Tracker (TRT) tracking detectors in the outer part, enabling distinction between electrons and hadrons, such as pions, by providing additional space points [7]. It has been designed to provide a transverse momentum resolution, in the plane perpendicular to the beam axis, of σT/pT = 0.05%×pT[GeV]⊕1% and a transverse impact parameter resolution of 10 µm for high momentum particles in the central pseudorapidity region [4]. The ATLAS Inner Detector and its subsystems are shown in Figure 1.3a.
Typically in collider experiments, the tracking detector is surrounded by calorime- ters, to measure the energy ofγ, e± and hadrons, by creating electromagnetic and hadronic showers. The ATLAS electromagnetic calorimeter is a high granularity lead-liquid Argon (LAr) detector with accordion-shaped kapton electrodes and lead absorber plates, providing full solid angle coverage. The ionization charge is col- lected on copper clad Kapton electrodes. The EM calorimeter has been designed to provide energy resolution of σE/E = 10%/p
E[GeV]⊕0.7% [4]. The hadronic calorimeter is divided into three subdetectors: tile, LAr hadronic end-cap (HEC) and forward (FCal) calorimeter. The expected energy resolution [4] for the hadronic calorimeter is:
• Barrel and end-caps: σE/E = 50%/p
E[GeV]⊕3%;
• Forward: σE/E = 100%/p
E[GeV]⊕10%.
The complete calorimeter system of the ATLAS detector is shown in Figure 1.3b.
Calorimeters have high stopping power to ensure that electromagnetic and hadronic showers are fully contained within its volume and must limit punch-through into the muon spectrometer, the final part of the ATLAS detector, which occupies the largest volume, with purpose of detecting muons, particles that transverse dense detector materials without significant energy loss.
(a) ATLAS Inner Detector [8] (b) ATLAS Calorimeter System. [9]
Figure 1.3.: Computer generated image of the ATLAS subdetectors
1.1.1. The muon spectrometer
The main characteristic part of the ATLAS experiment is the muon spectrometer, whose layout is shown in Figure 1.4. The muon spectrometer is the outermost part of the ATLAS experiment and occupies the largest volume. It is designed to detect and measure muon momenta by deflecting their trajectories in the large superconducting air-core toroid magnets, of approximately 0.5 T and 1 T in the central and end-cap regions, respectively [4]. The expected stand-alone transverse momentum resolution is σpT/pT = 10% atpT = 1 TeV [4]. The muon spectrometer combines different technologies of precision-tracking and triggering chambers. In the barrel regions, the chamber plane is tangential to the circles around the beam axis, while in forward and end-cap regions chambers are installed perpendicular to the beam axis, in three layers.
1.1.2. Muon chamber types
The high muon momentum resolution is achieved combining two types of the precision- tracking chambers:
• Cathode strip chambers (CSC) are used in the innermost tracking region (2 < |η| < 2.7) due to their high rate capability and time resolution. CSCs are multiwire proportional chambers with cathodes segmented into strips.
• Monitored drift tubes (MDT)are used for the precission momentum mea- surement, over the pseudorapidity range |η| <2.7. Limit of their coverage is
|η|<2.0 in the innermost end-cap layer.
The important characteristic feature of the muon system is to trigger on muon tracks, therefore precision-tracking chambers are complemented with two types of fast triggering chambers:
1.2. Trigger and Data Aquisition System
Figure 1.4.: Computer generated image of the ATLAS Muons Subsystem [10]
• Resistive plate chambers (RPC) are parallel electrode-plate gaseous de- tectors. They are used in the barrel region (|η|<1.05), due to their good time resolution and high rate capability;
• Thin gap chambers (TGC) are used in the end-cap region (1.05 < |η| <
2.4). They operate in a similar way as multi-wire proportional chambers, providing good resolution and high rate capability.
The chambers have different shapes and dimensions in the barrel and end-cap re- gions, due to the optimization of the solid angle coverage. The present ATLAS muon spectrometer layout in the r−z plane can be seen in Figure 1.5.
1.2. Trigger and Data Aquisition System
The ATLAS detector is designed to observe pp collision products. However, due to storage limitations and properties of the electronics, it is not possible to store every event, out of more than 40 million collisions per second. Therefore, a three step trigger system is used to reduce huge data sets to managable levels, by select- ing events for physics analysis containing interesting characteristics that can lead to future new discoveries. The level 1 (LVL1) trigger is hardware based and it re- duces the data rate from 40 MHz bunch crossing down to 75 kHz using the custom build electronics, by processing the data from the calorimeters and muon detectors, searching for the events with large electromagnetic deposit or highpT muon tracks.
(a) Small sector
(b) Large sector
Figure 1.5.: The view of the present (Run 1/2) ATLAS muon spectrometer layout in the r−z plane [17]. Green (blue) chambers are MDT chambers in the barrel (endcap) regions of the spectrometer. The TGC, RPC, and CSC chambers are shown in red, white, and yellow, respectively [17]. The naming of the MDT chambers is based on their location in the barrel (B) or end-cap(E);
assignment to inner (I), middle (M), outer (O) or extended (E) chamber layer; belonging to the large (L)/small (S) sector or for special chambers F, G, R, M. The sector number (1−16) and the sequence number of the chamber in a row are added to complete specification of the MDT chambers [4].
1.3. ATLAS detector upgrades The level 2 (LVL2) trigger further reduces the rate down to 3.5 kHz, while the event filter (EF) at last reduces the rate down to 200 Hz. To be able to analyse the data permanently stored at the CERN computer center, a global computing network, the Worldwide LHC Computing Grid (WLCG), was created.
1.3. ATLAS detector upgrades
As a part of the High Luminosity LHC (HL-LHC) [11] project, a series of planned upgrades will gradually increase the luminosity of the LHC. Therefore ATLAS sub- detectors will undergo major modifications to be able to cope with new conditions, while exploiting the physics potential of the HL-LHC. The upgrades of the LHC are divided into two phases:
• The Phase-I upgrade of the LHC (during the Long Shutdown 2) is planned from 2019 to 2020, which will include upgrades of the injectors to increase LHC peak luminosity to 2×1034 cm−2s−1, with an aim of reaching the integrated luminosity of 300 f b−1 by the end of Run 3.
• The Phase-II upgrade is scheduled between 2024 and 2026 with the plan of installing new focusing magnets and crab - cavities, that will result in a total integrated luminosity for proton-proton collisions of3000 f b−1 in the following years of operation.
The upgrades of the ATLAS detectors are organized in the foreseen phases.
The entire ATLAS tracking system will be replaced in the Phase-II, because of its expected sensor and front-electronics performance degradation due to the radiation damage [12]. A completely new silicon tracking system, named Inner Tracker (ITk) will consist of the Strip Detector surrounding a Pixel Detector and which must satisfy the following criteria: higher granularity, improved material budget and increased radiation hardness of the read-out components. More details about the ITk design can be found in [13, 14].
The Phase-I and Phase-II upgrades of the ATLAS LAr Calorimeter include replace- ment of the trigger system, read-out electronics and low-voltage power system due to limited radiation tolerance. The upgrades will provide higher-granularity and higher energy resolution, which is of importance for the trigger system, since it will give higher efficiency for identifying electrons, photons, τ leptons, jets and missing transverse energy at the high backgrounds in HL-LHC environment. During the Phase-II upgrade, the Tile Calorimeter will undergo major replacement of its on- and off-detector electronics. The details about planed ATLAS Calorimeter upgrades can be found in [15, 16].
The challenge for the ATLAS Muon Spectrometer in the harsh HL-LHC environ-
ment is to preserve its excellent muon identification, both standalone and combined with the inner detector. Therefore, during the Phase-I and Phase-II upgrades, the ATLAS Muon Spectrometer will undergo significant modifications, including the in- stallation of new chambers. Planned upgrades include replacement of large part of front-end, trigger and read-out electronics as well as the redesign of the trigger and read-out system for RPC and TGC chambers and electronics system for the MDT chambers [17]. The New Small Wheel (NSW) project, planned for the Phase-I up- grade, includes the replacement of the CSC chambers and the MDT chambers of the innermost endcap wheels with small-strip TGC (sTGC) and Micro-Mesh Gaseous Structure chambers used for both triggering and precision tracking. In the Phase- I and Phase-II upgrade, new integrated muon tracking and triggering chambers (sMDT+RPC) are planned to be installed in the inner barrel layer of the ATLAS muon spectrometer.
Following the upgrade of the detector subsystems and facing much higher event rates and pile-up levels beyond its original design, the upgrade of the Trigger and Data Aquisition (TDAQ) system is foreseen, to support planned physics programme at HL-LHC. The TDAQ system upgrades are devided in Phase-I and Phase-II, whose details are given in [18, 19].
1.4. BIS78 upgrade project
The success of the muon spectrometer is based on high muon trigger efficiency and muon momentum resolution up to the TeV scale. However, in the transition region from the barrel to the end-caps, a non-negligible rate of the fake muon triggers has been observed. To suppress these fake muon triggers, the plan is to equip the transition region with additional Thin-Gap RPC during LHC’s second long shutdown. Due to spatial constraints, MDT chambers already installed in this region (Figure 1.5a: chambers 7 and 8 in the BIS region) will be replaced by Small-Diameter Muon Drift Tube (sMDT) chambers. This Phase-I upgrade serves as a pilot project for the complete replacement of the BIS1–6 MDT chambers in LS3 by sMDT+RPC chamber modules that will have a very similar design [17]. The new chambers will be installed in the small sector of the barrel inner layer, at the ends of the toroid magnet coils.
Each BIS78 station will serve as integrated tracking and triggering detector and therefore will be composed of one sMDT chamber with two RPC triplets (BIS7 and BIS8). The scheme of the new Thin-Gap RPC chamber is shown in the Figure 1.6. Their characteristic is very fast detection and therefore are used as triggering chambers in the ATLAS muon spectrometer. New RPC chambers have twice tinner gas gaps and electrodes, as well as new highly sensitive amplifiers which improve the time resolution. Reduced operational voltage and lower achieved gas gain results in a longer lifetime, suitable for operation at HL-LHC conditions [20]. An example of the design of the new integrated sMDT+RPC chamber is shown in the Figure 1.7. There
1.4. BIS78 upgrade project
Figure 1.6.: Scheme of the Thin-Gap Resistive Plate Chambers for the new integrated tracking and triggering chambers of the ATLAS muon spectrometer [20].
The basic RPC unit consists of two parallel resistive plates forming a thin gas gap, where the primary ionization is multiplied by uniform electric field inside the gap.
Figure 1.7.: A design of BIS78 station, consisting of a one sMDT chamber integrated with two BIS7 and BIS8 RPC triplets [20]
are 16 different types of BIS78 sMDT chambers with complex shapes, maximizing the coverage in the overlap region with the New Small Wheel, planned to be installed in the A and C side of the barrel [17]. This master thesis focuses on testing of the eight A-side BIS78 sMDT chambers, in order to check their functionality as a part of installation preparation. The details about their working principle, as well as mechanical assembly and read-out electronics will be described in the following chapter.
2. ATLAS BIS78 sMDT chambers
The Monitored Drift Tubes (MDT) as a part of ATLAS muon spectrometer, are precision drift chambers designed to provide good spatial resolution and high track- ing efficiency independent of the track angle. Through the life of the LHC and ATLAS experiment, MDT chambers have demonstrated that they provide precise tracking over large areas. The goal of the ATLAS muon spectrometer upgrade is to increase the muon trigger efficiency, precise muon momentum measurement and to improve the rate capability of the muon chambers in the high-background regions of the HL-LHC [21]. To meet these requirements, small-diameter Muon Drift Tube (sMDT) chambers have been developed. In both cases, the basic detection element is a pressurized drift tube.
The muon momentum determination by ATLAS (s)MDT chambers is based on the deflection of a charged particle in the magnetic field. In the transverse plane, momentum can be determined as:
p[GeV
c ] = 0.3·B[T]R[m], (2.1) for a particle with the electric charge q = e. By reconstructing the muon trajec- tory in the known magnetic field and determining the curvature radius R the muon momentum can be obtained. Therefore, tracking systems are organized as multiple layers of sensitive material, to provide spatial information about the particle detec- tion in each layer, which is later used in track reconstruction. MDT and sMDT chambers in ATLAS are composed of three to four layers of drift tubes, organized in two multilayers and separated with the spacer.
Figure 2.1.: Image of the MDT (left) and the sMDT (right) tubes. [17]
The main (s)MDT parameters are listed in the Table 2.1. The major difference between MDT and sMDT chambers is the drift tube diameter (29.970mm for MDT
and 15 mm in the case of sMDT chambers) and they are shown in Figure 2.1. As an operating gas Ar/CO2 (93/7) mixture is chosen, at the absolute pressure of 3 bar [4].
Parameter MDT sMDT
Tube material Aluminium Aluminium
Outer tube diameter 29.970 mm 15.000 mm
Tube wall tickness 0.4 mm 0.4 mm
Wire material gold-plated W/Re (97/3) gold-plated W/Re (97/3)
Wire diameter 50 µm 50µm
Gas mixture Ar/CO2 (93:7) Ar/CO2 (93:7)
Gas pressure 3 bar (absolute) 3 bar (absolute)
Gas gain 2×10⁴ 2×10⁴
Wire potential 3080 V 2730 V
Maximum drift time ∼ 700 ns ∼ 190 ns
Average resolution per tube 83 µm 106 µm
Drift tube muon efficiency 95% 94%
Table 2.1.: Main MDT and sMDT chamber parameters [17]. Average resolution per tube and drift tube muon efficiency given in the case of no irradiation.
2.1. Functioning principle of cylindrical drift tubes
The drift tubes used in the ATLAS muon spectrometer are cylindrical gaseous de- tectors operating in proportional mode. The wall of the tube is grounded, while high voltage is applied to the wire in the centre of the tube (anode). When a muon transverses the drift tube, it has enough energy to ionize the gas atoms along its trajectory (Figure 2.2), resulting in the creation of free electron - positive ion pairs.
The number of the electron-ion pairs created depends on the energy required to create one ion-electron pair, which is a function of the used gas.
In the gas, the motion of created free electrons and ions is described by two pro- cesses: diffusion and drift in the electric field. Diffusionis a characteristic uniform movement of electrons and ions in the absence of the electric field. In this process, ionization products quickly reach thermal equilibrium by losing energy in the colli- sions with the gas molecules [22]. To collect created primary ionization, an electric field is applied to the central wire, which results in the drift of charges along the field lines. Electrons drift to the anode due to the electric field in the tube, while positive ions move towards the wall of the tube. Drift velocity is given as:
~
v =µ ~E, (2.2)
where µ is charge mobility. Drift velocity of the electrons is higher compared to ions, since they are much lighter [22].
2.1. Functioning principle of cylindrical drift tubes
Figure 2.2.: Cross section of the sMDT.
The electric field in the tube is radially symmetric:
E(r) = V lnrR
min
1
r (2.3)
where rmin is the radius of the anode wire and R is the inner radius of the tube.
V refers to the potential difference between anode wire and tube wall. Due to such electric field, electron near the anode will gain sufficient kinetic energy to cause secondary ionisations which results in avalanche of the secondary electrons. This process amplifies the primary signal and enables its detection. Since electrons have greater mobility, the avalanche has a shape of a liquid drop, where electrons are grouped near the head and positive ions are trailing behind [22]. A signal is formed by the movement of the ions and electrons towards the electrodes.
Diethorn The gas amplificationG, which is the ratio of charge in the avalanche and the amount of primary ionization, can be described as a function of the applied voltage using Diethron’s formula [23]:
lnG= rminE(rmin)·ln 2
∆V ·ln E(rmin) Emin(ρ0)ρgasρ
0
, (2.4)
wherermin=0.025 mm, R=7.1 mm,∆V is the potential difference through which an electron passes between two successive ionizations, while Emin is the electric field needed for the avalanche to start. Both parameters have to be measured and for the used gas mixture ArCO2 (93/7) their values are: ∆V = 34 V and Emin = 24 kVcm. The MDT and sMDT provide gas gain of2·104 as stated in the Table 2.1, which is relatively low gas gain, but has been chosen to prevent risk of the tube ageing.
2.2. Design and working principle
In the assembled chamber, many drift tubes are glued to each other, allowing muon trajectory reconstruction. The principle is visualized in Figure 2.3.
When a muon transverses such chamber, it will ionize the atoms of the gas in each passed tube. The discriminator is used to measure the time at which signal pulse crosses the predefined threshold value, that is the time at which electrons arrive at the anode wire. However, to reconstruct the muon trajectory we need information about the time needed for electrons to reach the anode wire from their creation point in the drift tube, known as the drift time. For each tube, the electron drift time can
Figure 2.3.: Cross section of the sMDT chamber, with eight layers of tubes organised in two multilayers. The muon trajectory (green arrow) is recostructed using eight drift radii, represented by red circles.
be determined as a difference between previously acquired threshold crossing time and time when the muon passed through the tube, which is obtained by additional detectors, such are scintillating counters. The drift time depends on the geometry of the drift tubes, the gas composition and pressure, as well as applied high voltage, temperature and magnetic field. The comparison of the typical drift-time spectra of the MDT and sMDT chamber is shown in the Figure 2.4. The maximum drift time of the sMDT chambers is almost 4times smaller compared to MDT chambers.
2.2. Design and working principle
Figure 2.4.: Drift-time spectra of 30 mm and 15 mm diameter drift tubes for the same gas mixture and gain. The measurements with cosmic ray muons are compared to Garfield simulations.[24].
The drift time can be converted to drift radius, which is the shortest distance from the muon track to the anode, using the calibrated space-to-drift-time (r-t) relation, shown in Figure 2.5. The exact shape of the r-t relation depends on the temperature,
Figure 2.5.: r-t relation of the MDT chamber [17]
pressure, magnetic field and total hit rate in the tube. As shown in the Figure 2.5 the r-t relation is not linear for the chosen gas mixture ofAr/CO2 (93/7). However, this gas mixture is chosen over more linear gas mixtures due to its good ageing properties which allows avoiding the polymerization on the wire. The advantage of the sMDT chambers comes from its dimensions, since it limits the r-t relation to the more linear region. Two methods are used for space-to-drift time relationship determination: autocalibration and integration method.
To determine space-to-drift time relationship, the integration methold assumes ho- mogenous muon hits along the drift tube. Therefore, the number of hits ∆N per
time interval∆t is given as:
∆N
∆t ≈ dN
dt = dN dr
dr dt = N
rmax dr
dt, (2.5)
whereN is the total number of entries in the drift time spectrum, andrmax refers to the maximum drift radius [25]. By integrating drdt = rmaxN dNdt in the range of [t0, tmax] we can obtain space-to-drift time relationship:
r(t) = Z tmax
t0
rmax N
dN
dt . (2.6)
The autocalibration method reconstructs the muon tracks using initial space-to-drift time relationship, obtained from integration method, simulation or previous mea- surement. After the track reconstruction, the residuals are calculated as a difference between measured drift radius (r) and distance of the reconstructed track to the wire (d), that is:
∆(t) =r(t)−d. (2.7)
The standard autocalibration method corrects the initial space-to-drift time relation- ship iteratively, by subtracting the mean value of the residuals in the time interval t [25].
After obtaining a precise space-to-drift time relationship, the measured drift times can be converted to drift radii, represented with the red circles on the Figure 2.3.
They are further used to reconstruct the muon trajectory as a tangent to the drift radii in the tubes with a recorded hit.
2.2.1. Advantages of small-diameter drift tubes
The performances of the MDT and sMDT chambers were studied [24, 26], showing several advantages of the sMDT chambers. Smaller maximum drift time and half size cross-section exposed to radiation results in an about eight times lower occupancy for sMDT chambers [17]. This makes sMDT chambers suitable muon precision tracking detectors not only for the conditions in the HL-LHC, but for future hadron colliders.
One of the advantages of the small-diameter muon drift tubes is in the reduction of the tube diameter itself. Positive ions created in the vicinity of the wire in the ionization process have smaller mobility compared to the electrons, which result in their slow drift towards the tube walls. This will lead to the creation of space charge that can modify an electric field in the tube, which will result in the reduction of the gas amplification. Since drift velocity depends on the electric field, space charge fluctuations can cause fluctuations of the drift time and in this way affect spatial resolution of the chamber. As space charge effects are present at large radii, they are avoided in the case of sMDT chambers. On the other hand, unchanged operational parameters such are gas gain, gas mixture and pressure, but different wire potential,
2.3. BIS78 sMDT chamber assembly allows for the sMDT chambers to share all the advantages of the MDT chambers and at the same time enables the construction of the integrated tracking and triggering sMDT+RPC chambers that can overcome spatial constraints in the ATLAS muon spectrometer.
sMDT chambers have already found their application in the ATLAS muon spec- trometer. In 2014, two BME sMDT chambers with two thin-gap RPC chambers mounted on top and bottom, were installed in the bottom sector of the barrel part of the muon spectrometer and they have been in operation since the start of LHC Run 2. In the winter shutdown 2016/2017, 12 BMG sMDT chambers were installed in the detector feet in sectors 12 and 14 of the barrel [27]. The next installation od the sMDT chambers is planned for the 2019-2020 as a part of the BIS78 pilot project, following by the installation of 96 BIS1-6 chambers in the 2024–2026.
2.3. BIS78 sMDT chamber assembly
The chamber assembly methods have been optimized for mass production, mini- mizing manpower and time needed for construction while ensuring high mechanical accuracy of the wire positioning. The sense wires with a diameter of 50µm are inserted into tube with 0.4 mm thick aluminium chromatized walls and fixed in the insulating plastic endplugs at both ends of the tubes. The detailed view of the in- dividual tube can be seen in the Figure 2.6 while the more details about the design and fabrication can be found in [17]. After successful quality assurance tests, the
Figure 2.6.: Exploded view of an sMDT endplug with interfaces for precise wire position- ing and measurement, for gas and high-voltage supplies, and for read-out electronics [21]
drift tubes are assembled into chambers in a climatized clean room. The chamber assembly consist of the following steps:
• Gluing the tubes to each other (to form multilayer) and onto the support frame and spacer using two-component epoxy glues (as for the MDT chamber construction) applied by an automated glue dispenser. The alignment sensor platforms are used for precise mounting.
• Insertion of the gold-plated ground connection screws to enable reliable elec- trical contact.
• Mounting of the chromatized aluminium ground foils of 0.2 mm thickness on the multilayers, which serve as backplanes of the Faraday cages and provide common grounding for the tubes of a multilayer close to the tube walls.
• Mounting of the gas connections.
• Addition of the ground pins onto previously inserted ground screws to al- low connection to read-out and high-voltage distribution boards, after which chamber undergoes wire positioning measurement.
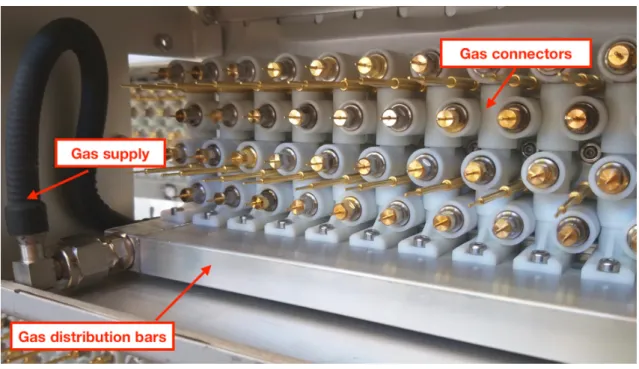
• Mounting of the parallel gas distribution system (Figure 2.7).
Figure 2.7.: Gas distribution system made of interconnected plastic gas connectors and gas distribution bars.
The gas distribution system is needed to fill drift tubes with the chosen gas mixture.
The gas for each tube is provided by injection molded plastic gas connectors, that are interconnected in the direction perpendicular to the chamber plane, connecting drift tubes to the aluminium gas bars mounted on the read-out and high-voltage side of the chamber. The gas leakage rate is required to be below2n·10−8 barsl, for a chamber with n tubes at the 3 bar pressure [17].
2.3. BIS78 sMDT chamber assembly An in-plane alignment system consisting of two CCD cameras covered in boxes, four lenses in the middle of the chamber surface and two LEDs, is sused to monitor the deformation of the chamber during its operation [28].
Mechanical chamber assembly is followed by the installation of the hedgehog and mezzanine cards and mounting of the Faraday cage, whose details will be presented in the following section. The assembled chamber, before mounting the gas system and electronics, is shown in the Figure 2.8.
Figure 2.8.: An assembled sMDT chamber, with two multilayers of drift tubes separated by the spacer. The elements of the in-plane alignment system are marked [28].
Complete details about BIS-78 chambers such are the number of the tubes or length of tubes in each chamber can be found in sMDT Parameter Book [29].
2.4. BIS78 sMDT chamber electronics
2.4.1. High voltage side
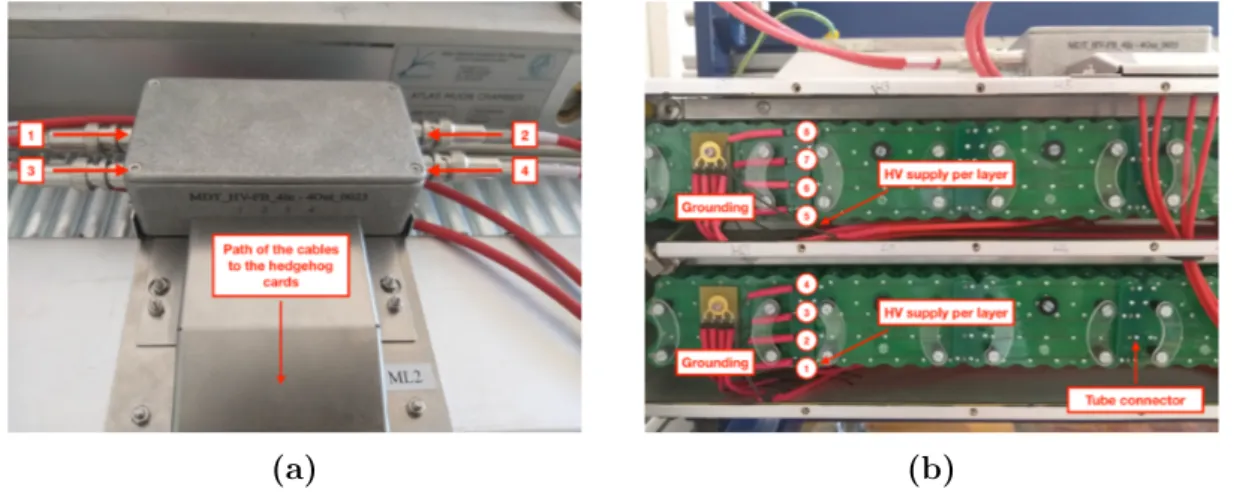
Two high voltage (HV) lines dedicated to each multilayer are split into eight using a HV splitter box. To eliminate possible electromagnetic pick-up by the cables, from the HV power supply to the splitter box, low-pass filters are implemented in the box. HV is distributed to the drift tubes via two on-chamber boxes, one for each multilayer, shown in the Figure 2.10a. From the on-chamber box, the HV is
(a) (b)
Figure 2.9.: HV side of the chamber: (a) One of boxes mounted to the chamber to dis- tribute HV to each layer, (b) Red cables providing HV and ground connec- tion.
distributed to each layer of drift tubes, by connecting the brought HV lines to the HV hedgehog cards, shown in the Figure 2.10. Each HV line is used for one layer of the tubes, therefore 4 layers×6 cards are connected to single hedgehog card.
(a) (b)
Figure 2.10.: HV hedgehog card (a) Connecting side to the tubes, with marked openings for the signal and grounding pins, (b) Components of the HV hedgehog card
2.4. BIS78 sMDT chamber electronics Beside providing necessary HV supply to the drift tubes, hedgehog cards enable se- cure grounding. HV is further carried from one card to the other with the connectors mounted to the hedgehog cards. Each hedgehog card contains terminating resistor, that suppresses signal reflection at the end of the open wire. It contains capacitors to prevent a short-circuit between the anode and the cathode by the termination resistor and protection components to ensure HV stability. The mounted hedgehog cards are enclosed in the Faraday cage.
2.4.2. Read-out side
On the read-out side, signal distribution boards with mezzanine cards are mounted and enclosed in the Faraday cage. The cross-section of the Faraday cage is shown in
Figure 2.11.: The layout of the Faraday cage on the RO side for BIS chambers [28]
the Figure 2.11. It consist of 0.5 mm thick chromatized aluminium walls, a 0.2 mm thick chromatized aluminium ground foil as a backplane of the Faraday cage and chromatized aluminium shielding plates placed between hedgehog and mezzanine cards on the read-out side. The ground screws between the tube layers as well as the ground pins enabling the connection to the signal distribution cards are indicated.
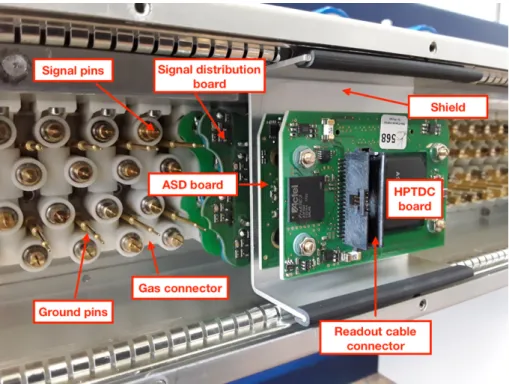
A single signal distribution hedgehog card capacitively decouples signal from 24 drift tubes and leads them to active read-out electronics component called mezzanine card (Figure 2.12), placed on the top of the hedgehog cards. The active read-out component consist of a board in the middle layer, carrying 3 ASD1 chips [30] and TDC2 chip with FPGA placed on the top layer. When a muon passes through the chamber, it generates the signal through the ionization process described in Section 2.1.
A block diagram of one of the eight channels in the ASD chip is shown in the Figure
1Amplifier - Shaper - Discriminator
2
Figure 2.12.: Readout side of the sMDT chamber
2.13. On the mezzanine cards, each ASD chip amplifies and shapes the raw signals from 8 sMDT tubes before sending it to the discriminator. The ASD chip can
Figure 2.13.: Block diagram of one ASD channel [31]
operate in two [30] modes:
• ADC mode (default) in which the width of the output signal represents the charge measured in the leading edge of the signal from the sMDT. The rising edge contains the timing information.
• Time-over-threshold (TOT mode)where the output logic signal is high as long as the shaped signal from the sMDT tube is above the chosen threshold value. Multiple threshold crossings are possible, while the rising edge of the first (main) pulse contains the timing information for the event.
2.4. BIS78 sMDT chamber electronics Parameter Nominal value ATLAS value Range Units
DISC1 Threshold -39 -39 -255 - +255 mV
DISC1 Hysteresis 2.5 8,75 0–19 mV
Wilkinson ADC int. gate 20 18.5 8-45 ns
DISC2 threshold 30 94 32–256 mV
Wilkinson discharge current 5.9 4.5 2.4–7.3 µA
Channel mode ON ON ON, HI, LO -
Operation mode ADC ADC ADC, ToT -
Table 2.2.: Programmable parameters of the ASD chip with nominal [30] and ATLAS valuse [26]
The programming of the ASD chip is done via a JTAG serial string that is passed from the CSM3 via the TDC chip. Discriminator threshold and hysteresis can be adjusted. Programmable parameters and nominal/ATLAS values are given in the Table 2.2, while more details about their settings can be found in the ASD Users Manual [30].
If the signal exceeds the pre-defined threshold value, a digital signal is sent to TDC to stop time measurement that was started when the particle passed through the detector. The TDC stores the arrival times of both leading and trailing edges of the signal in a buffer memory of 256 words. However, the leading edge of the pulse is important for the drift time measurement. To avoid multiple crossing of the threshold caused by the electrons arriving late from the same track, discriminator can be disabled for a chosen time (dead time).
The mezzanine cards are connected via the blue shielded twisted-pair cable to the on-chamber multiplexer known as the CSM which among others has functions of receiving the trigger, timing, and control signals from the TTC4 system and further delivering these signals to all mezzanine boards on the sMDT chamber. From the maximum 18 mezzanine cards, CSM multiplexes the serial data into a single output stream and delivers it via an optical fibre cable to the Data Acquisition (DAQ) system. [31].
Every MDT chamber has MDT-DCS module, which monitor chamber’s tempera- ture, magnetic field and is used to programme and configure front-end electronics on the CSM and Mezzanines Boards. The communication between computer and MDM module is established via a CAN-bus.
3Chamber Service Module
4
Part I.
BIS-78 sMDT chamber tests
Introduction
The sMDT chambers are designed with the purpose of precisely tracking muons, particles that can reach outer parts of the detector without significant energy loss. To verify chamber functionality, the detector can be exposed to muon beams, produced at accelerator facilities. Similar tests can be performed using cosmic rays. Primary cosmic rays, reaching Earth’s atmosphere from outside the Solar system, are mainly composed of high energy protons. In the interaction with the atmosphere, where atmosphere serves as a calorimeter, they create a shower of particles that reach Earth’s surface and are detectable. At the sea level, muons and neutrions are the most abundant particles and they can be studied with different experiments. Muons are created typically in the atmosphere at the hight of 15 km and they lose about 2 GeV in the ionisations processes on their way to the surface. The mean energy of muons at the Earth’s surface is ≈ 4 GeV. The integral intensity of vertical muons above 1 GeV/c at sea level isI ≈1cm−2min−1 for horizontal detector. The angular distribution of muons is a function of their energy. For muons with the energy of about 3 GeV the angular distribution at the surface is proportional tocos2(θ), where θ is the zenith angle. For lower energies the distributiuon becomes steeper, while it flattens at the higher energies [32].
For the purposes of this thesis, cosmic ray muons are used to verify functionality of the sMDT chambers. The main disadvantage of cosmic ray muons for such test is longer required measurement time due to the muon rates at the ground level, as well as the large number of low energy muons which can be prone to larger multiple scattering angles in the detector.
The measured quantities are:
• Noise rates, without and with applied high voltage;
• Spatial resolution of the chamber;
• Muon detection efficiency of each tube in the chamber.
3. Experimental set-up
3.1. Cosmic test stand
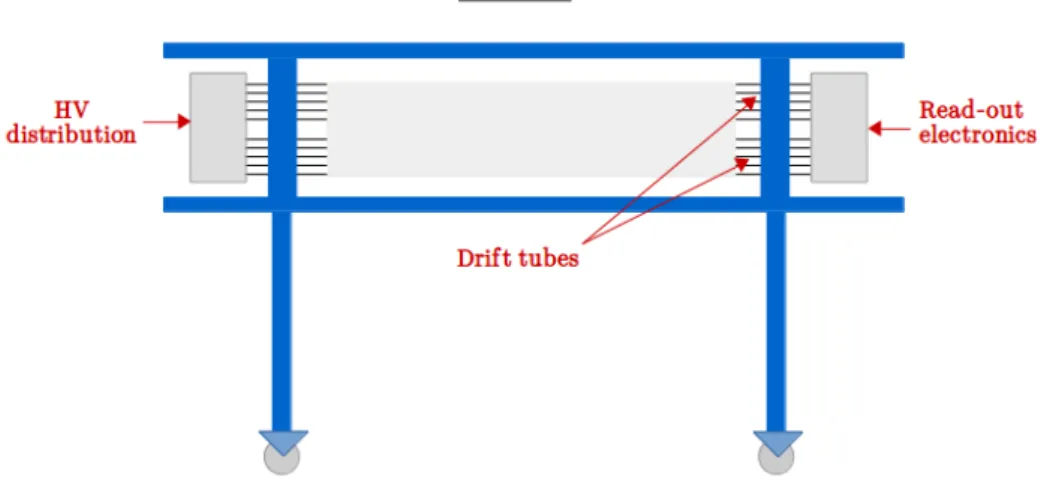
Eight A-side sMDT chambers are individually tested in the cosmic stand at Max Planck Institute for Physics in Munich, whose schematic detection set-up is shown in the Figure 3.1. The cosmic stand provides a computer controlled HV power supply.
Each chamber is equiped with a HV distribution on one side and a read-out system on the other side. Scintillating counters, needed to provide muon triggers, were placed in the direction perpendicular to the tubes at about 30 cm above the tested chamber. The test stand is equiped with a gas system to provide chosen ratio of the
Figure 3.1.: Schematic drawing of the cosmic stand at MPI for Physics.
Ar/CO2 gas mixture and manometer to monitor the pressure. In order to avoid the contamination of the gas in the chamber, since it significantly can change maximum drift time, chambers are first evacuated and then filled with the operational gas mixture, till the pressure in the chamber reaches 3 bar.
The set-up contains modules providing the trigger, a computer controlled HV supply for scintillating counters and manually controlled low voltage supplies needed for the read-out electronics.
3.1.1. Trigger and Read-Out Scheme
The trigger system of the experimental set-up consist of the types of triggers:
• Random trigger used for determination of the noise rates,
• Cosmic muon trigger used for spatial resolution and detection efficiency deter- mination.
The trigger scheme of the cosmic muon trigger at MPI is given in the Figure 3.2.
Two scintillating counters are used in coincidence to provide trigger on cosmic muons. Trigger logic is based on a set of Nuclear Instrument Modules (NIM) in the cosmic test stand set-up:
• 16 Channel Low Threshold Discriminator (Mod. N845) [33] which accepts 16 inputs, and provides 2×16 NIM outputs and 16 negated outputs. The discriminator thresholds are adjustable for every channel, in a range of −1 mV to−255 mV in the steps of 1mV,
• Triple 4- Fold Logic Unit (Mod. N405) [34] divided into three independent sections, each accepting up to four standard NIM inputs. Logic functions AND/OR and MAJORITY are available for each section. Each section pro- vides VETO input and 4 outputs: 2 normal, 1 negated and 1 linear.
• Dual Timer (Mod. N93B) [35] containing two identical trigger pulse genera- tors. The start of the trigger can be provided as an external signal or with the START switch, giving a standard NIM logic signal of−0.8V, while timer re-triggering is done by END MARKER funcion.
If signals from scintillating counters cross the chosen threshold value, the discrimi- nator sends logic signals to the logic unit. A trigger is generated only if two signals from the discriminator and the negated output of the previous trigger from the dual timer are in coincidence. The generated trigger signal is further sent to the TTC system with an internal clock of 40 MHz.
The read-out electronics scheme for the experimental set-up is given in the Figure 3.3. The TTC system distributes trigger signal and control information through the CSM to the chamber front-end electronics, which starts the data aqusition.
Programming and configuration of the CSM and mezzanine cards is done via the so-called ELMB module. A single BIS78 chamber may have either 648 or 744 drift tubes which corresponds to 27 to 31 mezzanine cards. Data are read out of each TDC individually via a 40 Mbit/sec serial link to two CSMs, where each multiplexes the 18 serial links into a single optical fiber used to transmit the data to the DAQ PC. Therefore, every chamber is tested with cosmic rays separatelly for each CSM.
3.1. Cosmic test stand
Figure 3.2.: Trigger scheme of the MPI test stand .
The random trigger for the noise measurement is provided directly from the dual timer, with fixed length and frequency, to the TTC system.
Figure 3.3.: The scheme of the sMDT read-out electronics .
4. Noise rate measurement
Noise rates are determined as a function of different threshold and hysteresis values, by providing radnom trigger signals to the CSM, which starts the measurement.
Signals exceeding pre-defined threshold value are counted. The measurement for the noise rates is performed for different thresholds, first without and then with applied high voltage, listed in the table 4.1.
Code Threshold value (mV)
103 -49
106 -43
108 -39
110 -35
112 -31
114 -27
Table 4.1.: Codes and corresponding threshold values used for noise studies.
The discriminator threshold values can be computed using following expression:
Threshold [mV]= (2∗N −255), (4.1) whereN is code number [30].
The noise rates are defined as:
noise rate per tube= events per tube
active time window×total number of triggers (4.2) and are determined for each tube in a chamber.
In addition to the predefined threshold value, adjustable hysteresis for the timing discriminator, based on a Schmitt trigger, is used to increase noise immunity. In cir- cuits with only one threshold input, noisy input signal near the predefined threshold value can cause multiple threshold crossings. With the discriminator hysteresis ap- plied, the effective threshold is higher and multiple threshold crossings are avoided.
The hysteresis is set by a4-bit code in following way:
Hysteresis=1.25 mV·N, (4.3)
whereN = 0,1, ..15[30]. Default hysteresis is given by code2, while ATLAS settings correspond to hysteresis 7. A threshold of -39 mV at a hysteresis of 2.5 mV corre- sponds to the signal created bt 20 primary electrons [30]. The noise measurements are performed for both hysteresis in off-cahmber anc on-chamber measurement.
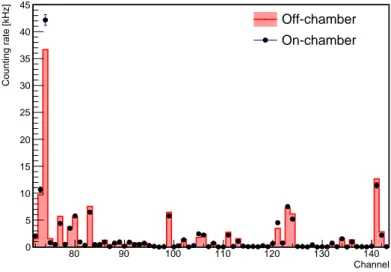
4.1. Off-chamber measurements
The ASD chips on mezzanine cards have threshold variations due to the production process. Therefore, to determine intrinsic noise levels, each card is tested individ- ually before the chamber assembly. The testing set-up is shown in the Figure 4.1.
The set-up consist of the HV and signal distribution system (hedgehog cards) and
Figure 4.1.: Testing set-up for the off-chamber noise determination
array of pins to establish connection between HV and read-out card and recreate on-chamber conditions. The entire set-up is placed in a Faraday cage, which pro- vides shielding from external influences that can have impact on measured values.
The test is performed for two hysteresis settings and six different thresholds listed in the Table 4.1.
4.2. On-chamber measurements
Once a chamber is fully assembled, the noise measurement is performed for the entire chamber in the cosmic ray test stand (Figure 3.1), for the first five thresholds from the Table 4.1. For comparison of the data with the off-chamber test, it is necessary to know the location of each mezzanine card on the chamber, which is ensured by knowing the identification code of each mezzanine card mounted to the chamber.
5. Drift tube calibration
5.1. Pedestal determination
The drift time spectrum measured with the chambers contained recorded incoming muons and noise component. Before determining the drift time, as a crucial step for the track reconstruction, the electronics noise contribution has to be eliminated.
This can be done using the ADC spectrum (Figure 5.1a), which corresponds to the collected charge. The majority of the electronics noise has a peak before the ADC spectrum. Therefore, the noise pedestal can be determined by fitting the ADC spectrum for the lowest threshold (-31 mV) obtained during noise measurement of each tube in the chamber with a Gaussian function, where the mean of the distribution represents the noise pedestal.
0 20 40 60 80 100 120 140 160 180 200 220
0.2*ADC counts [ns]
0 50 100 150 200 250 300 350
Counts
(a)ADC spectrum recorded for one tube in the A4 chamber
0 10 20 30 40 50 60 70 80 90 100
0.2*ADC counts [ns]
0 50 100 150 200 250 300 Counts 350
(b) Pedestal determination for one tube of the BIS-78 A4 chamber.
Figure 5.1.
The example of the ADC pedestal determination for one tube of the A4 chamber is shown in the Figure 5.1b, with µped = 25.54and σped = 0.68. For tubes with lower statistics in the ADC spectrum, where a pedestal determination fails, the mean of all other tubes in the chamber is used. Determined values are used to subtract the noise from the drift time spectra, by requiring that ADC count > µped + 3·σped, leaving only detected muon hits in the mesaured spectrum.
5.2. The drift time spectrum
To accurately measure drift radii it is required to have high drift time resolution.
However, the drift time tdrif t is not measured directly. It is obtained from the time measured by the TDC chip tT DC, which in used experimental set-up consists of several components:
tT DC =tdrif t+tdelay−ttrigg, (5.1) where:
• tdelay refers to the delay in the propagation of the sMDT signal in the tube from the track along the wire to the read-out electronics, as well as delay contributions due to the to the cabling and ront-end electronics;
• ttrigg is the time when the coincidence signal of several trigger detectors gives the start pulse for the read-out electronics.
The term t0 = tdelay −ttrigg is the same for all tubes. However, variations of few nanoseconds int0 values from tube to tube can exist. Therefore to determine drift time as tdrif t = tT DC −t0, t0 has to be determined for each tube individually. In order to do so, a fitting procedure for the drift spectra of the sMDT chambers has been developed to determine the start time of the measured time spectrum.
The rising edge fitting
The rising edge is fitted with the modified Fermi function:
G(t) =p0+ A0
1 +e−t−tT0, (5.2)
where A0 corresponds to the amplitude of the spectrum, 1/T corresponds to the slope of the function andp0 refers to uncorrelated noise due to accidental hits [36].
Drift-time spectra synchronization of the tubes in a muon chamber requires fitting this function G(t) to the rising edge of the drift-time spectrum for each individual tube and shifting it by−t0.
The falling edge fitting
The maximum drift timetm is determined by fitting the falling edge of the drift-time spectrum for each individual tube with the function:
H(t) =pmax+Amax+αm·t 1 +eTmaxt−tm
, (5.3)
where slowly falling regiont < tm is modelled by a straight line with interceptAmax and slope αmax, which is significatly smaller than the slope of the rising edge [36].
5.2. The drift time spectrum The functions G(t) and H(t) describe only rising and falling edge of the drift-time spectra and therefore cannot be used to fit the complete spectrum, but only chosen range. The maximum drift time depends on several environmental parameters in- cluding gas mixture and temperature and for its determination quality of the falling edge fit is important.
6. Spatial resolution
The spatial resolution determination is based on the difference in the measured drift radius and distance of the reconstructed muon track from the tube wire. Therefore, the first step is to reconstruct the trajectories of the detected cosmic muons.
6.1. Track reconstruction
To reconstruct the muon trajectory, the drift time is converted to the drift radius using rt function, which is represented as a circle with center on the anode, marking the surface corresponding to the measured position of the particle passage through the tube. Drift radii are marked as red dashed circles in the Figure 6.1. The drift radii are connected from each hit sMDT by a straight line that represents a tangent on each drift radius circle, to obtain the candidates for the muon track, since there can be more than one track fulfilling the previous condition. The track is defined as a line that minimizes the track residuals, which is the difference between drift radius (r) and the distance of the reconstructed muon track to the anode wire of the drift tube (d).
Figure 6.1.: Visualisation of the muon track reconstruction.
6.2. Spatial resolution determination
The spatial resolution of the chamber is determined as a function of the measured drift radius. For precise determination of the spatial resolution, it is necessary to know relative wire positions in the chamber. In the coordinate system of the chamber, the reconstructed track is given by the equation:
y =m·z+b, (6.1)
wherem represents the slope of the track (m= dzdy) and b is intercept on they axis.
Therefore, from the Figure 6.2, the distance of the reconstructed muon track in the k-th tube from the wire yk, can be computed as:
dk =|y−yk| ·cosα. (6.2)
where the cosα can be written as:
cosα= 1
√
1 + tan2α = 1
√1 +m2. (6.3)
After replacing expressions fory andcosα, distance of the reconstructed track from the wire can be computed as:
dk = |mzk+b−yk|
√1 +m2 . (6.4)
Figure 6.2.: Distance of the reconstructed track (greem arrow) from the tube wire.
Spatial resolution can be determined as:
σ=p
Var(δ)=p
Var(rk−dk), (6.5)
where δ represents track residuals. To derive the relation for the spatial resolution determination, two tubes are considered, such that they are above one another in
6.2. Spatial resolution determination alternating layers (tubes marked with yellow in Figure 6.3). For this method only vertical muon tracks are used. The difference between drift radii for two tubes right above one another is given as:
r2−r1 =d2−d1+δ2−δ1, (6.6) where we are interessted in the difference∆ =δ2−δ1:
∆ = δ2−δ1 =r2−r1−(d2−d1). (6.7) Difference bewteen distance of the reconstructed tracks in the case of two observed
Figure 6.3.: Tubes marked with yellow are considered for the spatial resolution determi- nation, in the case of vertical muon tracks.
tubesd2−d1 has different sign depending on the position of the reconstructed tracks, right or left from the anode wire:
• Tracks passing right from the wire (d1/2>0):
d2−d1 = m·(z2−z1)
√1 +m2 . (6.8)
• Tracks passing left from the wire (d1/2<0):
d2−d1 =−m·(z2−z1)
√1 +m2 . (6.9)
After plugging in expression ford2−d1:
∆ =r2−r1∓( m
√1 +m2(z2−z1)) (6.10)
To obtain spatial resolution we need V ar(∆) =V ar(δ2−δ1): V ar(∆) =V ar(δ2−δ1) = V ar(r2−r1∓( m
√1 +m2(z2−z1))), (6.11) Using the properties of the variance, whereV ar(δ2−δ1) =V ar(δ2) +V ar(δ1) and V ar(δ2) =V ar(δ1):
V ar(δ1/2) = 1
2 ·V ar(r2−r1∓( m
√1 +m2(z2 −z1))). (6.12) Therefore, combining the Equation 6.5 and assuming perfectly vertical track, spatial resolution could be computed as:
σ(r1/2) =σr2−r1
√2
. (6.13)
However, since reconstructed muon tracks have non-zero inclination, in the expres- sion above additional term is added, giving final expression for the spatial resolution determination, which can be used for tracks with incident angle close to0(requiring
|m <0.01|):
σ(r1/2) =σr2−r1
√2 ∓ m·(z2−z1) p2·(1 +m2)
. (6.14)
The error on √m·(z2−z1)
2·(1+m2) is small compared to the error on r2√−r21, because m is mea- sured with all tubes across the muon track, i.e. with a lever arm significantly larger thanz2−z1. The method used for the resolution determination has also the advan- tage that the trigger time ttrigg does not have to be known precisely as it cancels out in the expressionr2−r1 in the first order:
r2−r1 =r(t2)−r(t1)
=r(t1+ (t2−t1))−r(t1)
=r(t1) +r(t˙1)(t2−t1)−rt1
= ˙r(t1)(t2 −t1).
(6.15)
ttrigg cancels out in t2−t1 and r(t˙ 1)varies only slowly with t1 so thatttrigg does not have to be known with high precision.
7. Muon detection efficiency
An important quantity, when describing performances of the chamber, is the muon detection efficiency, which is the probability that drift tube will record hit, if a reconstructed track is passing through the tube. The muon detection efficiency can be determined for each tube in the chamber. To determine efficiency the following steps are performed:
Figure 7.1.: Visualisation of the efficiency determination. The excluded layer, containing the tube through which reconstructed track (green arrow) is passing and for which detection efficiency should be determined is represented in yellow.
• Reconstruction of the muon trajectory using recorded hits in the all tubes in an event;
• Exclusion of the one tube layer;
• Muon track reconstruction using the hits from the rest of the tubes in an event;
• Check if the tube in the excluded layer, through which reconstructed track is passing, has a hit;
• Repetition of the process for every tube in an excluded layer;
• Repetition of the process for every layer in a chamber.
The muon tracks are reconstructed by requiring minimum of four hits. The single tube efficiency tube is calculated as:
tube = nr. of detected hits in tube matching the reconstructed tracks
number of all reconstructed tracks crossing the tube , (7.1) where each reconstructed track crossing the invastigated tube increases the denom- inator by one, while additional detected hit in same tube belonging to the recon- structed track increases the numerator by one. Together with the single tube ef- ficiency, average chamber efficiency is determined as an mean of all single tube efficiencies in the chamber.
![Figure 1.1.: Complete view of the ATLAS detector. [4]](https://thumb-eu.123doks.com/thumbv2/1library_info/3999600.1540370/11.892.132.763.651.1023/figure-complete-view-atlas-detector.webp)
![Figure 1.4.: Computer generated image of the ATLAS Muons Subsystem [10]](https://thumb-eu.123doks.com/thumbv2/1library_info/3999600.1540370/15.892.195.699.123.499/figure-computer-generated-image-atlas-muons-subsystem.webp)