High detection sensitivity achieved with cryogenic detectors in combination with matrix- assisted laser desorption / ionisation time-of-flight mass spectrometry (MALDI-TOF MS)
P. Christ*, S. Rutzinger, C. Koya, W. Seidel, S. Uchaikin, M.O. Glockera and F. Pröbst
Max Planck Institut für Physik, Föhringer Ring 6, 80805 München, Germany
aProteome Center Rostock, Joachim-Jungius-Str. 9, 18059 Rostock, Germany
* correspondence to:
Peter Christ
Max Planck Institut für Physik Föhringer Ring 6
80805 München Germany
phone : +49 89 32354 473 fax: +49 89 3226704 email: christ@mppmu.mpg.de
Keywords:
cryogenic detector, time-of-flight mass spectrometry, MALDI, insulin, detection limit
List of abbreviations:
MS - mass spectrometer
MALDI - matrix-assisted laser desorption/ionisation ESI - electrospray ionisation
MCP - microchannel plate
STJ - superconducting tunnel junctions
NIS - normalconductor-insulator-superconductor SPT - superconducting phase-transition thermometer ADR - adiabatic demagnetisation refrigerator
SQUID - superconducting quantum interference device ACN - acetonitrile
TFA - trifluoroacetic acid
rhM-CSF ß - recombinant human macrophage –colony stimulating factor ß IgG – immuno globuline G
Abstract
Cryogenic detectors directly measure the impact energy of any impinging particle independent of its velocity. Thus a very high, mass-independent, detection efficiency is expected from their application in TOF-MS. The cryogenic detector applied here is based on a superconducting phase-transition thermometer and was implemented in a dual reflector time-of- flight mass spectrometer (N-geometry). A dilution series using standard sample preparation procedures shows that the detection limit for insulin (Mr: 5,734) can be decreased by several orders of magnitude, down to 0.5 amol on the MALDI target. Detection limits for rhM-CSF ß (Mr: 49,032) and for polyclonal IgG (Mr: ca. 150,000) in the high femtomole and low picomole range, respectively, were established.
Introduction
Time-of-flight - mass spectrometry (TOF-MS) is a widespread and important technique for the study of biomolecules. In conventional mass spectrometers microchannel plates (MCP) are used as detectors, exhibiting a very good performance for small ion masses, up to about 20 kDa.
The detection mechanism relies on the primary ionisation of the impinging molecule, which however decreases with decreasing speed of the molecules. For this reason the sensitivity of MCPs decreases drastically for very large, and thus very slow, molecules 1, 2. The development of 'soft' ionisation methods like matrix-assisted laser desorption / ionisation (MALDI) 3, 4 and electrospray ionisation (ESI) 5 allows for the launching of large unfragmented biomolecules.
MALDI produces ions with only a few charges on the molecules, whereas in ESI multiple charges are deposited on the analyte molecule. For the MALDI-MS investigation of macromolecules (e.g. above 100 kDa), or for quantitative comparisons over a wide mass range, the limits of the MCPs are reached and detectors with a mass-independent detection sensitivity are desireable. Commercial mass spectrometers equipped with MCP detectors exhibit a detection limit in the low femtomol range 6, 7.
A potentially very beneficial technique for ion detection is the application of cryogenic detectors, which was first realized in 1996 by Twerenbold 8. Cryogenic detectors are highly sensitive energy resolving particle detectors with increasing numbers of applications in fundamental 9 and applied science 10, 11. In contrast to MCPs they feature a mass-independent detection efficiency of 100% on impact, leading to a high detection sensitivity. Furthermore they provide information on the energy of the impinging ions. The latter can be used to resolve ambiguities due to higher charge states or to obtain additional information on fragmentation 12. The first generation of cryogenic detectors used in mass spectrometers were superconducting tunnel junctions (STJ) 2, 13 or normal conductor-insulator-superconductor (NIS) tunnel junctions
14. With these detectors a reasonable time- and accordingly mass-resolution can be achieved, although they exhibit the disadvantage of a very small impact-sensitive area, in the range of only
a few hundred µm squared. For our experiments we use a different type of cryogenic detector based on a superconducting phase-transition thermometer (SPT). This provides a relatively large detector area of 3 x 3 mm², at the moment at the cost of some time resolution. Here we describe the first results on the analysis of proteins using this newly developed cryogenic detector, designed for its integration in a dual reflector MALDI-TOF mass spectrometer.
Experimental
Our cryogenic detector is composed of a SPT consisting of a superconducting Ir/Au – film, completely covering one side of a sapphire substrate of dimensions 3 x 3 x 0.5 mm³ . The ions delivered by MALDI were shot directly onto the superconducting film. Its area of 3 x 3 mm² is the sensitive area of the detector. The ion impact was confined to a circle of 3 mm diameter by an aperture in front of the detector. This aperture was cooled to the operating temperature of about 80 mK in order to reduce the heat load on the detector from thermal radiation from the MS. The diameter of the ion beam at the position of the cryogenic detector is about 1 cm. Our cryogenic detector thus detects about 10% of the ions in the beam. The diameter of the beam was determined with an MCP detector mounted at the position of the cryogenic detector with an adjustable iris diaphragm in front of it. The transition-temperature of the superconducting film, as measured with small readout current, is about Tc = 130 mK. Due to the heating effect of the readout current used for particle detection the detector was operated at a lower cryostat temperature, approximately 80 mK. A high speed superconducting quantum interference device (SQUID) together with a readout scheme described in 9, 15 is used to measure the detector signals.
A liquid-helium cryostat with a two stage adiabatic demagnetisation refrigerator (ADR) was used to cool the detector. Its base temperature is approximately 35 mK, and working cycles of almost two working days at the operating temperature (≈ 80 mK) are achievable. The cryostat
is coupled to the mass spectrometer via a snout which is provided with thermal radiation shields, and several apertures inside the 4.2 K radiation shield minimise the heat radiation from the spectrometer onto the cryogenic detector.
The MALDI-TOF mass spectrometer is a custom-made dual reflectron instrument with N- geometry 16, with an accelerating voltage of up to 18 kV, a deflection of light masses, and the possibility of time lag focusing (Figure 1a). It is constructed so as to minimise the heat radiation onto the cryogenic detector. A MCP can be optionally inserted into the ion beam in front of the second reflector for test purposes. The pressure in the spectrometer is ≈ 5 10-8 mbar in the ion source and well below 10-8 mbar in the flight path. At each laser pulse (337 nm, 3 ns) the output of the SQUID amplifier was recorded using a 25 MHz 12 bit transient recorder. The recorded data were stored and analysed off-line (Figure 1b). The complete setup, especially the SPT cryogenic detector is described in more detail elsewhere 17, 18.
For the sample preparation, at first, a stock solution of insulin (Sigma Aldrich) with a concentration of 1 pmol/µL was prepared and diluted stepwise down to 0.1 amol/µL. Each ten- fold dilution was performed by using a new pipette tip to transfer 10 µL of the more concentrated solution to a new, clean tube filled with 90 µL of the solvent. To assure good mixing the solutions were vortexed between every step.
Then the following sample preparation methods were used: 1) A matrix solution is prepared from a saturated sinapinic acid solution, suspended in an aqueous 60% acetonitrile (ACN) / 0.1% trifluoroacetic acid (TFA) solution. 1 µL of the insulin solution is mixed with 2 µL (or 1 µL for insulin solutions with a concentration < 10 fmol/µL) of this matrix solution on the target. After evaporation of the solvent uniform crystals are found distributed over an area of approximately 3 mm diameter. 2) For a second preparation method 10 mg of gentisic acid (2,5- dihydroxybenzoic acid, DHB) is dissolved in 1 mL of a solution containing isopropanol / water / formic acid in the ratio of 2:3:1. Then, 1 µL of this matrix solution is spotted on the target. After approximately 2 s, the remaining liquid is removed and discarded. Subsequently 0.5 µL of the
insulin solution and a further 0.5 µL of the matrix solution are mixed onto the target and allowed to dry in air.
To extract a precise TOF mass spectrum from the detector signals, the exact onset time of each pulse has to be determined. Presently this is done off-line using a filtering procedure illustrated in Figure 1b. The original (grey) and high frequency band-pass filtered (black) data of a single laser shot are shown. The onset of pulses are detected by peaks in the filtered data (arrows). After an onset has been found, we return to the original (grey) data, and the height of the pulse is determined. The point were the signal reaches 20% of the pulse height is then defined as the onset time. Problems due to signal saturation by pile-up of pulses have not been observed in the mass range of interest, as long as matrix molecules were deflected and an appropriate laser power was used. To obtain a spectrum, the onset times extracted from several laser shots (usually 100 - 2500) are collected in a histogram. The uncertainty with which the time-of-flight (onset time) can be determined depends on the rise time of the detector signal and the signal-to-noise ratio. Currently our detectors exhibit rise times between 1 and 2 µs. With a typical signal-to-noise ratio of about 3 this results in a time resolution of slightly above 1 µs 17, 18. In our setup this translates into an achievable peak width (FWHM) ∆m for the mass of about 75 Da at m ≈ 6 kDa and of 300 Da at m ≈ 100 kDa respectively. While this resolution may be considered poor in the low mass range, at high masses above 100 kDa, where the mass peaks are broadened by several other effects, it is not the dominant factor in the mass resolution.
The rise time of the signals is practically independent of the sensitive area for the present type of cryogenic detector. This is because the energy spreads in the film from the impact point slowly by diffusion while escape into the substrate is fast. At our relatively high operating temperatures (≈ 80 mK) this escape is so fast that only a small spot of the film is heated. Thus the resistance rise constituting the signal is from a small spot. However, to first approximation the signal is proportional to the relative rise of the total film resistance, which decreases with increasing area of the film for a given energy deposition. The degradation of time resolution with
increasing size would therefore be to a large extent due to the reduction of the signal to noise ratio with size. However, the present detector shows a relatively poor signal-to-noise ratio presumably caused by some presently not well understood excess noise, perhaps connected with the quality of the superconducting film, which in turn determines the pinning of the magnetic flux structures in the film. By getting this excess noise under control we intend to improve the time resolution of the detector by an order of magnitude.
Results and Discussion
One of the benefits expected from the application of cryogenic detectors in TOF-MS is a much higher detection sensitivity. In the experiments described here it was very important that sensitivity determinations were not affected by variations in the samples. For this reason insulin was chosen for the dilution series since it is a commercially available standard protein allowing a very reliable and reproduceable sample preparation for MALDI-MS. In addition, the molecular structure of insulin is well described, with a well defined molecular mass. Furthermore, insulin molecules suffer very little from post source decay and can therefore be focused efficiently in reflector devices. The use of a dual reflector instrument setup (Figure 1a) reduces thermal background on the detector.
To investigate what quantity of insulin on the MALDI target is necessary to produce a molecular ion signal, dilution series experiments were carried out (Figure 2). Each spectrum was summed from 2000 - 2500 laser shots. A significant insulin signal (at 5,734 Da) is observed down to a total amount of 1 amol on the MALDI target. Even with 0.1 amol on the target spectra can be recorded that show a M+ ion signal. However, laser power had to be considerably higher for the highly diluted samples.
This result was even improved by further experiments using DHB instead of sinapinic acid as matrix. Spectra are easily recorded with 0.5 fmol and 0.5 amol on the target (Figure 3). Each of these two spectra represent the sum of approximately 1200 laser shots. These measurements
were reproduced several times using both new stock solutions and dilution series of insulin.
The most obvious way to verify the higher detection sensitivity of the cryogenic detector is by a direct comparison with a MCP in the same instrument. Thus, further measurements with the cryogenic detector and a MCP (the optional MCP between the two ion mirrors, see Figure 1a) were performed (Figure 4). The same samples were used and the laser power was kept constant to rule out effects from sample preparation or ion formation as far as possible. For the spectra between 500 fmol and 500 amol the laser power was kept constant, and slightly increased for the measurements with 0.5 amol. In agreement with standard instruments, spectra down to the low femtomole range can be detected with the MCP. Using the cryogenic detector, however, even 0.5 amol total amount of insulin on the MALDI target produces a signal (Figure 4). This result demonstrates that as few as about 5 hits by analyte molecules on the detector create a reasonable peak.
Concerning sample preparation, it turned out that cleaner and more reliable spectra were produced when using DHB as matrix, especially with low sample quantities. Our tests were performed using standard sample preparation procedures that are commonly applied. However, it should be noted that sample preparation can have a significant effect on sensitivity. In 1994 S.
Jespersen et al. reported an almost comparable detection sensitivity to ours of 2.5 amol (at m/z ≈ 1000) total amount on the MALDI target, with conventional detectors but with an improved sample preparation technique, so called picolitre vials 19 . They report an even higher sensitivity in the upper zeptomole range which was obtained from an estimate of the sample consumption per acquired spectrum.
It should be noted that in most of our measurements, especially for the spectra with 1 fmol of insulin or less on the target, only about 10% of the laser shots generated one or more ion signals (Table 1). Hence, the whole sum of ion signals in the spectrum results only from several tens of laser shots, presumably from 2 - 4 so called 'sweet spots' on the target. Evidently with high dilutions analyte molecules become scarcely available for desorption. Hence improved
sample preparation methods become more and more critical when approaching very low sample quantities.
It will be noted that the number of ion signals recorded does not change significantly despite the decreased amount of analyte, as the dilution varies over 7 orders of magnitude (Figure 2 or Table 1). This may seem unexpected. However, this probably can partially be explained by the different laser power, which had to be adjusted for each run to get a reasonable ion count rate. In other words, for high concentrations (pmol and high fmol range), spectra were recorded using a very low laser power to avoid pile up and saturation effects of the detector.
Thus, with decreasing amounts of analyte it was necessary to stepwise increase the laser flux to receive sufficient ion signals. Similar effects were already observed by others 19. Additionally, also the spectra from ‘high sample amount’ preparations were obtained from a few ‘sweet spots’, that were found easily at these high concentrations.
This argumentation is supported by the data presented in Figure 4 where the upper four spectra have been recorded with the same laser power. There is a clear increase of the number of insulin hits from 5 fmol to 500 fmol. The extremely broad peak at 500 fmol is due to saturation of the cryogenic detector (Figure 4, Table 1). Nevertheless, a complete clarification of this effect still needs further investigation.
It must also be considered that the path of the ions between desorption and detection involves passage through two reflectors. The charged fragments of molecules undergoing post- source decay may be so strongly defocused in the reflectors so that they are not contributing to the signal any more. The decrease of the rate of post-source decays with flight time implies that most fragmentations occur in the first field-free flight path before the first reflector. Despite these instrumental limitations, we decided also to test the performance of our instrument with proteins of higher masses. First we selected rhM-CSF ß as a model protein with high mass, since it is well described and thoroughly characterized on the molecular level 20-23. In brief, rhM-CSF ß is a disulfide-linked homodimer with a known molecular composition and, correspondingly, with
a well-defined molecular mass of 49,032 Da. Thus, rhM-CSF ß fulfills the requirements for our studies as did insulin. Using this protein, we were able to instantly detect ion signals with only 800 fmol on the target, with no optimisation of the sample preparation procedure (Figure 5a). We observed singly and doubly charged ions, consistent with earlier reports with standard instruments 21. To our knowledge, previous MALDI-MS measurements with rhM-CSF ß on regular MALDI-linear TOF-MS instruments with MCPs required at least picomole quantities 21.
Encouraged by these results, we also measured IgG proteins (Mr: ca. 150,000) using the above described sample preparation procedure. However, polyclonal IgG represents a mixture of molecules for which only an average molecular mass can be obtained. This fact has to be taken into account, when aiming at single molecule mass measurements. In our experiments, singly and doubly charged IgG molecular ions were detected with 12 pmol deposited on the MALDI target (Figure 5b). We did not determine the amount of losses of molecules during passage of the TOF system. To our knowledge, this is the first report showing that IgG molecular ions can be detected after passing two reflectors.
Conclusions and Outlook
Our measurements show that cryogenic detectors can enhance the detection sensitivity of MALDI TOF-MS by several orders of magnitudes. With our dual reflector instrument quantities as low as 0.5 amol insulin on the MALDI target give significant ion signals. Note that no specialized sample preparation procedures were applied. However, the mass resolution is not yet competitive in the lower mass range.
As mentioned above, in most of the measurements only about 10% of the laser shots exhibit one or more ion signals and in addition the insulin signal does not change significantly with the decreasing amount of analyte on the target. Probably this effect can be explained by the different laser power used in each measurement. For the high concentration range it was necessary to decrease the laser power for high concentrations to avoid pile up and saturation
effects of the detector. With decreasing concentration the laser power was increased to keep the number of ion signals at a reasonable level. Nevertheless this phenomenon has to be clarified in further experiments.
With further development in instrument design and cryogenic detector technology, predominantly concerning mass resolution, we expect the cryogenic detector becoming an interesting technique leading to substantial improvements in the detection limits of TOF mass spectrometry.
Acknowledgements
We thank Prof. Thiesen from the University of Rostock for initiating this project.
The project is funded by the Bundesministerium für Bildung und Forschung (BMBF) of the Federal Republic of Germany (FKZ 01 GG 9832).
References
1. G. Westmacott, M. Frank, S. E. Labov, and W. H. Brenner, Rapid Commun. Mass Spectrom. 14, 1854-1861 (2000)
2. D. Twerenbold, D. Gerber, D. Gritti, Y. Gonin, A. Netuschill, F. Rossel, D. Schenker, J.
Vuilleumier, Proteomics 1, 66-69 (2001)
3. K. Tanaka, H. Waki, Y. Ido, S. Akita, Y. Yoshida, Rapid Commun. Mass Spectrom. 2 (8), 151-153 (1988)
4. M. Karas, F. Hillenkamp, Anal. Chem. 188, 2299-2301 (1988)
5. J. B. Fenn, M. Mann, C. K. Meng, S. F. Wong, and C. M. Whitehouse, Mass Spectrom.
Rev. 9, 37-70 (1990)
6. K. Hakansson, R. A. Zubarev, P. Hakansson, V. Laiko, and A. F. Dodonov, Rev. Sci.
Instr. 71, 36-41 (2000)
7. S. Ptasinska, L. Michalak, and M. Smolira, Rapid Commun. Mass Spectrom. 17, 917-923 (2003)
8. D. Twerenbold, Nuclear Instruments and Methods A 370, 253-255 (1996)
9. G. Angloher, M. Bruckmayer, C. Bucci, M. Bühler, S. Cooper, C. Cozzini, P. DiStefano, F. von Feilitzsch, T. Frank, D. Hauff, Th. Jagemann, J. Jochum, V. Jörgens, R. Keeling, H. Kraus, M. Loidl, J. Marchese, O. Meier, U. Nagel, F. Pröbst, Y. Ramachers, A.
Rulofs, J. Schnagl, W. Seidel, I. Sergeyev, M. Sisti, M. Stark, S. Uchaikin, L. Stodolsky, H. Wulandari, L. Zerle, Astroparticle Physics 18, 43-55 (2002)
10. M. Frank, Proceedings of the 7th Intl. Workshop on Low Temperature Detectors (LTD-7), Munich, 78-81 (1997)
11. B. Simmnacher, R.Weiland, E. Langer, M. Bühler, J. Höhne, C. Hollerith, Conference Proceedings of the 28th International Symposium for testing and Failure Analysis (ISTFA), Phoenix/AZ, 87 (2002)
12. M. W. Rabin, G. C. Hilton, and J. M. Martinis, J. Am. Soc. Mass Spectrom. 12, 826-831 (2001)
13. M. Frank, C. A. Mears, S. E. Labov, W. H. Brenner, D. Horn, J. M. Jaklevic, A. T.
Barfknecht, Rapid Commun. Mass Spectro. 10, Issue15, 1946-1959 (1996)
14. G. C. Hilton, J. M. Martinis, D. A. Wollmann, K. D. Irwin, L. L. Dulcie, D. Gerber, P. M.
Gillevet, and D. Twerenbold, Nature 391, 672-675 (1998)
15. S. V. Uchaikin, P. Christ, F. Pröbst, S. Rutzinger, and W. Seidel, Physica C 367, 295-297 (2002)
16. Stefan Kaesdorf Geraete fuer Forschung und Industrie, Gabelsberger Str. 59, D-80333 München, Germany
17. S. Rutzinger, P. Christ, F. Pröbst, W. Seidel and S. Uchaikin, LTD-10, Proceedings of the
10th International Workshop on Low Temperature Detectors, Genua, (2003) 18. S. Rutzinger, PhD. Thesis, Technische Universität München (2003)
19. S. Jespersen, W. M. A. Niessen, U. R. Tjaden, J. van der Greef, E. Litborn, U. Lindberg, and J. Roeraade, Rapid Commun, Mass Spectrom. 8, 581-584 (1994)
20. M. O. Glocker, B. Arbogast and M. L. Deinzer, J. Am. Soc. Mass Spectrom., 6, 638-643 (1995)
21. M. O. Glocker, M. Kalkum, R. Yamamoto and J. Schreurs, Biochemistry, 35, 14625- 14633 (1996)
22. H. P. Happersberger, J. Stapleton, C. Cowgill and M. O. Glocker, Proteins, Struct. Funct.
Genet., Suppl. 2, 50-62 (1998)
23. H. P. Happersberger, C. Cowgill, and M. O. Glocker, J. Chromatogr. B, 782, 393-404 (2002)
Figure Captions
Figure 1: a) Schematic of the dual reflector MALDI-TOF mass spectrometer equipped with a SPT cryogenic detector. b) Raw data from a single laser shot with two signals (arrows) from impinging ions detected.
Figure 2: Mass spectra from a dilution series of insulin with sinapinic acid (SA) used as matrix.
The total amount of insulin on the target was reduced by an order of magnitude at each step from 1 pmol down to 0.1 amol. Charge state is indicated.
Figure 3: Mass spectra of insulin using DHB as matrix. Total amount of insulin on the target is 0.5 fmol and 0.5 amol respectively. Charge state is indicated.
Figure 4: Mass spectra of insulin using DHB as matrix. Measured from the same samples with the cryogenic detector and a MCP detector (optional MCP, see Figure 1a) in comparison. The laser power was kept constant for the measurements with 500 fmol, 50 fmol, 5 fmol and 500 amol total amount of insulin on the target. For the spectra with 0.5 amol total amount a slightly higher laser power was used. The broad cryogenic signal with 500 fmol is due to saturation.
Figure 5: Mass spectra of a) rhM-CSF β (M ≈ 49 kDa) and b) IgG (M ≈ 150 kDa) using DHB as matrix. Total amount of rhM-CSF β and IgG on the target is 800 fmol and 12 pmol, respectively.
Each spectrum results from approximately 2000 laser shots. Charge states are indicated.
Figure 1a
Figure 1b
Figure 2
Figure 3
Figure 4
Figure 5
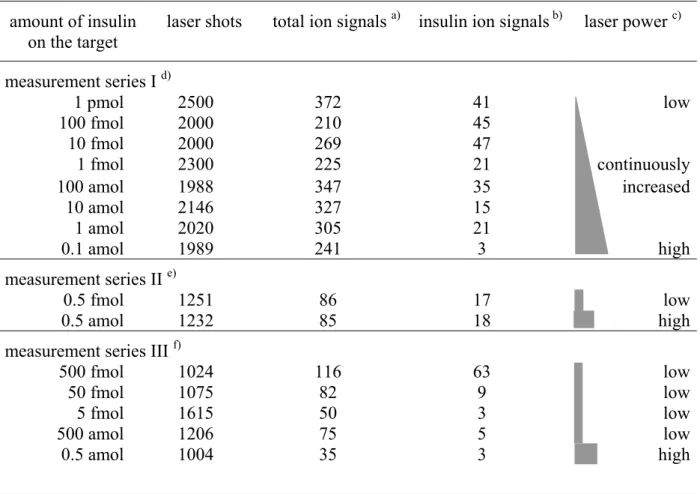
Table 1: Number of laser shots and number of detected ion signals per spectrum.
amount of insulin
on the target laser shots total ion signals a) insulin ion signals b) laser power c) measurement series I d)
1 pmol 2500 372 41 low
100 fmol 2000 210 45
10 fmol 2000 269 47
1 fmol 2300 225 21 continuously
100 amol 1988 347 35 increased
10 amol 2146 327 15
1 amol 2020 305 21
0.1 amol 1989 241 3 high
measurement series II e)
0.5 fmol 1251 86 17 low
0.5 amol 1232 85 18 high
measurement series III f)
500 fmol 1024 116 63 low
50 fmol 1075 82 9 low
5 fmol 1615 50 3 low
500 amol 1206 75 5 low
0.5 amol 1004 35 3 high
a) Ion signals from the entire recorded mass range.
b) Number of ion signals within the FWHM of the singly charged insulin peak.
c) Laser power is given qualitatively since it was optimized for every measurement, i.e. it had to be decreased for high concentrated samples to avoid saturation of the detector.
d) see fig.: 2; SA was used as matrix.
e) see fig.: 3; DHB was used as matrix.
f) see fig.: 4; DHB was used as matrix.