87 United Kingdom Energy from Waste Statistics
Country Reports
United Kingdom Energy from Waste Statistics
Chris Jonas
1. Summery observations ...88
2. Market overview ...89
3. Waste inputs ...90
4. Energy ...93
5. Operations ...97
6. Compliance ...100
7. Capacity development ...102
8. Data Sources ...105 Tolvik’s fifth annual report on the UK Energy from Waste (EfW) sector brings together data from a range of sources into a single document. Following engagement with the Environment Agency, Environmental Services Association and individual EfW opera- tors, there is a clear movement towards increased standardisation in reporting (largely via the Annual Performance Reports (APR) prepared by operators in accordance with permit requirements). To some extent 2018 represents a transition period between the new reporting systems and the old.
For the first time, it is reported on compliance, including emissions to air. Previously analysis was excluded from the report due to data uncertainty; but here too there has been movement, in England at least, towards consistent reporting. Given the significance of emissions to stakeholders, there is merit to further develop this area of analysis in subsequent editions of this report.
This year references to gate fees have been excluded as this will be subject to a separate report planted to be released later in 2019.
As previously, the focus of this report is upon conventional moving grate EfWs and Advanced Conversion Technology (ACT) facilities generating energy from the combus- tion of Residual Waste. Residual Waste is defined as non-hazardous, solid, combustible mixed waste which remains after recycling activities. This definition is a little broader than that for Municipal Waste but primarily includes wastes falling within European Waste Catalogue (EWC) 19 12 10, 19 12 12 and 20 03 01. The report continues to exclude EfW facilities in Jersey and the Isle of Man, cement kilns and facilities solely processing Waste Wood or other biomass wastes.
Copies of this report can be downloaded via www.tolvik.com. Third parties are entitled to freely use the contents of the report, subject to appropriately acknowledging its source.
Chris Jonas
88
Country Reports
1. Summery observations
• In 2018 the tonnage of Residual Waste processed at EfWs in the UK was up 5.6 % to 11.5 Mt;
• At the end of 2018, there were 47 EfWs operational or in late commissioning and 15 EfWs in construction. The long term projected EfW capacity based on EfWs which were operational or in construction increased during the year by 0.9 Mt when compared with 2017. The increase was a result of a combination of new projects and increases in consented capacity at existing facilities;
• In preparing this report we have identified a number of market themes.
Poor turbine reliability
The stand out operational issue for 2018 was that total power export was unchanged on 2017 despite increased inputs. This was due to at least 6 EfWs experiencing significant turbine difficulties during the year. The key question is whether this poor reliability was a blip or part of a longer term trend.
Challenges around commissioning and early operations for new technologies and less experienced operators
EfW inputs in 2018 were significantly lower than we projected in the 2017 report. This was due to significant commissioning delays on a number of projects.
As at January 2019, the 3 ACTs which commenced construction in the period 2012 to 2014 had an average construction period of 63 months with an average delay to take- over of 19 months. For the 6 EfW/ACT starting construction in 2015 the equivalent figures were an average 42 months construction with an average of 17 months delay.
We believe it is highly likely that there will be project failures in 2019, if nothing else as a result of the exhaustion of construction phase cashflows.
Build it and they will come ….?
In the last 12 months, 2 EfWs reached financial close where the project was based on a long term Residual Waste supply contract with an aggregator (for whom underlying contracts are typically relatively short term). This suggests strong investor confidence in the project’s future waste sourcing strategies.
Optimisation initiatives are progressively increasing capacity
For the 15 EfWs which became fully operational in the period 2012 to 2017, on average 2018 Residual Waste inputs were 4.4 % higher than the average over the preceding 3 years.
Increased focus on managing the calorific value of waste feedstocks
The composition of Residual Waste in the future will depend on how individual Local Authorities respond to DEFRA’s Waste and Resources Strategy [5]. Whilst on average across all operational EfWs material year-on-year changes in calorific value are unlikely, smaller EfWs dependent on a limited number of Local Authority suppliers for their tonnage could be adversely impacted.
89 United Kingdom Energy from Waste Statistics
Country Reports
Existing consents (both planning and permits) will continue to be increased Permits and planning consents continue to be increased for existing EfWs – by as much as 20 % over the original consented capacity, reflecting operational optimisation and providing EfW operators with additional flexibility.
Cyclical pattern of EfW construction New orders for EfWs seem to follow 3 yearly cycles, 2012/13, 2015/16 and based on the last 9 months activity, 2018/19. This can create a challenge for specialist contractors with multiple projects at a similar stage of development and commissioning.
Efficiency and heat in focus Operators continue to seek heat offtake opportunities and export continues to rise steadily. The most recent example being Wilton 11 which exported 100 GWh of heat.
Our expectation is that this will continue but with specific exceptions in the near term industrial heat solutions are likely to be the more deliverable.
Incineration tax will increasingly become a subject of debate Hansard’s record of parliamentary affairs recorded 9 references to Incineration tax in 2018, compared to nil during the preceding 3 years. By end of March 2019 there were 5 references. The debate will no doubt continue.
2. Market overview
The EfWs falling within the scope of this report are listed in Appendix 1.
(Website version)
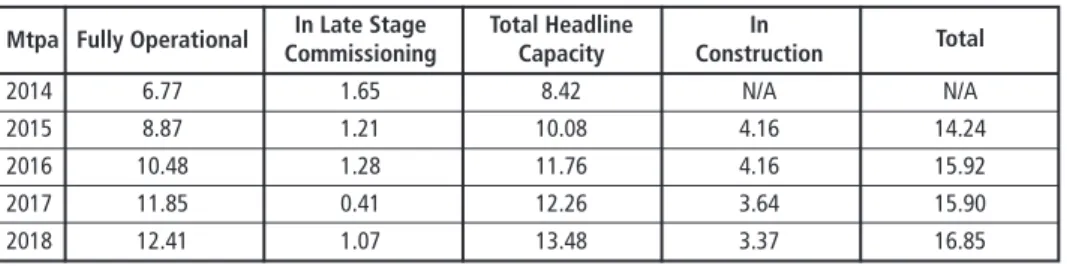
As at December 2018 there were 42 fully operational EfWs in the UK, with a further 5 EfWs accepting waste during the year as part of late stage commissioning. As a result, total Headline Capacity was 13.48 Mtpa. At the same time there was a further 3.37 Mtpa of EfW capacity either in construction or about to commence construction.
The 6 % increase in total Headline Capacity in 2018 was a result of 4 EfWs reaching financial close during 2018 together with modest increases in consented capacity at several operational EfWs.
Table 1: Headline capacity (as at December 2018)
Mtpa Fully Operational In Late Stage Total Headline In
Commissioning Capacity Construction Total
2014 6.77 1.65 8.42 N/A N/A
2015 8.87 1.21 10.08 4.16 14.24
2016 10.48 1.28 11.76 4.16 15.92
2017 11.85 0.41 12.26 3.64 15.90
2018 12.41 1.07 13.48 3.37 16.85
Chris Jonas
90
Country Reports
Figure 3 shows the capacity-weighted average age of UK EfWs.
2018 was the second consecutive year in which there was an increase in the overall average age, reflecting that as the total EfW capacity in the UK increases, the impact of newly operational EfWs on the average age is proportionally less significant.
It is worth noting that 1.24 Mt of Headline Capacity was built in the 1970’s with the next oldest EfW reaching its 25th opera- tional anniversary this year.
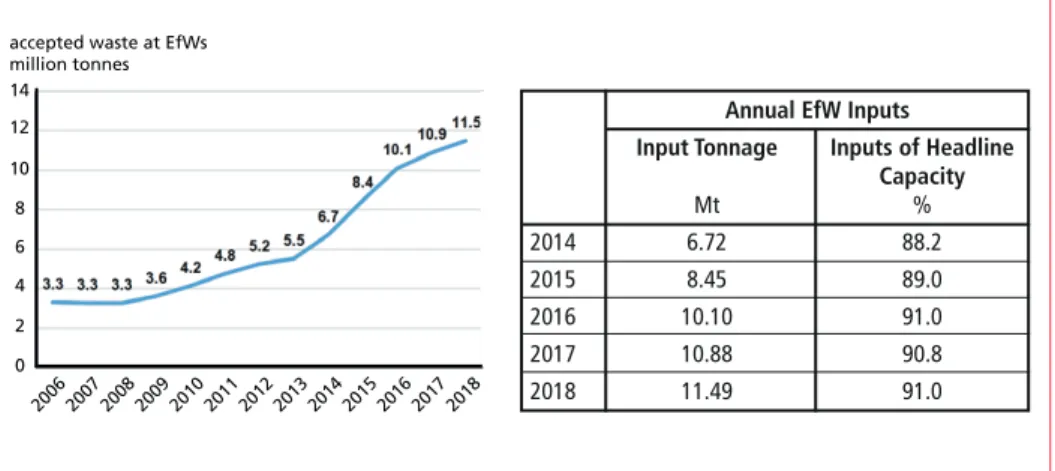
In 2018 a total of 11.49 Mt of Residual Waste was processed in UK EfWs, an increase of 5.6 % on 2017. Not unsurprisingly, as in 2017, the rate of growth has continued to slow down from the 2013 – 16 peak.
Total inputs were the equivalent, for EfWs operational throughout the year, to 91 % of the total Headline Capacity – not dissimilar to the figure for previous years.
The role of EfW in the UK residual waste market
In 2018 it is estimated that Residual Waste inputs to EfWs in the UK represented 41.8 % (2017: 39.5 %) of the overall UK Residual Waste market.
It was projected in the 2017 report that 2018 would see the tonnage of Residual Waste sent to EfW in the UK exceed the tonnage sent to landfill – however this proved not to be the case as a result of the commissioning challenges faced by a number of EfWs during the year (see Section 1).
It is estimated that in 2018 RDF Exports from the UK declined by around 8 % when compared with 2017.
0 5 10 15 20 25 30 35 40 45 50
2014 2015 2016 2017 2018
fully operational EfW facilities
number
commissioning
26 32 37 40 42
7
5 4 2 5
Figure 1: Number of EfW facilities
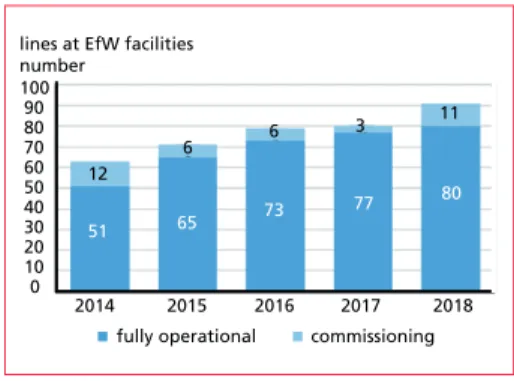
0 1020 30 40 50 60 70 80 90 100
lines at EfW facilities number
2014 2015 2016 2017 2018
fully operational commissioning
51 65 73 77 80
12
6 6 3 11
Figure 2: Number of lines at EfW facilities
3. Waste inputs
9.0 9.5 10.5 10.0 11.0 11.5 12.0 years
2014 2015 2016 2017 2018
11.7 10.5
9.7 10.7
11.4
Figure 3: Weighted average age by capacity (as at December 2018)
91 United Kingdom Energy from Waste Statistics
Country Reports
Figure 4: Total tonnage of waste accepted at EfWs in 2006 to 2018
EfW inputs by waste source and type Based on a detailed review of APRs for 2018 and Wastedataflow [7] for 2017/18, it is estimated that in 2018 82.4 % of all EfW inputs were derived from Residual Local Authority Collected Waste (LACW) with the rest being Commercial and Industrial (C&I) Waste.
The continued (albeit modest) increase in C&I Waste inputs reflects the develop- ment of merchant EfW capacity in the UK.
2006 2007 2008 0
2 4 6 8 10 12 14
accepted waste at EfWs million tonnes
2009 2010 2011 2012 2013 2014 2015 2016 2017 2018
Annual EfW Inputs Input Tonnage Inputs of Headline Capacity
Mt %
2014 6.72 88.2
2015 8.45 89.0
2016 10.10 91.0
2017 10.88 90.8
2018 11.49 91.0
Figure 5:
Development of the UK residual waste treatment; 2018 estimate and 2019 provisional
Table 2: Inputs by waste source waste source
year LACW C&I Waste
% % 2014/15 85.4 14.6 2015/16 85.1 14.9 2016/17 83.2 16.8 2017/18 84.4 15.6
2018 82.4 17.6
Source: Wastedataflow, APR 0
10 20 30 40 50 60 70 80 90 100 share
%
2008 2009 2010 2011 2012 2013 2014 2015 2016 2017 2018(E
) 2019(P
)
landfill EfW RDF exports other treatment
Chris Jonas
92
Country Reports
Input by EWC codes
According to available data, 68.7 % of inputs to EfW in 2017 (the last year for which data was available) was unprocessed Municipal Waste with a further 30.5 % of inputs being Residual Waste arising after prior treatment.
Table 3: Inputs by EWC
EWC code
year 20 03 xx 19 12 10 or 19 12 12 other codes %
2017 68.7 30.5 0.8
Source:
Environment Agency: 2017 Waste Data Interrogator – Incinerator Waste Re- turns. Online available: https://data.
gov.uk/dataset/dd8629ad-bd32-4db3- a07a-879737964f23/waste-data-inter- rogator-201
Net calorific value of residual waste
There was very limited reporting of Net Calorific Value (NCV) in the 2018 APR and this data was insufficient to provide any evidence of meaningful trends.
Tolvik’s most recent analysis of operator NCV data (from a variety of sources, some of which was under confidentiality) relates to 2017. This data suggested that the average NCV for Residual LACW in 2017 was 8.9 MJ/Kg and for Residual C&I Waste was 11.0 MJ/Kg. As previously reported, there is a very wide range of results and so these averages need to be treated with caution.
Operator market shares
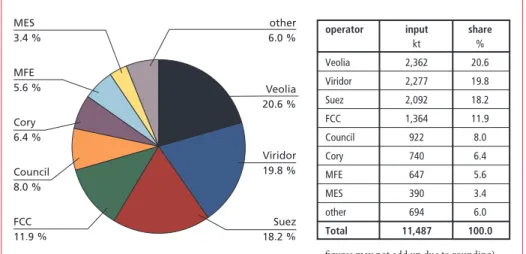
In 2018 Veolia and Viridor had the greatest market share by operator based on input tonnages. There has been no material change in market shares since 2017.
Figure 6: 2018 share of input tonnage (include joint ventures)
Veolia 20.6 % other 6.0 %
Council 8.0 %
Viridor 19.8 %
Suez 18.2 % FCC
11.9 % Cory 6.4 % MFE 5.6 % MES
3.4 % operator input share
kt %
Veolia 2,362 20.6
Viridor 2,277 19.8
Suez 2,092 18.2
FCC 1,364 11.9
Council 922 8.0
Cory 740 6.4
MFE 647 5.6
MES 390 3.4
other 694 6.0
Total 11,487 100.0 figures may not add up due to rounding)
93 United Kingdom Energy from Waste Statistics
Country Reports
4. Energy
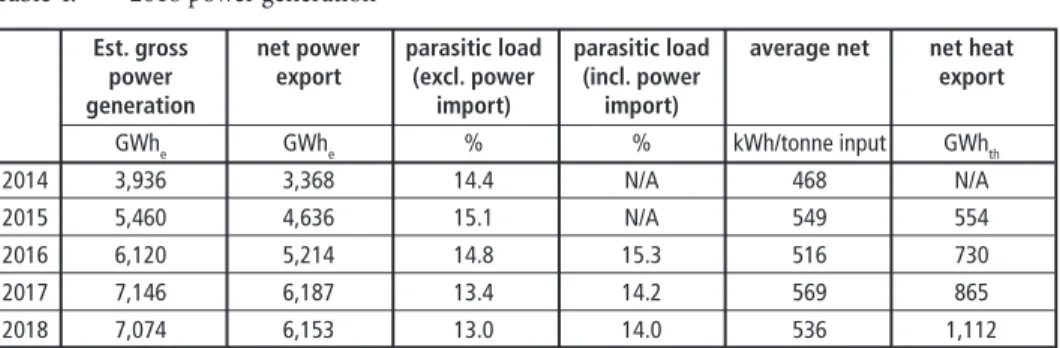
The total power exported by EfWs in the UK in 2018 was 6,153 GWh – approximately 1.9 % of total UK generation. Despite a 5.6 % increase in Residual Waste inputs in 2018, major turbine issues at 6 operational EfWs means that the total power export showed little change on 2017. As a consequence, in 2018 the average power generated per tonne fell to 536 kWh/t.
Table 4: 2018 power generation
Est. gross net power parasitic load parasitic load average net net heat
power export (excl. power (incl. power export
generation import) import)
GWhe GWhe % % kWh/tonne input GWhth
2014 3,936 3,368 14.4 N/A 468 N/A
2015 5,460 4,636 15.1 N/A 549 554
2016 6,120 5,214 14.8 15.3 516 730
2017 7,146 6,187 13.4 14.2 569 865
2018 7,074 6,153 13.0 14.0 536 1,112
Notwithstanding these challenges, for those EfWs reporting in the APR, parasitic loads (expressed as a percentage of total power generation) continued the steady improvement in efficiency seen in recent years.
0 1,000 2,000 3,000 4,000 5,000 6,000 7,000 8,000
2014 2015 2016 2017 2018 15.1 % 14.8 %
13.4 % 13.0 %
Net Power Parasitic 14.4 %
power generation GW/h
Figure 7: Power generation from EfW
400 425 450 475 500 525 550 575 600
2014 2015 2016 2017 2018 specific power generation
kWh/tonne of input
549
468
516 569
536
Figure 8: Average power generation
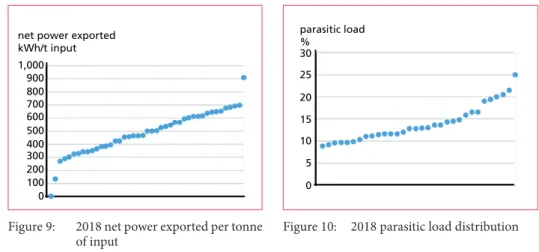
Power: Benchmarking
For each EfW, for which data was reported, Figures 9 and 10 show the distribution of the average net power exported per tonne of input and the average parasitic power load for the year.
Chris Jonas
94
Country Reports
With an average 536 kWh/t generated per tonne of waste input in 2018 (2017:
569 kWh/t), across all EfWs the output ranged from Bolton with no power exported during the year to 906 kWh/t. Ferrybridge FM1 once again by some margin delivered the highest figure which in part reflects its feedstock (solely RDF with a higher NCV), optimised design and the fact that it does not export heat.
Data on parasitic loads in 2018 was less readily available than in 2017 but for those EfWs which reported loads ranged between 8.9 % (Severnside) and 20.0 % (Leeds which uses power for other onsite activities) with an average of 13.0 %.
0 100 200 300 400 500 600 700 800 900 1,000
net power exported kWh/t input
0 5 10 15 20 25 30
parasitic load
%
Figure 9: 2018 net power exported per tonne
of input Figure 10: 2018 parasitic load distribution
EfW
Est. export
GWhth Heat/Steam offtake
2018 2017
Runcorn 408 405 steam supply to Ineos
Eastcroft 332 224 enviroenergy for electricity generation and hot water Sheffield 112 96 district heating operated by Veolia Wilton 11 100 - adjacent Wilton International site
Devonport 59 54 adjacent naval dock yard
Gremista 40 (est) 40 (est) district heating on the Shetland Islands SELCHP 38 37 district heating operated by Veolia Coventry 11 5 district heating operated by Engie Leeds 8 - district heating operated by Vital Energi NewLincs 3 3 to industry (produced 17GWhth but limited demand)
Total 1,112 865
Source: APR
Beneficial heat use
In 2018 10 EfWs in the UK exported heat for beneficial use alongside power with an estimated total export of 1,112 GWhth. (2017: 865 GWhth). Across all EfWs this was the equivalent of 97 kWhth/tonne of inputs (2017: 80 kWhth/tonne).
Table 5: EfWs Exporting Heat
STANDARDKESSEL BAUMGARTE - Power plants, plant operation and services for generating electricity, steam and heat from residues, primary fuels, waste heat and biomass.
Energy costs are continually rising. Making it all the more important for companies and municipalities to explore cheaper fuel alternatives for their energy supply.
We are experts in them: household and commercial waste, industrial residues and refuse derived fuels. And for many years now, we have been proving how they can be used in thermal recycling processes to produce useable energy for generating electricity, process steam and district heat.
For more information and references, visit:
www.standardkessel-baumgarte.com
TONS OF ENERGY!
ENERGY GENERATION FROM RESIDUES:
EFFICIENT & ECO-FRIENDLY.
www.emea.mhps.com Integrated Power Generation Solutions
Mitsubishi Hitachi Power Systems Europe supplies up-to-date, efficient products. We construct most modern power plants and Waste-to-Energy plants. And we deliver reliable and cost- effective service solutions. Our green technologies – in energy storage and biomass, for instance – are examples for our innovation capabilities. Intelligent power generation solutions require know-how and experience. Mitsubishi Hitachi Power Systems has them both – making us a globally successful energy plant constructor and service provider.
Joint Forces
97 United Kingdom Energy from Waste Statistics
Country Reports
Efficiency and R1 As at January 2019 across the UK 28 EfWs (67 % of the number of operational EfWs, 79 % of the Headline Capacity) were accredited as R1 (Recovery) operations.
No Scottish EfWs were reported as being R1 accredited.
5. Operations
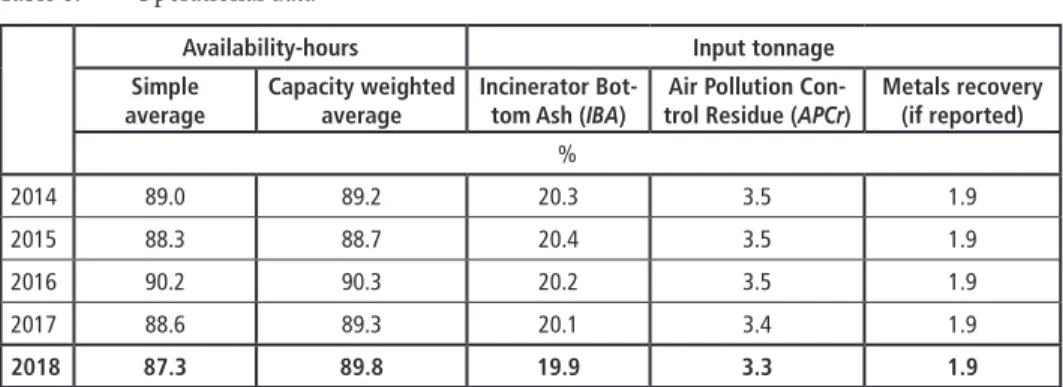
In 2018 EfW availability, based on average operational hours for each EfW, fell to 87.3 %, due to two smaller facilities having availability below 40 %. A new measure has been introduced in this report, the capacity weighted availability, which acknowledges that it is often more challenging to maintain high availability at smaller EfWs. In 2018 this was 89.8 % – largely unchanged from previous years.
As Table 6 shows IBA and APCr produced per tonne of input waste have fallen modestly in recent years.
Table 6: Operational data
Availability-hours Input tonnage
Simple
average Capacity weighted
average Incinerator Bot-
tom Ash (IBA) Air Pollution Con-
trol Residue (APCr) Metals recovery (if reported)
%
2014 89.0 89.2 20.3 3.5 1.9
2015 88.3 88.7 20.4 3.5 1.9
2016 90.2 90.3 20.2 3.5 1.9
2017 88.6 89.3 20.1 3.4 1.9
2018 87.3 89.8 19.9 3.3 1.9
Source: APR
Figure 11: Average EfW availability-hours
2014 2015 2016 2017 2018 80
82 84 86 88 90 92 94 96 98 100
% availability based on operating hours
89.0 88.3 90.2
88.6 87.3
2014 2015 2016 2017 2018 16
17 18 19 20 21 IBA outputs
% of the input of tonnage
%
20.3 20.4
20.2 20.1 19.9
Figure 12: Trend in IBA outputs
Chris Jonas
98
Country Reports
Availability
20 30 40 50 60 70 80 90 100 Availability
%
0 200 400 600 800 1,000
20 30 40 50 60 70 80 90 100 Availability
%
Headline capacity ktpa
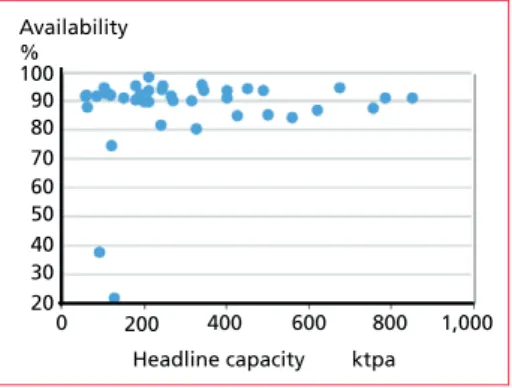
MFE, operator of Ferrybridge FM1, had the highest reported average operator availability whilst Veolia’s Portsmouth had the highest availability for an individual facility of 98.5 % in 2018.
Viridor’s average as reported in Table 7 was adversely impacted by Bolton (22 % availability following major fire in late 2017). Excluding Bolton, Viridor’s average would have been 89.0 %.
With the exception of two EfWs – Bolton and Milton Keynes ACT, all others EfWs had an availability in excess of 75 %.
Figure 13: 2018 availability distribution Figure 14: 2018 availability versus EfW head- line Capacity
Operator Simple average availability
Capacity weigh- ted average
%
MFE 94.5 94.5
Veolia 94.4 94.3
MES 91.5 91.1
Cory 91.1 91.1
FCC 90.0 87.9
Suez 88.2 88.0
Council 83.8 84.4
Viridor 79.5 83.4
Other 77.5 77.1
Average 87.3 89.8
Table 7: 2018 average availability by operator
Outputs
Incinerator bottom ash
In 2018 IBA accounted on average for 19.9 % (2017: 20.1 %) of all waste inputs.
In total, the tonnage of IBA generated was 2.3 Mt.
IBA outputs expressed as a percentage of waste inputs generally fell within the 11 % – 25 % range, with Allington, as a fluidised bed facility, once again reporting the lowest percentage. Almost all IBA is now recycled rather than landfilled.
0 5 10 15 20 25 30 IBA
% of Inputs
Figure 15: 2018 distribution of IBA generation,
99 United Kingdom Energy from Waste Statistics
Country Reports
air pollution control residue
In 2018, APCr generation was 3.3 % of waste inputs (2017: 3.4 %).
The total generation of APCr in 2018 was reported to be 378 kt, an increase of circa 5 % on 2017. Allington, as a large fluidised bed EfW once again produced the greatest portion of APCr as a percentage of inputs.
In 2017 it was estimated that around 20 % of APCr was recycled. Figures for 2018 are not currently available.
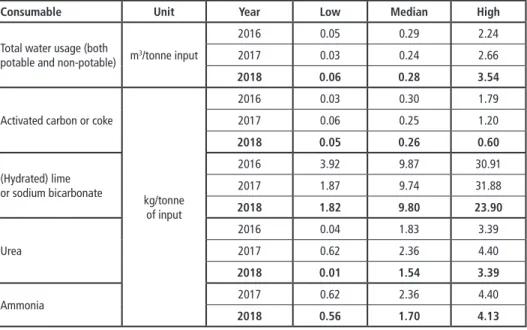
Consumable use
The level of data reporting relating to the use of consumables – specifically water, lime (or other alkaline reagents), urea and carbon in the APR continues to rise. Data is generally calibrated to Specific Usage i.e. usage per tonne of input and this is the approach taken in this report.
To date there have been no discernible trends across UK EfWs, in part because, as Table 8 shows, consumable use varies greatly from facility to facility, and changes in the mix of facilities impacts on the overall UK performance.
Table 8: Specific consumable usage (where reported)
Figure 16: 2018 Distribution of APCr Genera- tion
0 2 4 6 8 10 12 APCr
% of Inputs
Consumable Unit Year Low Median High
Total water usage (both
potable and non-potable) m3/tonne input
2016 0.05 0.29 2.24
2017 0.03 0.24 2.66
2018 0.06 0.28 3.54
Activated carbon or coke
kg/tonne of input
2016 0.03 0.30 1.79
2017 0.06 0.25 1.20
2018 0.05 0.26 0.60
(Hydrated) lime or sodium bicarbonate
2016 3.92 9.87 30.91
2017 1.87 9.74 31.88
2018 1.82 9.80 23.90
Urea
2016 0.04 1.83 3.39
2017 0.62 2.36 4.40
2018 0.01 1.54 3.39
Ammonia 2017 0.62 2.36 4.40
2018 0.56 1.70 4.13
Source: APR, 34 records
Chris Jonas
100
Country Reports
6. Compliance
Background
This section of the report is new for 2018. Compliance in the EfW sector is a combina- tion of operator self-monitoring, reporting to and monitoring by the relevant regulator (EA, SEPA, NRW and NIEA).
EfWs, like most large industrial installations, are required under EU and UK law to monitor their emissions to air both continuously (on site) and periodically (by sample sent to an accredited laboratory). Emissions to water and composition of ash residues are also monitored at regular intervals.
General permit compliance (as measured in England by the OPRA score) is assessed by the regulator whilst operators are now being requested to include details of abnor- mal operations in their APR. In this context abnormal operations are defined as any technically unavoidable stoppages, disturbances, or failures of the abatement plant or the measurement devices, during which the emissions into the air and the discharges of waste water may exceed the prescribed maximum Emission Limit Value (ELV).
To date the focus of compliance has typically been at a facility level, but there is an increasing stakeholder interest in the performance of the UK EfW sector as a whole.
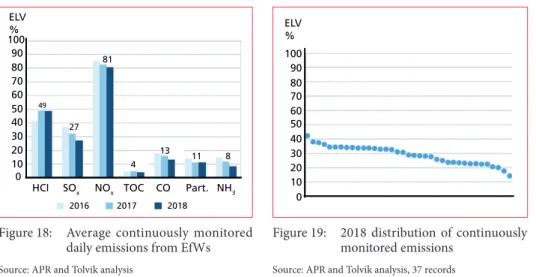
Emissions to air – continuous monitoring by EfWs
The data presented in this section relates to 37 of the 42 EfWs fully operational during 2018 – or the equivalent of approximately 92 % by 2018 inputs in the UK. Data on the remaining EfWs was not provided as part of regulator responses to a Freedom of Information Act request. Across all continuously monitored substances, on average in 2018 emissions were 28 % of the ELV (2017: 31%).
0 5 10 15 20 25 30 Consumables used, per input tonne Consumables used,
per input tonne
Lime kg/t Water
m3/t Carbon kg/t Urea
kg/t NH4 kg/t 0.0
0.5 1.0 1.5 2.0 2.5 3.0 3.5 4.0 4.5 5.0
Median 2018 Median 2017
Figure 17:
Average specific consumable usage (where reported)
Source: APR, 34 records
101 United Kingdom Energy from Waste Statistics
Country Reports
The emission levels of Hydrogen Chlorides (HCl), Sulphur Dioxide (SOx) and Oxides of Nitrogen (NOx) are controlled by the dosing rate of consumable reagents (see Sec- tion 5). Typically in the UK, operators look to optimise resource consumption against achieving emissions levels within the specified ELV.
Emissions to air – periodic assessments
EfW permits also specify the type and frequency (usually bi-annually) of sampling to be undertaken of various specific substances emitted.
0 10 20 30 40 50 60 70 80 90 100 ELV
%
HCI SOx NOx TOC CO Part. NH3
2016 2017 2018
49 27
81
4
13 11 8
0 10 20 30 40 50 60 70 80 90 100 ELV
%
Figure 18: Average continuously monitored daily emissions from EfWs
Source: APR and Tolvik analysis
Figure 19: 2018 distribution of continuously monitored emissions
Source: APR and Tolvik analysis, 37 records
Hydrogen FluorideDioxins and Furans Heavy metals and compoundsCadmium, Thallium and compounds
Mercury and compounds 5
10 14
5 3
0 20 40 60 80 100 ELV
%
0 10 20 30 40 50 60 70 80 90 100 ELV
%
Figure 20: Periodically sampled emissions by substance
Source: APR and Tolvik analysis, 32 records
Figure 20 shows the results of these pe- riodic assessments in 2018 those EfWs reporting data ranging between 3 % and 14 % of the ELV. Operators advise that measurement uncertainty, limits of de- tection for small samples and impact of background pollutant levels can all affect the analysis, but that the protocols used by the sector should be such that reported results are effectively a worst case.
Figure 21: 2018 distribution of periodically sampled emissions
Source: APR and Tolvik analysis, 32 records
Chris Jonas
102
Country Reports
Abnormal operations
0.0 0.2 0.4 0.6 0.8 1.0
Abnormal operating hours
% of total operating hours
39 of the 42 fully operational EfWs re- ported the cumulative hours, per line, of abnormal operations during 2018 with an aggregated total of 130 hours - just 0.02 % of cumulative operating hours across all lines during 2018.
Figure 22: Abnormal operating hours
Source: APR and Tolvik analysis, 39 records
Operational risk assessment (OPRA) scores
All permitted facilities have an OPRA score or equivalent provided by the rel- evant regulatory authority. A score of A represents the best assessment. Using the latest available data for 2017, the previous steady improvement in OPRA scores appears to have been somewhat reversed.
Figure 23: OPRA scores by facility
Sources: EA: Contains public sector information licensed under the Open Government Licence v3.0.
SEPA: Contains SEPA data © Scottish Environmental Pro- tection Agency and database right 2018. All rights reserved
2017 2016 2015 2014
0 20 40 60 80 100
A B C D E
%
7. Capacity development
Based on EfWs which were operational or in construction as at December 2018, Sec- tion 2 identifies a Headline Capacity of 16.85 Mt. Headline Capacity is not suitable for projecting future EfW capacity in any analysis of the UK Residual Waste market; this is more appropriately measured by the Operational Capacity. It is estimated (based upon the EfWs listed in Appendix 1 (of website copy), that by 2023 the UK Operational Capacity will be 16.9 Mt. This reflects an increase of 1.2 Mt from the 2017 projection as a result of additional projects reaching financial close and increases in capacity at existing operational facilities.
103 United Kingdom Energy from Waste Statistics
Country Reports
EfW in development – additional capacity
The actual Operational Capacity beyond 2023 will be dependent upon the development of additional EfWs. Tolvik’s databases (which are a representation of the market but cannot be guaranteed to be comprehensive), show 16.3 Mt of Headline Capacity which either is seeking planning consent, have planning consent or for which planning consent has been refused but some form of appeal/new submission is expected.
0 2 4 8 10 12 14 16 18
6 capacity million tonnes
200920102011201220132014201 5
201 6
20172018 2019 (F
) 2020 (F
) 2021 (F
) 2022 (F
) 2023 (F
) Figure 24:
Projected UK EfW operational capacity
already in UK market 5.6 Mt
international operator 1.3 Mt new entrant 9.5 Mt unconsented
5.5 Mt
refused 2 Mt consented 8.9 Mt
55 % of this potential additional EfW capacity has planning consent.
Just over a third of the potential additional capacity is being developed by those who are already active in the UK EfW market – either as an operator or as a funder, a further 7 % is supported by international EfW operators whilst the remainder (> 50 %) is being developed by parties with no prior experience in the EfW sector.
Figure 25: EfW capacity in development – by
planning status Figure 26: EfW Capacity in Development – by developer
Chris Jonas
104
Country Reports
Appendix: International benchmarks
As in previous years, this report has pulled together the latest available published EfW data from other northern European countries for the purposes of a comparison with the UK EfW market. Th ere will be diff erences in the categorisation of EfW facilities and in the calculation/measurement methodologies applied, but it is hoped that the data provides a useful high-level overview of some key operational metrics.
Table 9: Reported EfW data used for benchmarking
Country Data
year
Reported inputs
Associated capacity
Inputs of head- line capacity
Mt %
Sweden [Avfall Sverige: Svensk Avfallshantering 2018] 2017 6.15 6.51 94.5 Denmark [BEATE Benchmarking af affaldssektoren 2016*] 2015 3.58 3.79 94.5 Germany [ITAD: Jahresbericht 2016/17] 2017 23.49 24.38 96.3 Netherlands [Afvalverwerking in Nederlands, gegevens 2017] 2017 7.63 8.20 93.0
UK 2018 11.49 12.61 91.0
* (data fra 2015) Forbrænding
As Figure 27 shows, whilst in the UK EfWs are largely focussed on electricity export, in most other European markets energy is exported through a mix of power, hot water and steam.
0.0 0.5 1.0 1.5 2.0 2.5 3.0 3.5
Sweden Denmark
NetherlandsGermany
Italy UK Input
MWh/t
power heat
Country Electricity Heat Total MWh/t
Sweden 0.36 2.62 2.98 Denmark 0.40 2.19 2.59 Netherlands 0.48 0.81 1.30 Germany 0.34 0.86 1.20
Italy 0.73 0.33 1.07
UK 0.54 0.10 0.64
Figure 27: Latest European benchmarks – energy export, [fi gures may not add up due to rounding]
Th e UK’s fi gures for IBA, APCr and metal outputs are broadly in line with the rest of Europe.
105 United Kingdom Energy from Waste Statistics
Country Reports
8. Data sources
[1] Afvalverwerking in Nederlands, gegevens 2017, [Netherlands]
[2] APR either provided by operators or released under the Freedom of Information Act EA: Contains public sector information licensed under the Open Government Licence v3.0 NIEA: Contains public sector information licensed under the Open Government Licence v3.0 NRW: Contains Natural Resources Wales information © Natural Resources Wales and database right SEPA: Contains SEPA data © Scottish Environmental Protection Agency and database right 2018. All rights reserved
[3] Avfall Sverige: Svensk Avfallshantering 2018, [Sweden]
[4] BEATE Benchmarking af affaldssektoren 2016 (data fra 2015) Forbrænding, [Denmark]
[5] DEFRA: Our Waste, Our Resources: A Strategy for England – December 2018. https://www.gov.
uk/government/publications/resources-and-waste-strategy-for-england
[6] Environment Agency: 2017 Waste Data Interrogator – Incinerator Waste Returns https://data.gov.uk/dataset/dd8629ad-bd32-4db3-a07a-879737964f23/waste-data-interroga- tor-2017
[7] http://www.wastedataflow.org/ Q100 for four quarters Apr 2017 – Mar 2018 [8] ITAD: Jahresbericht 2016/17, [Germany]
Glossary
ACT Advanced Conversion Technology
APCr Air Pollution Control residue
APR Annual Performance Reports
C&I Commercial and Industrial Waste
EA Environment Agency
EfW(s) Energy from Waste (facilities)
ELV Emission Limit Value
EWC European Waste Catalogue
Headline Capacity The maximum annual throughput contained within the Environ- mental Permit except where an operator has publicly reported an alternative figure.
Table 10:
European benchmarks – ash and metal outputs
Country IBA APCr Metals
%
Sweden 16.1 4.4
Denmark 17.0 3.0
Germany 25.1 4.3 2.2
Netherlands 25.0 2.2 1.7
UK 19.9 3.3 1.9
Chris Jonas
106
Country Reports
IBA Incinerator Bottom Ash
Kt (pa) ‘000s tonnes (per annum) LACW Local Authority Collected Waste Mt (pa) Million tonnes (per annum)
NIEA Northern Ireland Environment Agency
NCV Net Calorific Value
NRW Natural Resources Wales
OPRA Operational Risk Assessment
RDF Refuse Derived Fuel
Residual Waste Solid, non-hazardous, combustible waste which remains after recycling either treated (in the form of an RDF or SRF) or untreated
(as black bag waste).
SEPA Scottish Environmental Protection Agency
Contact Person
Chris Jonas
Tolvik Consulting Ltd Director
The Old Vicarag, Fairmead GL11 5JR Cam, Dursley Gloucestershire
UNITED KINGDOM +44 1934712005 chris@tolvik.com
Vorwort
4
Bibliografische Information der Deutschen Nationalbibliothek Die Deutsche Nationalbibliothek verzeichnet diese Publikation in der Deutschen Nationalbibliografie; detaillierte bibliografische Daten sind im Internet über http://dnb.dnb.de abrufbar
Thiel, S.; Thomé-Kozmiensky, E.; Winter, F.; Juchelková, D. (Eds.):
Waste Management, Volume 9 – Waste-to-Energy –
ISBN 978-3-944310-48-0 Thomé-Kozmiensky Verlag GmbH
Copyright: Elisabeth Thomé-Kozmiensky, M.Sc., Dr.-Ing. Stephanie Thiel All rights reserved
Publisher: Thomé-Kozmiensky Verlag GmbH • Neuruppin 2019 Editorial office: Dr.-Ing. Stephanie Thiel, Elisabeth Thomé-Kozmiensky, M.Sc.
Layout: Claudia Naumann-Deppe, Janin Burbott-Seidel, Sarah Pietsch, Ginette Teske, Roland Richter, Cordula Müller, Gabi Spiegel Printing: Universal Medien GmbH, Munich
This work is protected by copyright. The rights founded by this, particularly those of translation, reprinting, lecturing, extraction of illustrations and tables, broadcasting, micro- filming or reproduction by other means and storing in a retrieval system, remain reserved, even for exploitation only of excerpts. Reproduction of this work or of part of this work, also in individual cases, is only permissible within the limits of the legal provisions of the copyright law of the Federal Republic of Germany from 9 September 1965 in the currently valid revision. There is a fundamental duty to pay for this. Infringements are subject to the penal provisions of the copyright law.
The repeating of commonly used names, trade names, goods descriptions etc. in this work does not permit, even without specific mention, the assumption that such names are to be considered free under the terms of the law concerning goods descriptions and trade mark protection and can thus be used by anyone.
Should reference be made in this work, directly or indirectly, to laws, regulations or guide- lines, e.g. DIN, VDI, VDE, VGB, or these are quoted from, then the publisher cannot ac- cept any guarantee for correctness, completeness or currency. It is recommended to refer to the complete regulations or guidelines in their currently valid versions if required for ones own work.