ATLAS-CONF-2012-165 04December2012
ATLAS NOTE
ATLAS-CONF-2012-165
December 4, 2012
Search for direct sbottom pair production in events with missing transverse momentum and two b-jets in 12.8 fb
−1of pp collisions at
√ s = 8 TeV with the ATLAS detector
The ATLAS Collaboration
Abstract
A search for direct pair production of bottom squarks, each decaying into a bottom quark and a neutralino, is performed in events with large missing trans- verse momentum and 2
b-jets in the final state using 12.8 fb−1of
ppcollisions at
√s=8
TeV recorded by the ATLAS detector at the LHC. For the particular scenario considered, sbottom masses up to 620 GeV are excluded for neutralino masses be- low 150 GeV. Differences in mass above 40 GeV between the
b˜1and the
χ˜10are ex- cluded up to sbottom masses of 300 GeV. Neutralino masses are also excluded up to 320 GeV for sbottom masses around 550 GeV.
c Copyright 2012 CERN for the benefit of the ATLAS Collaboration.
Reproduction of this article or parts of it is allowed as specified in the CC-BY-3.0 license.
1 Introduction
Supersymmetry (SUSY) [1–9] provides an extension of the Standard Model (SM) which resolves the hierarchy problem [10–13] by introducing supersymmetric partners of the known bosons and fermions. In the framework of the
R-parity conserving minimal supersymmetric extension of the SM (MSSM) [14–18], SUSY particles are produced in pairs and the lightest supersymmet- ric particle (LSP) is stable, providing a possible candidate for dark matter. In a large variety of models, the LSP is the lightest neutralino (
χ˜10). The coloured superpartners of quarks and glu- ons, the squarks (
q) and gluinos (˜ g), if not too heavy, would be produced in strong interaction˜processes at the Large Hadron Collider (LHC) and decay via cascades ending with the LSP.
The undetected LSP results in missing transverse momentum – whose magnitude is referred to as
ETmiss– while the rest of the cascade yields final states with multiple jets and possibly lep- tons. In the MSSM, the large value of the top quark Yukawa coupling tends to drive the mass of the superpartners of the third generation quarks to values lower than those of the first and second generation squarks. This effect is enhanced by mixing effects which are proportional to the mass of the SM partner. As a consequence,
b˜1and
t˜1(the lightest mass eigenstates of the sbottom and stop particles) could be produced with relatively large cross-sections at the LHC, either directly in pairs, or through
g˜g˜production followed by
g˜→b˜1bor
g˜→t˜1tdecays.
The present analysis considers a dataset of 12.8 fb
−1collected in 2012 at a centre-of-mass energy of 8 TeV and extends the searches for direct
b˜1pair production at ATLAS reported earlier [19, 20], which used up to 4.7 fb
−1of data collected in 2011 at a centre-of-mass energy of 7 TeV. It is based on a similar event selection, requiring large
ETmiss, no electrons or muons and two jets identified as originating from
b-quarks (
b-jets) in the final state. Results are interpreted in a simplified model where sbottoms are produced in pairs and each decays exclusively to a bottom quark and a stable neutralino.
2 The ATLAS detector
The ATLAS detector [21] consists of inner tracking devices surrounded by a superconducting solenoid, electromagnetic and hadronic calorimeters and a muon spectrometer with a toroidal magnetic field. The inner detector, in combination with the 2 T field from the solenoid, provides precision tracking of charged particles for
|η|<2.51. It consists of a silicon pixel detector, a sili- con strip detector and a straw tube tracker that also provides transition radiation measurements for electron identification. The calorimeter system covers the pseudorapidity range
|η|<4.9.It is composed of sampling calorimeters with either liquid argon (LAr) or scintillating tiles as the active medium. The muon spectrometer has separate trigger and high-precision tracking chambers which provide muon identification and momentum measurement for
|η|<2.7.3 Monte Carlo simulation
Samples of simulated events are used for the description of the background and to model the SUSY signal. The dominant sources of background come from events in which
b-quarks areproduced. Monte Carlo (MC) samples of
tt¯events are generated using POWHEG [22] interfaced
1ATLAS uses a right-handed coordinate system with its origin at the nominal interaction point (IP) in the centre of the detector and thez-axis along the beam pipe. Thex-axis points from the IP to the centre of the LHC ring, and theyaxis points upward. Cylindrical coordinates(r,φ)are used in the transverse plane,φbeing the azimuthal angle around the beam pipe. The pseudorapidity is defined in terms of the polar angleθasη=−ln tan(θ/2). The distance∆Rin theη−φspace is defined as∆R= p
(∆η)2+ (∆φ)2.
1
to PYTHIA [23] and the next-to-leading order (NLO) parton distribution function (PDF) set CT10 [24]. Single top production is generated using AcerMC [25] interfaced to PYTHIA and the PDF set CTEQ6L1 [26] for the t-channel and using MC@NLO [27] interfaced to HERWIG [28] and JIMMY [29] for the s-channel and
W tprocesses. The
Wand
Zbosons produced in association with light- (u,
d,s) and heavy- (c,b) flavoured jets are generated withSHERPA [30] and the PDF set CT10 . Diboson events are generated with up to three additional partons using SHERPA [30]
and the PDF set CT10 . Samples of
tt+W,¯ tt+Z¯events are generated with MADGRAPH [31] inter- faced to PYTHIA [23] and the PDF set CTEQ6L1 . The SUSY signal samples are generated using MADGRAPH interfaced to Pythia 6 in order to ensure an accurate treatment of the initial-state ra- diation (ISR), using the PDF set CTEQ6L1 . The MC samples are processed through the ATLAS detector simulation [32] taking into account the effect of multiple
ppinteractions per bunch crossing. For comparison with data, all SM background cross-sections are normalised to the results of higher-order calculations.
4 Object reconstruction
Jets are reconstructed from three-dimensional calorimeter energy clusters using the anti-
ktjet algorithm [33,34] with a radius parameter of 0.4. The measured jet energy is corrected for inho- mogeneities and for the non-compensating nature of the calorimeter by weighting differently energy deposits arising from electromagnetic and hadronic showers using correction factors derived from Monte Carlo simulations and validated with data [35]. An additional calibration is subsequently applied to the corrected jet energies relating the response of the calorimeter to the true jet energy. The impact of additional collisions in the same or neighbouring bunch crossings is also taken into account using offset corrections derived as a function of the aver- age number of interactions per event
hµiand of the number of primary vertices
NPV[35]. Jets are required to have transverse momentum (
pT)
>20GeV, and are reconstructed in the range
|η|<4.9. Events are rejected if they include jets failing the quality criteria described in Ref. [35].
To further reject spurious jet signals originating from cosmic rays or detector malfunctioning, additional criteria are applied on the charged
pTfraction
ch f, defined as the ratio between the sum of the
pTof all tracks associated to the jet and the jet
pT, and on the fraction of the jet energy contained in the electromagnetic layers of the calorimeter
em f. Events are rejected if any of the two leading jets with
pT >100 GeV and
|η|<2.0satisfies either
ch f <0.02or both
ch f <0.05and
em f >0.9. A neural-network-based algorithm [36] is used to identify jetscontaining a
b-hadron decay. This uses as inputs the output weights of different algorithms ex-ploiting the impact parameter of the inner detector tracks, the secondary vertex reconstruction and the topology of
b- andc-hadron decays inside the jet. The algorithm used has an efficiencyof 60% for tagging
b-jets in a MC sample oftt¯events and a rejection of 580, 8 and 23 against light quarks,
c-quarks andτleptons respectively. The
b-jets are identified within the nominalacceptance of the inner detector (|
η|<2.5) and are required to have
pT>20GeV.
Electrons are reconstructed from energy clusters in the electromagnetic calorimeter matched to a track in the inner detector. Electron candidates are required to have
pT >10GeV and
|η|<2.47
and must satisfy the “medium” selection criteria described in Ref. [37]. Tight elec-
trons, used for the control regions, are selected using “tight” criteria,
pT>25 GeV, and with theisolation requirement that the total track momentum in a cone of
∆R<0.2 around the candi-
date be less than 10% of the reconstructed
pT. Muon candidates are identified using a match
between an extrapolated inner detector track and one or more track segments in the muon
spectrometer, and are required to have
pT>10GeV and
|η|<2.4. Tight muons are required tohave
pT>20 GeVand less than 1.8
GeVin a cone of
∆R<0.2 around the candidate.
To resolve overlaps between reconstructed jets and leptons, jets within a distance of
∆R= 0.2of an electron candidate are rejected. Furthermore, any lepton candidate with a distance
∆R<0.4
to the closest jet is discarded.
The missing transverse momentum,
ETmiss, is the magnitude of the vector sum of the trans- verse momentum or transverse energy of all
pT>10 GeV muons,ET>10 GeV electrons,ET>20 GeVjets, and calibrated calorimeter energy clusters with
|η|<4.9 not associated to these objects. Re- constructed tracks are used to suppress pileup in the soft components of the
ETmiss[38].
5 Event selection
After the application of beam, detector, and data-quality requirements, the total luminosity considered corresponds to
RLdt=12.8fb
−1. Events are selected using a trigger based on an
ETmissselection, which is found to be 99% efficient for events with
ETmissabove 150 GeV. The trigger efficiency variations over data-taking periods or the pileup conditions are measured to be less than 1% after the above requirements. For the 1- and 2-lepton control regions, events are required to pass the unprescaled single lepton trigger with lowest available threshold. A selection
pT>25GeV is applied to both electrons and muons to ensure the trigger efficiency plateau is reached. The presence of at least one primary vertex (with at least five associated tracks with
pT >0.4GeV) is required. Jets within
|η|<2.8are ordered according to their
pT, and it is those jets which are used in the kinematic selections which follow.
A number of event-level variables has been shown to be effective in rejecting the SM back- ground while efficiently selecting candidate sbottom pair production events. The definition of this variables is summarised in Appendix A.
Three sets of signal regions are defined to provide sensitivity to the different kinematic topologies associated to differing mass-splittings
∆mbetween the sbottom and the neutralino mass.
Signal region 1 (SR1) targets signal events with large
∆m, identifying the two leading jetsas the sbottom decay products. These two leading jets are required to be
b-tagged. Eventsare rejected if any further central (|
η|<2.8) jets are found with
pT >50GeV. The multi-jet background is heavily suppressed by selecting events with large
∆φminand
ETmiss/meff. The final selection is done by applying four different thresholds on the boost-corrected contransverse mass,
mCT.
Signal region 2 (SR2) targets signal events with moderate
∆m. Due to the softer kinematicsin this region, the thresholds on the leading jet
pTand on the
mCTare relaxed. A final upper cut on the additional hadronic activity in the event,
HT,2, is applied to reject further
tt¯production processes.
Signal region 3 (SR3) is defined to enhance the sensitivity in the low
∆mregion by explic- itly selecting final state events with a high
pTjet produced as initial state radiation recoiling against the sbottom pair system. High thresholds on the leading jet and on the missing trans- verse momentum, which are required to be almost back-to-back in
φ, are imposed. Two ad-ditional soft jets are required to be
b-tagged. As for SR1 and SR2, the multi-jet background issuppressed with appropriate selections on
∆φminand
ETmiss/meff. A final upper cut on the ad- ditional hadronic activity in the event,
HT,3, completes the selection for SR3a. A second signal region named SR3b is defined by further increasing the thresholds on the leading jet and
ETmissto explore signals with larger sbottom masses.
The definitions of all signal regions are summarised in Table 1.
3
Description Signal region
SR1 SR2 SR3a SR3b
Trigger ETmisstrigger>99%efficient forETmiss>150GeV
Event cleaning Common to all SR
Lepton veto Noe/µwithpT>10 GeV
ETmiss >150GeV >200GeV >150GeV >250GeV
Leading jetpT(j1) >130 GeV,|η|<2.8 >60 GeV,|η|<2.8 >130GeV,|η|<2.8 >150GeV,|η|<2.8 Second jetpT(j2) >50 GeV,|η|<2.8 >60 GeV,|η|<2.8 >30 GeV,<110 GeV,|η|<2.8 Third jetpT(j3) veto event ifpT(j3)>50 GeV,|η|<2.8 >30 GeV,|η|<2.8
∆φ(ETmiss,j1) - >2.5
jetb-tagging (|η|<2.5) j1andj2tagged j1anti-tagged, j2andj3tagged
∆φmin(n) >0.4 (n=2) >0.4 (n=3)
ETmiss/meff(j1,j2,j3) >0.25
mCT >150, 200, 250, 300 GeV >100 GeV -
HT,x - <50 GeV,x=2 <50 GeV,x=3
Table 1: Summary of the event selection in each signal region. The leading, subleading and 3rd leading jet are referred to as
j1,
j2and
j3, respectively.
6 Background estimate
The dominant SM background processes in the signal regions are top and
W+hf(hf = heavy flavour) production (where a charged lepton is produced but it is not vetoed, either because it is a hadronically decaying
τ, or because it is an electron or muon out of acceptance or not reconstructed),
Z(→νν)+hf and multi-jet production from QCD processes. The sub-dominant¯background contribution from di-bosons,
tt¯+W/Zand
tt¯+bb¯is estimated using MC simulation (referred to as “Others” in the following).
The multi-jet production is estimated with a fully data-driven procedure described in detail in Ref. [39], which consists in smearing the jet response of low-E
Tmissseed events. The Gaussian core of the jet response function is obtained from well reconstructed di-jet events, while the non-Gaussian tails are obtained from three-jet events, where the missing transverse momentum can be unambiguously associated to the mis-measurement of one of the jets.
For SR1, the contributions from top production,
Z+hf andW+hf production are estimatedsimultaneously with a profile likelihood fit to three control regions. For SR2 and SR3 the
W+hf contribution is estimated using MC and only two control regions are used for the fit. The single top contribution is added to the
tt¯background contribution with a relative normalisation corresponding to that predicted by the MC.
The control regions are defined by explicitly requiring the presence of leptons (electrons or muons) in the final state
2and other selections kinematically close to those of the corresponding signal regions. A set of same-flavour opposite-sign 2-lepton control regions with di-lepton
2This ensures no signal contamination from the signal of interest. Moreover, the further kinematical constraints on the control regions ensure small signal contamination also from other possible SUSY processes.
CR1L SR1 CR2L SR1 CR2LDF SR1
1 tight electron or muon eeorµµ eµ
pT(j1)>130 GeVandpT(j2)>50 GeV pT(j1)>50 GeVandpT(j2)>50 GeV pT(j1)>130 GeVandpT(j2)>50 GeV Veto event ifpT(j3)>50GeV
ETmiss>100GeV ETmiss(lepton-corrected)>100GeV ETmiss>100GeV Two reconstructedb-jets (leading jets)
40 GeV<mT<100GeV 75 GeV<mℓℓ<105GeV mℓℓ>50 GeV mCT>150GeV leading leptonpT>90 GeV mCT>75GeV
Table 2: Definition of the control regions adopted for SR1.
CR1L SR2 CR2L SR2
1 tight electron or muon eeorµµ
pT(j1)>60 GeVandpT(j2)>60 GeV pT(j1)>50 GeVandpT(j2)>50 GeV Veto event ifpT(j3)>50GeV
ETmiss>120GeV ETmiss(lepton-corrected)>100GeV Two reconstructedb-jets (leading jets)
40 GeV<mT<100GeV 75 GeV<mll<105GeV
— leading leptonpT>90 GeV
Table 3: Definition of the control regions adopted for SR2.
CR1L SR3 CR2L SR3
1 tight electron or muon eeorµµ
Three reconstructed jets
pT(j1)>130 GeV;100>pT(j2)>30GeV pT(j1)>50 GeV
ETmiss>120GeV ETmiss(lepton-corrected)>100GeV j1anti-tagged, j2andj3tagged
40 GeV<mT<100GeV 75 GeV<mll<105GeV
— leading leptonpT>90 GeV
Table 4: Definition of the control regions adopted for SR3.
5
invariant mass around the
Zmass (75
<mℓℓ<105GeV) provides a data sample dominated by
Zproduction. For these control regions, labelled in the following as CR2L SRX, where X=1,2,3, the
pTof the leptons is added vectorially to the
ETmissto mimic the expected missing transverse momentum spectrum of
Z→νν¯events. In addition, the
pTof the leading lepton is required to be above 90 GeV in order to further enhance the
Zproduction contribution. A different-flavour opposite-sign 2-lepton control region (CR2LDF SR1) with one electron and one muon in the final state with
meµ>50GeV and
mCT>75 GeV provides a data sample dominated by top pairproduction which is used to estimate the top contribution to SR1. The set of control regions with exactly one lepton (
e,µ) in the final state and
40GeV
<mT<100GeV provides a data sample largely dominated by top and, to a lesser extent,
Wproduction. In the following, they are labelled as CR1L SRX, where X=1,2,3. To further enhance the
Wcontribution in CR1L SR1 and CR1L SR2 a further selection
mCT>150GeV is applied. CR1L SR1 is used to estimate the contribution of the
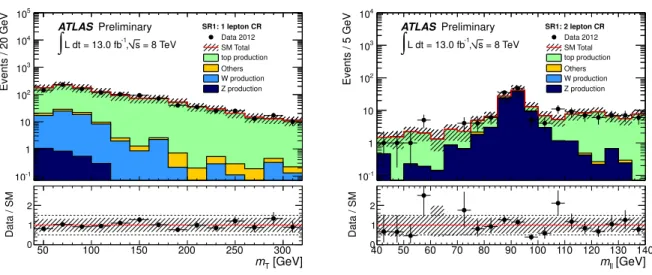
W+jets background in SR1, while CR1L SR2 and CR1L SR3 are dominatedby top pair production and are used to establish its contribution in SR2 and SR3. The exact definition of each of the control regions can be found in Tables 2, 3 and 4. The distribution of the transverse mass
mTin the 1-lepton control region (before the upper selection on
mT) and of the di-lepton invariant mass
mℓℓin the 2-lepton control region are shown in Figure 1 (for SR1) and in Figure 2 (for SR3) before the fit. In these figures, Monte Carlo based normalisation from the theoretical cross sections is used.
The extrapolation of the SM background to the signal region is performed with a fit based on the profile likelihood method [40]. The free parameters of the fit are the top, the
W+jets and the
Z+jets overall normalisation values for SR1, and the top andZ+jets normalisation values forSR2 and SR3. The contributions from all other background processes are fixed at the expected value
3. Systematic uncertainties are treated as nuisance parameters constrained with Gaussian functions and correlations are taken into account. The likelihood function is built as the product of Poisson probability functions, describing the observed and expected number of events in the control and (when excluding SUSY models) signal regions, and the constraints on the nuisance parameters.
The reliability of the MC extrapolation of the SM background estimation is checked in sev- eral validation regions. The first set of validation regions is defined with the same kinematic selection as the control regions but with the requirement of one
b-tag only. They are used toverify the stability of the
b-tagging selection. A second set of 0-lepton validation regions is de-fined with an identical selection to the signal regions, but reversing one of the cuts. For SR1 and SR2, a selection on
mCT<100GeV is required in order to avoid overlap with the correspond- ing signal regions. In the case of SR3, it is the
HT,3requirement that it is reverted by selecting events above
50 GeVfor this quantity. Finally, validation regions with two different flavour leptons in the final state are also used to cross check the normalisation of the top background in SR2 and SR3. Good agreement between the fit results and the number of observed events in the validation regions is found in all cases.
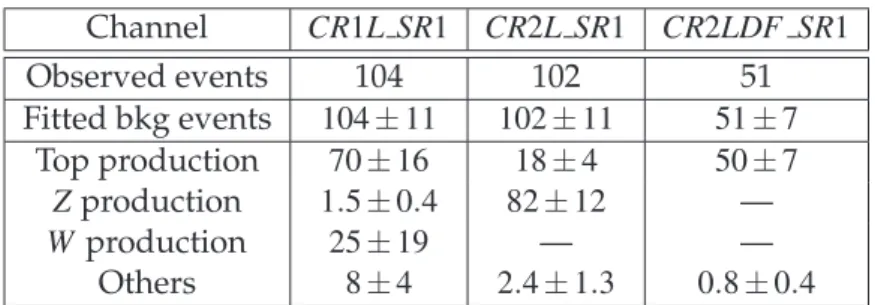
The fit results in the control regions are summarised in Table 5 for SR1. These results were found to be compatible with Monte Carlo predictions before the fit. Similar results have been obtained for the control and validation regions of the other signal regions.
3The contribution of fake lepton background to the control regions has been estimated with a matrix method [37, 41] and found to be negligible.
50 100 150 200 250 300
Events / 20 GeV
10-1
1 10 102
103
104
105
SR1: 1 lepton CR Data 2012 SM Total top production Others W production Z production = 8 TeV
s
-1, L dt = 13.0 fb
∫
ATLAS Preliminary
[GeV]
mT
50 100 150 200 250 300
Data / SM
0 1 2
40 50 60 70 80 90 100 110 120 130 140
Events / 5 GeV
10-1
1 10 102
103
104
SR1: 2 lepton CR Data 2012 SM Total top production Others W production Z production = 8 TeV
s
-1, L dt = 13.0 fb
∫
ATLASPreliminary
[GeV]
mll
40 50 60 70 80 90 100 110 120 130 140
Data / SM
0 1 2
Figure 1: Left: Transverse mass distribution between the lepton and the
ETmissin CR1L SR1 (before the
mTand
mCTselections) for the 1-lepton channel. Right: di-lepton invariant mass distribution in CR2L SR1 omitting the
mℓℓcut. The shaded band includes both detector and theoretical systematic uncertainties. The SM prediction is normalised according to the MC expectations.
50 100 150 200 250 300
Events / 20 GeV
10-1
1 10 102
103
104
SR3: 1 lepton CR Data 2012 SM Total top production Others W production Z production = 8 TeV
s
-1, L dt = 13.0 fb
∫
ATLAS Preliminary
[GeV]
mT
50 100 150 200 250 300
Data / SM
0 1 2
40 50 60 70 80 90 100 110 120 130 140
Events / 5 GeV
10-1
1 10 102
103
104
SR3: 2 lepton CR Data 2012 SM Total top production Others W production Z production = 8 TeV
s
-1, L dt = 13.0 fb
∫
ATLASPreliminary
[GeV]
mll
40 50 60 70 80 90 100 110 120 130 140
Data / SM
0 1 2
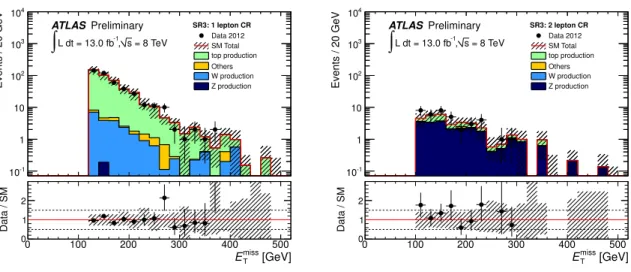
Figure 2: Left: transverse mass distribution between the lepton and the
ETmissin CR1L SR3 (before the upper selection on
mT) for the 1-lepton channel. Right: di-lepton invariant mass distribution in CR2L SR3 omitting the
mℓℓcut. The shaded band includes both detector and theoretical systematic uncertainties. The SM prediction is normalised according to the MC expectations.
7
Channel
CR1L SR1 CR2L SR1 CR2LDF SR1Observed events 104 102 51
Fitted bkg events
104±11 102±11 51±7Top production
70±16 18±4 50±7Z
production
1.5±0.4 82±12—
W
production
25±19— —
Others
8±4 2.4±1.3 0.8±0.4Table 5: Results of the fit for the control regions adopted for SR1. Where no value is given, the background expectation is below 0.1.
7 Systematic uncertainties
The dominant detector-related systematic effects are due to the jet energy scale (JES) and res- olution (JER) uncertainties, and the uncertainties on the
b-tagging efficiency and mistag rates.The JES uncertainty is derived from a combination of simulations, test beam data and in-situ measurements [35]. Additional terms accounting for flavour composition, flavour response close-by jets, pileup and b-jet uncertainties are taken into account. Uncertainties on the JER are obtained with an in-situ measurement of the jet response asymmetry in di-jet events. These uncertainties on jets are propagated to the
ETmissmeasurement, and additional uncertainties on
ETmissarising from energy deposits not associated with any reconstructed objects are also in- cluded. The
b-tagging uncertainty is evaluated by varying theη-, pT- and flavour-dependent scale factors applied to each jet in the simulation within a range that reflects the systematic uncertainty on the measured tagging efficiency and mistag rates. The systematic uncertainties in the modelling of the
t¯t+jets background are assessed as follows: the uncertainty due to thechoice of the MC generator is estimated by comparing POWHEG to the MC@NLO generator [27];
the parton shower (PS) uncertainty is assessed by comparing POWHEG interfaced to PYTHIA to POWHEG interfaced to HERWIG and JIMMY ; the uncertainty due the initial (ISR) and final (FSR) state radiation is estimated by comparing AcerMC [25] MC samples generated with different amounts of ISF/FSR. Uncertainties on the
W/Z+jets simulation are evaluated by comparing theSherpa generator with samples generated using the ALPGEN MC and by varying the Sherpa scales related to the matching scheme, the strong coupling constant, the renormalisation and the factorisation. An uncertainty of 100% is derived for the multi-jet prediction from studying a variation of the resolution function. Finally uncertainties of 30% and of 50% for the cross- section of
t¯t+Wand of
t¯t+Zproduction, respectively, are assigned [42, 43].
8 Results and interpretation
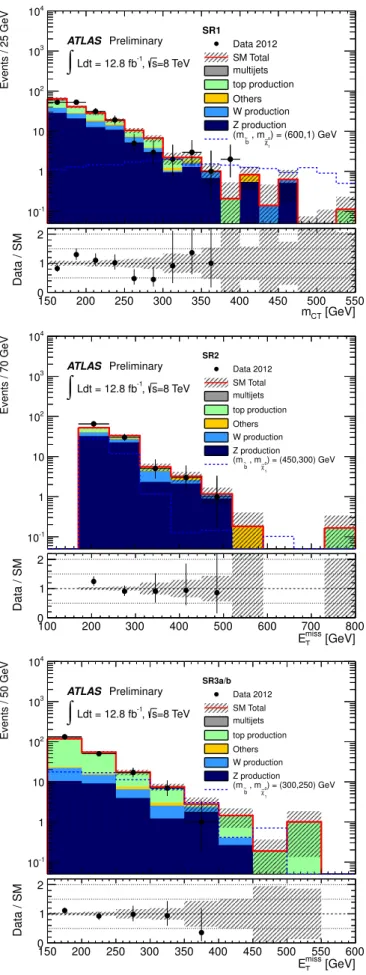
The number of data events observed in the each signal region is reported in Table 6, together with the SM background expectation after the fit. Figure 3 shows the comparison between the SM prediction and the observed data for several relevant kinematic distributions in the different signal regions. A SUSY sample with a relevant value of
∆mbetween sbottom and neutralino masses is shown for reference for each signal region.
No excess above the SM expectations is observed in any of the signal regions defined. Re-
sults are used to obtain model-independent upper limits (UL) on the number of expected be-
yond SM (BSM) signal events on each signal region, and on the corresponding cross-section,
Events / 25 GeV
10-1
1 10 102
103
104
ATLAS Preliminary
=8 TeV s
-1, Ldt = 12.8 fb
∫
SR1
Data 2012 SM Total multijets top production Others W production Z production
) = (600,1) GeV
0 1
, mχ∼
b~
(m
[GeV]
mCT
150 200 250 300 350 400 450 500 550
Data / SM
0 1 2
Events / 70 GeV
10-1
1 10 102
103
104
ATLAS Preliminary
=8 TeV s
-1, Ldt = 12.8 fb
∫
SR2
Data 2012 SM Total multijets top production Others W production Z production
) = (450,300) GeV
0 1
, mχ∼
b~
(m
[GeV]
miss
ET
100 200 300 400 500 600 700 800
Data / SM
0 1 2
Events / 50 GeV
10-1
1 10 102
103
104
ATLAS Preliminary
=8 TeV s
-1, Ldt = 12.8 fb
∫
SR3a/b Data 2012 SM Total multijets top production Others W production Z production
) = (300,250) GeV
0 1
, mχ∼
b~
(m
[GeV]
miss
ET
150 200 250 300 350 400 450 500 550 600
Data / SM
0 1 2
Figure 3: Top:
mCTdistribution in SR1 before the selection on
mCT. Middle:
ETmissdistribution in SR2. Bottom:
ETmissdistribution in SR3 (assuming
pT(j1)>130GeV). The shaded band includes both detector and theoretical systematic uncertainties. The backgrounds are normalised to the values determined in the fit.
9
Channel SR1,mCTselection SR2 SR3
150GeV 200GeV 250GeV 300GeV SR3a SR3b
Observed 172 66 16 8 104 207 21
SM Total 176±25 71±11 25±4 7.4±1.7 95±11 203±35 27±5 Top production 45±13 17±6 7±3 1.6±0.6 15±4 146±40 15±5 Zproduction 85±15 36±6 12±2 4.0±0.9 60±9 27±9 7±2 Wproduction 28±23 12±10 4±3 1±1 15±5 22±7 4±1 Others 6±3 4±2 1.4±0.8 0.7±0.4 4±2 4±2 1.5±0.9 Multijet production 12±12 2±2 0.2±0.2 0.01±0.01 0.6±0.6 4±4 —
Table 6: For each signal region, the observed event yield is compared with the prediction ob- tained from the fit. Uncertainties include statistical and systematic uncertainties together.
Signal region Bkg. estimate Obs. data 95% CL UL on BSM event yield 95% CL UL onσvis(fb) expected observed expected observed
SR1 (mCT>150GeV) 176±25 172 55 54 4.2 4.1
SR1 (mCT>200GeV) 71±11 66 25 22 1.9 1.7
SR1 (mCT>250GeV) 25±4 16 12.5 7.9 0.96 0.61
SR1 (mCT>300GeV) 7.4±1.7 8 7.5 8.0 0.58 0.62
SR2 95±11 104 32 39 2.5 3.0
SR3a 203±35 207 54 54 4.2 4.2
SR3b 27±5 21 13.1 9.6 1.0 0.74
Table 7: Expected and observed event yields with the corresponding Upper Limits (UL) on a generic BSM signal yields and
σvis=σ·A·εfor all the signal regions defined.
σvis
, defined as
σvis=σ·A·ε
(1)
where
σ,
Aand
εare, respectively, the production cross-section, the acceptance and the se- lection efficiency for a generic BSM signal. The
CLsprescription is used to obtain 95% C.L.
limits [40]. Table 7 summarises, for each signal region, the estimated SM background yield, the observed number of events, and the expected and observed UL on event yields from a BSM signal and on
σvis.
Results are interpreted in a specific SUSY scenario which assumes a SUSY particle mass hierarchy such that the sbottom decays exclusively via
b˜1→bχ˜10. Systematic uncertainties on the signal include experimental uncertainties, mostly dominated by
b-tagging (∼28%in SR1 and SR2;
∼20%in SR3) and JES (∼
1−6%in SR1 and SR2;
∼4−30%in SR3, larger when ap- proaching the diagonal) uncertainties. They are assumed to be fully correlated with those of the background. Signal cross sections are calculated to next-to-leading order in the strong cou- pling constant, adding the resummation of soft gluon emission at next-to-leading-logarithmic accuracy (NLO+NLL) [44–46]. The nominal cross section and the uncertainty are taken from an envelope of cross section predictions using different PDF sets and factorisation and renor- malisation scales, as described in Ref. [47].
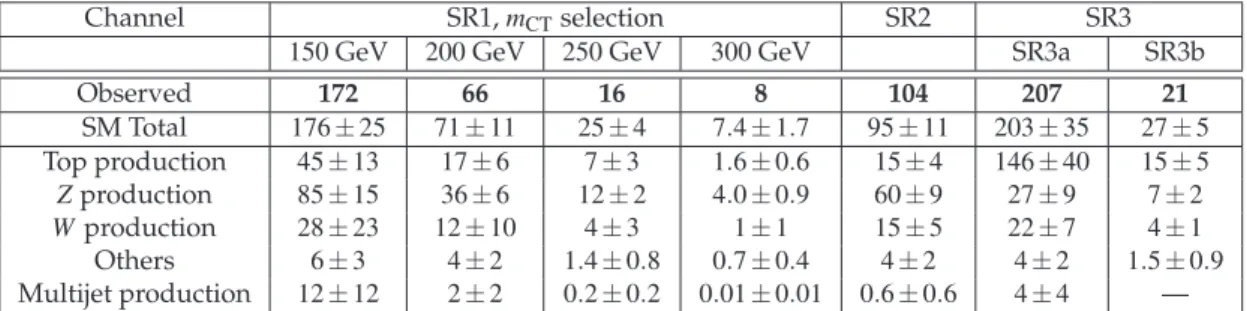
Figure 4 shows the exclusion limit obtained by taking in each point the signal region with
the best expected exclusion. For the MSSM scenario considered, sbottom masses up to 620 GeV
are excluded at 95% C.L. for
mχ˜0 1<150
GeV. Neutralino masses up to 320 GeV are excluded for sbottom masses around 550 GeV. Sensitivity to scenarios with large
∆m(>
200GeV) is mostly obtained using the SR1 selections and, to a lesser extent SR2. The best sensitivity in the region
∆m<40 GeV for sbottom masses below 300 GeV is obtained with the SR3 selection.
[GeV]
b1
m
~100 200 300 400 500 600 700
[GeV]
0 1χ∼m
0 100 200 300 400 500 600 700
forbidden
1
χ0
b∼
→1
~b
1
χ∼0
→ b b1
production, ~ b1
~
1-
~b
ATLAS Preliminary
=8 TeV s
-1, L dt = 12.8 fb
∫
CDF 2.65 fb-1D0 5.2 fb-1
=7 TeV s
-1, ATLAS 2.05 fb
=7 TeV s
-1, ATLAS 4.7 fb
theory) σSUSY
±1 Observed limit (
exp) σ
±1 Expected limit ( All limits at 95% CL
Figure 4: Expected and observed exclusion limits at 95% C.L. in the
(mb˜1,mχ˜01)
plane obtained taking in each point the signal region which gives the best expected
CLsexclusion. The black, dashed line shows the expected limit if theory uncertainties on the signal are neglected. The yellow band shows the
±1σGaussian equivalent uncertainty on the expected limit. The red solid line shows the nominal observed limit, while the red dashed lines show its variation if theory uncertainties on the signal are taken into account. Previous limits set by the ATLAS [19, 20], CDF [48] and D0 [49] are also shown.
9 Conclusions
In summary, we report results of a search for sbottom pair production in
ppcollisions at
√ s= 8TeV, based on 12.8
fb−1of ATLAS data. The events are selected with large
ETmissand two jets required to originate from
b-quarks. The results are in agreement with SM predictions forbackgrounds and translate into 95% C.L. upper limits on sbottom and neutralino masses in a given MSSM scenario for which the exclusive decay
b˜1→bχ˜10is assumed. Sbottom masses up to 620 GeV are excluded for
mχ˜01 =0. Differences in mass above 40 GeV between the b˜1
and the
χ˜10are excluded up to sbottom masses of 300 GeV. Neutralino masses up to 320 GeV are
11
excluded for sbottom masses around 550 GeV. These limits significantly extending previous results.
A Variable definitions
The following variables have been proven to be useful to reject the SM background effectively.
In a given event:
∆φmin(n): This is defined as the minimum∆φ
between any of the leading
njets and the
pmissT.
∆φmin=
min(
|φ1−φpmissT |, ...,|φn−φpmiss
T |)
(2)
Multi-jet events are predominantly characterised by small values of
∆φmin.
meff
: This is defined as the scalar sum of the
pTof the
njets with
pT>20GeV and
|η|<2.8and the
ETmiss.
meff=
∑
i≤n
(pjetT )i+ETmiss
(3)
where the index refers to the
pTordered list of jets.
HT,x
: This is the scalar sum of the
pTof the
njets with
pT >20GeV and
|η|<2.8, without including the leading
xjets:
HT,x=
∑
n i=x+1(pjetT)i.
(4)
The number of leading jets
xexcluded from this sum depends on the signal region under study.
mT
: This is defined using the transverse momentum of the charged lepton in the event (
plepT) and the
pmissTas follows:
mT= q
2plepT ETmiss−2plepT ·pmissT
(5) This variable is used in the 1-lepton control region.
mCT
: The contransverse mass,
mCT[50], is a kinematic variable that can be used to measure the masses of pair-produced semi-invisibly decaying heavy particles. For two identical decays of heavy particles into two visible particles (or particle aggregates)
v1and
v2, and into invisible particles,
mCTis defined as:
m2CT(v1,v2) = [ET(v1) +ET(v2)]2−[pT(v1)−pT(v2)]2,
(6) where
ET = qp2T+m2
. It is an invariant under equal and opposite boosts of the parent particles in the transverse plane. For parent particles produced with small transverse boosts,
mCTis bounded from above by an analytical combination of particle masses. This bound is saturated when the two visible objects are co-linear and for the signal under consideration is given by:
mmaxCT =m2(b)˜ −m2(χ˜10)
m(b)˜
(7)
The boost-corrected contransverse mass [51] conservatively corrects rudimentary
mCTto account for boosts in the transverse plane due to ISR that break the invariance of the quantity. This correction ensures that the calculated
mCTis not smeared to higher values due to the boost from ISR and hence protects the expected endpoint in the distribution.
B Auxiliary material
This are additional tables and plots for which we request approval:
Selection
(mb˜1,mχ˜01) = (300,250)
GeV
(mb˜1,mχ˜01) = (450,300)
GeV
(mb˜1,mχ˜01) = (600,1)
GeV
ETmiss
3.5e+03 1.1e+03 2.7e+02
Jet multipl. 3.5e+03 1e+03 2.6e+02
j1
2.4e+03 7.6e+02 2.6e+02
j2
1.9e+03 6.7e+02 2.5e+02
j3
veto 8.6e+02 3.1e+02 1.1e+02
∆φmin(3)
6.6e+02 2.8e+02 93
ETmiss/meff(j1,j2,j3)
6.6e+02 2.7e+02 84
jet
b-tagging9.9 84 24
mCT>100
4.3 79 23
mCT>150
2.5 58 22
mCT>200
0.9 21 19
mCT>250
0.33 1.3 16
mCT>300
0 0 13
Table 8: Breakdown of SR1 event selection for three different signal points with different mass differences between the
b˜1and the
χ˜10. Numbers are normalised assuming 12.8 fb
−1.
13
0 50 100 150 200 250 300
Events / 20 GeV
10-1
1 10 102
103
104
SR1: 1 lepton CR Data 2012 SM Total top production Others W production Z production = 8 TeV
s
-1, L dt = 13.0 fb
∫
ATLAS Preliminary
[GeV]
mCT
0 50 100 150 200 250 300
Data / SM
0 1 2
0 50 100 150 200 250 300
Events / 20 GeV
10-1
1 10 102
103
104
SR1: 2 lepton CR Data 2012 SM Total top production Others W production Z production = 8 TeV
s
-1, L dt = 13.0 fb
∫
ATLAS Preliminary
[GeV]
mCT
0 50 100 150 200 250 300
Data / SM
0 1 2
0 50 100 150 200 250 300
Events / 20 GeV
10-1
1 10 102
103
104
µ) CR SR1: 2 lepton (e
Data 2012 SM Total top production Others W production Z production = 8 TeV
s
-1, L dt = 13.0 fb
∫
ATLAS Preliminary
[GeV]
mCT
0 50 100 150 200 250 300
Data / SM
0 1 2
Figure 5: Distributions of
mCTfor the control regions adopted for SR1. Top: the single-lepton
control region. Middle: the di-leptonic (Z-enhanced) control region. Bottom: the di-leptonic
different-flavour control region. The shaded band includes both detector and theoretical sys-
tematic uncertainties. The SM prediction is normalised according to the MC expectations. For
the top and bottom plots, the final selection on
mCThas been omitted.
0 100 200 300 400 500
Events / 20 GeV
10-1
1 10 102
103
104
SR3: 1 lepton CR Data 2012 SM Total top production Others W production Z production = 8 TeV
s
-1, L dt = 13.0 fb
∫
ATLASPreliminary
[GeV]
miss
ET
0 100 200 300 400 500
Data / SM
0 1 2
0 100 200 300 400 500
Events / 20 GeV
10-1
1 10 102
103
104
SR3: 2 lepton CR Data 2012 SM Total top production Others W production Z production = 8 TeV
s
-1, L dt = 13.0 fb
∫
ATLAS Preliminary
[GeV]
miss
ET
0 100 200 300 400 500
Data / SM
0 1 2
Figure 6: Distribution of
ETmissin the (left) single-lepton (right) di-leptonic (Z-enhanced) control region adopted for SR3. The shaded band includes both detector and theoretical systematic uncertainties. The SM prediction is normalised according to the MC expectations.
40 50 60 70 80 90 100 110 120 130 140
Events / 5 GeV
10-1
1 10 102
103
104
µ) CR SR1: 2 lepton (e
Data 2012 SM Total top production Others W production Z production = 8 TeV
s
-1, L dt = 13.0 fb
∫
ATLAS Preliminary
[GeV]
mll
40 50 60 70 80 90 100 110 120 130 140
Data / SM
0 1 2
Figure 7: Distribution of
meµdistribution in the di-leptonic different-flavour control region adopted for SR1. The shaded band includes both detector and theoretical systematic uncer- tainties. The SM prediction is normalised according to the MC expectations.
15
Events / 50 GeV
10-1
1 10 102
103
104
105
106
ATLAS Preliminary
=8 TeV s
-1, Ldt = 12.8 fb
∫
SR1: 0 lepton VR Data 2012 SM Total multijets top production Others W production Z production
) = (600,1) GeV
0 1
, mχ∼
b~
(m
[GeV]
miss
ET
0 50 100 150 200 250 300 350 400 450 500
Data / SM
0 1 2
Events / 50 GeV
10-1
1 10 102
103
104
105
106
ATLAS Preliminary
=8 TeV s
-1, Ldt = 12.8 fb
∫
SR2: 0 lepton VR Data 2012 SM Total multijets top production Others W production Z production
) = (450,300) GeV
0 1
, mχ∼
b~
(m
[GeV]
miss
ET
0 50 100 150 200 250 300 350 400 450 500
Data / SM
0 1 2
Events / 50 GeV
10-1
1 10 102
103
104
105
106
107
ATLAS Preliminary
=8 TeV s
-1, Ldt = 12.8 fb
∫
SR3a: 0 lepton VR Data 2012 SM Total multijets top production Others W production Z production
) = (300,250) GeV
0 1 χ∼
, m
b~
(m
[GeV]
miss
ET
150 200 250 300 350 400 450 500 550 600
Data / SM
0 1 2
Figure 8: Distributions of
ETmissin the different no lepton validation regions for each of the sig- nal regions, as discussed in the text. The shaded band includes both detector and theoretical systematic uncertainties. The backgrounds are normalised to the values determined in the fit.
Selection
(mb˜1,mχ˜01) = (300,250)
GeV
(mb˜1,mχ˜01) = (450,300)
GeV
(mb˜1,mχ˜01) = (600,1)
GeV
ETmiss>150
GeV 3.5e+03 1.1e+03 2.7e+02
Jet multipl. 3.5e+03 1e+03 2.6e+02
j1
3.4e+03 1e+03 2.6e+02
j2
2.1e+03 8.3e+02 2.5e+02
j3
veto 8.9e+02 3.9e+02 1e+02
∆φmin(3)
7.2e+02 3.6e+02 91
ETmiss/meff(j1,j2,j3)
7.2e+02 3.6e+02 82
jet
b-tagging11 1.1e+02 24
HT,2
3.3 79 15
mCT>100
0.84 76 15
ETmiss>200
GeV 0.27 41 14
Table 9: Breakdown of SR2 event selection for three different signal points with different mass
differences between the
b˜1and the
χ˜10. Numbers are normalised assuming 12.8 fb
−1.
Selection
(mb˜1,mχ˜01) = (300,250)
GeV
(mb˜1,mχ˜01) = (450,300)
GeV
(mb˜1,mχ˜01) = (600,1)
GeV
j1
3.4e+03 1e+03 2.8e+02
Jet multipl. 3.1e+03 8.8e+02 2.5e+02
j2
3e+03 8.6e+02 2.5e+02
j3
2.5e+03 6.9e+02 2.1e+02
ETmiss>150
GeV 1.8e+03 5.2e+02 1.9e+02
∆φmin(3)
1.4e+03 4.5e+02 1.7e+02
ETmiss/meff(j1,j2,j3)
1.4e+03 4.3e+02 1.5e+02
j1
anti-tagged 1.3e+03 2.6e+02 76
jet
b-tagging1.1e+02 37 5.1
pT(j2)<110
GeV 90 13 0.39
HT,3
58 6.9 0.032
ETmiss>250
GeV 23 4.3 0.024
pT(j1)>150
GeV 23 3.7 0.024
Table 10: Breakdown of SR3 event selections for three different signal points with different mass differences between the
b˜1and the
χ˜10. Numbers are normalised assuming 12.8 fb
−1.
17
References
[1] H. Miyazawa, Baryon Number Changing Currents, Prog. Theor. Phys.
36 (6)(1966) 1266–1276.
[2] P. Ramond, Dual Theory for Free Fermions, Phys. Rev.
D3(1971) 2415–2418.
[3] Y. A. Gol’fand and E. P. Likhtman, Extension of the Algebra of Poincare Group Generators and Violation of p Invariance, JETP Lett.
13(1971) 323–326. [Pisma
Zh.Eksp.Teor.Fiz.13:452-455,1971].
[4] A. Neveu and J. H. Schwarz, Factorizable dual model of pions, Nucl. Phys.
B31(1971) 86–112.
[5] A. Neveu and J. H. Schwarz, Quark Model of Dual Pions, Phys. Rev.
D4(1971) 1109–1111.
[6] J. Gervais and B. Sakita, Field theory interpretation of supergauges in dual models, Nucl. Phys.
B34
(1971) 632–639.
[7] D. V. Volkov and V. P. Akulov, Is the Neutrino a Goldstone Particle?, Phys. Lett.
B46(1973) 109–110.
[8] J. Wess and B. Zumino, A Lagrangian Model Invariant Under Supergauge Transformations, Phys. Lett.
B49(1974) 52.
[9] J. Wess and B. Zumino, Supergauge Transformations in Four-Dimensions, Nucl. Phys.
B70(1974) 39–50.
[10] S. Weinberg, Implications of Dynamical Symmetry Breaking, Phys. Rev.
D13(1976) 974–996.
[11] E. Gildener, Gauge Symmetry Hierarchies, Phys. Rev.
D14(1976) 1667.
[12] S. Weinberg, Implications of Dynamical Symmetry Breaking: An Addendum, Phys. Rev.
D19(1979) 1277–1280.
[13] L. Susskind, Dynamics of Spontaneous Symmetry Breaking in the Weinberg- Salam Theory, Phys. Rev.
D20(1979) 2619–2625.
[14] P. Fayet, Supersymmetry and Weak, Electromagnetic and Strong Interactions, Phys. Lett.
B64(1976) 159.
[15] P. Fayet, Spontaneously Broken Supersymmetric Theories of Weak, Electromagnetic and Strong Interactions, Phys. Lett.
B69(1977) 489.
[16] G. R. Farrar and P. Fayet, Phenomenology of the Production, Decay, and Detection of New Hadronic States Associated with Supersymmetry, Phys. Lett.
B76(1978) 575–579.
[17] P. Fayet, Relations Between the Masses of the Superpartners of Leptons and Quarks, the Goldstino Couplings and the Neutral Currents, Phys. Lett.
B84(1979) 416.
[18] S. Dimopoulos and H. Georgi, Softly Broken Supersymmetry and SU(5), Nucl. Phys.
B193(1981) 150.
[19] ATLAS Collaboration Collaboration, G. Aad et al., Search for scalar bottom pair production with the ATLAS detector in
ppCollisions at
√s=7