arXiv:hep-ex/0505008 v1 5 May 2005
DESY–05–071 1st October 2005
Measurement of inelastic J/ψ production in deep inelastic scattering at HERA
ZEUS Collaboration
Abstract
The inelastic production of J/ψ mesons in ep collisions has been studied with the
ZEUS detector at HERA using an integrated luminosity of 109 pb
−1. The J/ψ
mesons were identified using the decay channel J/ψ → µ
+µ
−. The measurements
were performed in the kinematic range 2 < Q
2< 80 GeV
2, 50 < W < 250 GeV,
0.2 < z < 0.9 and − 1.6 < Y
lab< 1.3, where Q
2is the virtuality of the exchanged
photon, W is the photon–proton centre–of–mass energy, z is the fraction of the
photon energy carried by the J/ψ meson in the proton rest frame and Y
labis the
rapidity of the J/ψ in the laboratory frame. The measured cross sections are
compared to theoretical predictions within the non-relativistic QCD framework
including colour–singlet and colour–octet contributions, as well as to predictions
based on the k
T–factorisation approach. Calculations of the colour–singlet pro-
cess generally agree with the data, whereas inclusion of colour–octet terms spoils
this agreement.
The ZEUS Collaboration
S. Chekanov, M. Derrick, S. Magill, S. Miglioranzi
1, B. Musgrave, J. Repond, R. Yoshida Argonne National Laboratory, Argonne, Illinois 60439-4815, USA
nM.C.K. Mattingly
Andrews University, Berrien Springs, Michigan 49104-0380, USA N. Pavel, A.G. Yag¨ ues Molina
Institut f¨ ur Physik der Humboldt-Universit¨at zu Berlin, Berlin, Germany
P. Antonioli, G. Bari, M. Basile, L. Bellagamba, D. Boscherini, A. Bruni, G. Bruni, G. Cara Romeo, L. Cifarelli, F. Cindolo, A. Contin, M. Corradi, S. De Pasquale, P. Giusti, G. Iacobucci, A. Margotti, A. Montanari, R. Nania, F. Palmonari, A. Pesci, A. Polini, L. Rinaldi, G. Sartorelli, A. Zichichi
University and INFN Bologna, Bologna, Italy
eG. Aghuzumtsyan, D. Bartsch, I. Brock, S. Goers, H. Hartmann, E. Hilger, P. Irrgang, H.-P. Jakob, O.M. Kind, U. Meyer, E. Paul
2, J. Rautenberg, R. Renner, K.C. Voss
3, M. Wang, M. Wlasenko
Physikalisches Institut der Universit¨at Bonn, Bonn, Germany
bD.S. Bailey
4, N.H. Brook, J.E. Cole, G.P. Heath, T. Namsoo, S. Robins
H.H. Wills Physics Laboratory, University of Bristol, Bristol, United Kingdom
mM. Capua, S. Fazio, A. Mastroberardino, M. Schioppa, G. Susinno, E. Tassi Calabria University, Physics Department and INFN, Cosenza, Italy
eJ.Y. Kim, K.J. Ma
5Chonnam National University, Kwangju, South Korea
gM. Helbich, Y. Ning, Z. Ren, W.B. Schmidke, F. Sciulli
Nevis Laboratories, Columbia University, Irvington on Hudson, New York 10027
oJ. Chwastowski, A. Eskreys, J. Figiel, A. Galas, K. Olkiewicz, P. Stopa, D. Szuba, L. Za- wiejski
Institute of Nuclear Physics, Cracow, Poland
iL. Adamczyk, T. Bo ld, I. Grabowska-Bo ld, D. Kisielewska, J. Lukasik, M. Przybycie´ n, L. Suszycki, J. Szuba
6Faculty of Physics and Applied Computer Science, AGH-University of Science and Tech- nology, Cracow, Poland
pA. Kota´ nski
7, W. S lomi´ nski
Department of Physics, Jagellonian University, Cracow, Poland
V. Adler, U. Behrens, I. Bloch, K. Borras, G. Drews, J. Fourletova, A. Geiser, D. Gladkov, P. G¨ottlicher
8, O. Gutsche, T. Haas, W. Hain, C. Horn, B. Kahle, U. K¨otz, H. Kowal- ski, G. Kramberger, H. Lim, B. L¨ohr, R. Mankel, I.-A. Melzer-Pellmann, C.N. Nguyen, D. Notz, A.E. Nuncio-Quiroz, A. Raval, R. Santamarta, U. Schneekloth, H. Stadie, U. St¨osslein, G. Wolf, C. Youngman, W. Zeuner
Deutsches Elektronen-Synchrotron DESY, Hamburg, Germany S. Schlenstedt
Deutsches Elektronen-Synchrotron DESY, Zeuthen, Germany G. Barbagli, E. Gallo, C. Genta, P. G. Pelfer
University and INFN, Florence, Italy
eA. Bamberger, A. Benen, F. Karstens, D. Dobur, N.N. Vlasov
9Fakult¨at f¨ ur Physik der Universit¨at Freiburg i.Br., Freiburg i.Br., Germany
bP.J. Bussey, A.T. Doyle, W. Dunne, J. Ferrando, J. Hamilton, D.H. Saxon, I.O. Skillicorn Department of Physics and Astronomy, University of Glasgow, Glasgow, United King- dom
mI. Gialas
10Department of Engineering in Management and Finance, Univ. of Aegean, Greece T. Carli
11, T. Gosau, U. Holm, N. Krumnack
12, E. Lohrmann, M. Milite, H. Salehi, P. Schleper, T. Sch¨orner-Sadenius, S. Stonjek
13, K. Wichmann, K. Wick, A. Ziegler, Ar. Ziegler
Hamburg University, Institute of Exp. Physics, Hamburg, Germany
bC. Collins-Tooth
14, C. Foudas, C. Fry, R. Gon¸calo
15, K.R. Long, A.D. Tapper
Imperial College London, High Energy Nuclear Physics Group, London, United King- dom
mM. Kataoka
16, K. Nagano, K. Tokushuku
17, S. Yamada, Y. Yamazaki Institute of Particle and Nuclear Studies, KEK, Tsukuba, Japan
fA.N. Barakbaev, E.G. Boos, N.S. Pokrovskiy, B.O. Zhautykov
Institute of Physics and Technology of Ministry of Education and Science of Kazakhstan, Almaty, Kazakhstan
D. Son
Kyungpook National University, Center for High Energy Physics, Daegu, South Korea
gJ. de Favereau, K. Piotrzkowski
Institut de Physique Nucl´eaire, Universit´e Catholique de Louvain, Louvain-la-Neuve, Bel-
gium
qF. Barreiro, C. Glasman
18, M. Jimenez, L. Labarga, J. del Peso, J. Terr´on, M. Zambrana Departamento de F´ısica Te´orica, Universidad Aut´onoma de Madrid, Madrid, Spain
lF. Corriveau, C. Liu, M. Plamondon, A. Robichaud-Veronneau, R. Walsh, C. Zhou Department of Physics, McGill University, Montr´eal, Qu´ebec, Canada H3A 2T8
aT. Tsurugai
Meiji Gakuin University, Faculty of General Education, Yokohama, Japan
fA. Antonov, B.A. Dolgoshein, I. Rubinsky, V. Sosnovtsev, A. Stifutkin, S. Suchkov Moscow Engineering Physics Institute, Moscow, Russia
jR.K. Dementiev, P.F. Ermolov, L.K. Gladilin, I.I. Katkov, L.A. Khein, I.A. Korzhav- ina, V.A. Kuzmin, B.B. Levchenko, O.Yu. Lukina, A.S. Proskuryakov, L.M. Shcheglova, D.S. Zotkin, S.A. Zotkin
Moscow State University, Institute of Nuclear Physics, Moscow, Russia
kI. Abt, C. B¨ uttner, A. Caldwell, X. Liu, J. Sutiak
Max-Planck-Institut f¨ ur Physik, M¨ unchen, Germany
N. Coppola, G. Grigorescu, A. Keramidas, E. Koffeman, P. Kooijman, E. Maddox, H. Tiecke, M. V´azquez, L. Wiggers
NIKHEF and University of Amsterdam, Amsterdam, Netherlands
hN. Br¨ ummer, B. Bylsma, L.S. Durkin, T.Y. Ling
Physics Department, Ohio State University, Columbus, Ohio 43210
nP.D. Allfrey, M.A. Bell, A.M. Cooper-Sarkar, A. Cottrell, R.C.E. Devenish, B. Foster, C. Gwenlan
19, T. Kohno, K. Korcsak-Gorzo, S. Patel, P.B. Straub, R. Walczak
Department of Physics, University of Oxford, Oxford United Kingdom
mP. Bellan, A. Bertolin, R. Brugnera, R. Carlin, R. Ciesielski, F. Dal Corso, S. Dusini, A. Garfagnini, S. Limentani, A. Longhin, L. Stanco, M. Turcato
Dipartimento di Fisica dell’ Universit`a and INFN, Padova, Italy
eE.A. Heaphy, F. Metlica, B.Y. Oh, J.J. Whitmore
20Department of Physics, Pennsylvania State University, University Park, Pennsylvania 16802
oY. Iga
Polytechnic University, Sagamihara, Japan
fG. D’Agostini, G. Marini, A. Nigro
Dipartimento di Fisica, Universit`a ’La Sapienza’ and INFN, Rome, Italy
eJ.C. Hart
Rutherford Appleton Laboratory, Chilton, Didcot, Oxon, United Kingdom
mH. Abramowicz
21, A. Gabareen, S. Kananov, A. Kreisel, A. Levy
Raymond and Beverly Sackler Faculty of Exact Sciences, School of Physics, Tel-Aviv University, Tel-Aviv, Israel
dM. Kuze
Department of Physics, Tokyo Institute of Technology, Tokyo, Japan
fS. Kagawa, T. Tawara
Department of Physics, University of Tokyo, Tokyo, Japan
fR. Hamatsu, H. Kaji, S. Kitamura
22, K. Matsuzawa, O. Ota, Y.D. Ri Tokyo Metropolitan University, Department of Physics, Tokyo, Japan
fM. Costa, M.I. Ferrero, V. Monaco, R. Sacchi, A. Solano
Universit`a di Torino and INFN, Torino, Italy
eM. Arneodo, M. Ruspa
Universit`a del Piemonte Orientale, Novara, and INFN, Torino, Italy
eS. Fourletov, J.F. Martin
Department of Physics, University of Toronto, Toronto, Ontario, Canada M5S 1A7
aJ.M. Butterworth
23, R. Hall-Wilton, T.W. Jones, J.H. Loizides
24, M.R. Sutton
4, C. Targett- Adams, M. Wing
Physics and Astronomy Department, University College London, London, United King- dom
mJ. Ciborowski
25, G. Grzelak, P. Kulinski, P. Lu˙zniak
26, J. Malka
26, R.J. Nowak, J.M. Pawlak, J. Sztuk
27, T. Tymieniecka, A. Tyszkiewicz
26, A. Ukleja, J. Ukleja
28, A.F. ˙Zarnecki
Warsaw University, Institute of Experimental Physics, Warsaw, Poland M. Adamus, P. Plucinski
Institute for Nuclear Studies, Warsaw, Poland
Y. Eisenberg, D. Hochman, U. Karshon, M.S. Lightwood
Department of Particle Physics, Weizmann Institute, Rehovot, Israel
cE. Brownson, T. Danielson, A. Everett, D. K¸cira, S. Lammers, L. Li, D.D. Reeder, M. Rosin, P. Ryan, A.A. Savin, W.H. Smith
Department of Physics, University of Wisconsin, Madison, Wisconsin 53706, USA
nS. Dhawan
Department of Physics, Yale University, New Haven, Connecticut 06520-8121, USA
nS. Bhadra, C.D. Catterall, Y. Cui, G. Hartner, S. Menary, U. Noor, M. Soares, J. Standage, J. Whyte
Department of Physics, York University, Ontario, Canada M3J 1P3
a1
also affiliated with University College London, UK
2
retired
3
now at the University of Victoria, British Columbia, Canada
4
PPARC Advanced fellow
5
supported by a scholarship of the World Laboratory Bj¨orn Wiik Research Project
6
partly supported by Polish Ministry of Scientific Research and Information Technology, grant no.2P03B 12625
7
supported by the Polish State Committee for Scientific Research, grant no. 2 P03B 09322
8
now at DESY group FEB, Hamburg, Germany
9
partly supported by Moscow State University, Russia
10
also affiliated with DESY
11
now at CERN, Geneva, Switzerland
12
now at Baylor University, USA
13
now at University of Oxford, UK
14
now at the Department of Physics and Astronomy, University of Glasgow, UK
15
now at Royal Holloway University of London, UK
16
also at Nara Women’s University, Nara, Japan
17
also at University of Tokyo, Japan
18
Ram´on y Cajal Fellow
19
PPARC Postdoctoral Research Fellow
20
on leave of absence at The National Science Foundation, Arlington, VA, USA
21
also at Max Planck Institute, Munich, Germany, Alexander von Humboldt Research Award
22
Department of Radiological Science
23
also at University of Hamburg, Germany, Alexander von Humboldt Fellow
24
partially funded by DESY
25
also at L´od´z University, Poland
26
L´od´z University, Poland
27
L´od´z University, Poland, supported by the KBN grant 2P03B12925
28
supported by the KBN grant 2P03B12725
a
supported by the Natural Sciences and Engineering Research Council of Canada (NSERC)
b
supported by the German Federal Ministry for Education and Research (BMBF), under contract numbers HZ1GUA 2, HZ1GUB 0, HZ1PDA 5, HZ1VFA 5
c
supported in part by the MINERVA Gesellschaft f¨ ur Forschung GmbH, the Israel Science Foundation (grant no. 293/02-11.2), the U.S.-Israel Binational Science Foundation and the Benozyio Center for High Energy Physics
d
supported by the German-Israeli Foundation and the Israel Science Foundation
e
supported by the Italian National Institute for Nuclear Physics (INFN)
f
supported by the Japanese Ministry of Education, Culture, Sports, Science and Technology (MEXT) and its grants for Scientific Research
g
supported by the Korean Ministry of Education and Korea Science and Engi- neering Foundation
h
supported by the Netherlands Foundation for Research on Matter (FOM)
i
supported by the Polish State Committee for Scientific Research, grant no. 620/E-77/SPB/DESY/P-03/DZ 117/2003-2005 and grant no.
1P03B07427/2004-2006
j
partially supported by the German Federal Ministry for Education and Re- search (BMBF)
k
supported by RF Presidential grant N 1685.2003.2 for the leading scientific schools and by the Russian Ministry of Education and Science through its grant for Scientific Research on High Energy Physics
l
supported by the Spanish Ministry of Education and Science through funds provided by CICYT
m
supported by the Particle Physics and Astronomy Research Council, UK
n
supported by the US Department of Energy
o
supported by the US National Science Foundation
p
supported by the Polish Ministry of Scientific Research and Information Tech- nology, grant no. 112/E-356/SPUB/DESY/P-03/DZ 116/2003-2005 and 1 P03B 065 27
q
supported by FNRS and its associated funds (IISN and FRIA) and by an
Inter-University Attraction Poles Programme subsidised by the Belgian Federal
Science Policy Office
1 Introduction
Inelastic production of charmonium can be described in two steps. The first step is the creation of a cc quark pair, a process which can be calculated in perturbative Quantum Chromodynamics (QCD). The second step is the formation of the J/ψ bound state, which occurs at long distances and is described by phenomenological models.
When charmonium production was first investigated at CERN [1] and Fermilab [2] it was hoped that the production cross section could be used to determine the gluon density in the proton, because the gluon density directly enters the cross–section calculation. This idea was encouraged by the qualitative agreement of the data with the predictions of LO QCD within the framework of the colour–singlet model (CSM) [3] in which the cc pair is formed in a CS state identified with the J/ψ. Later data from pp collisions at Fermilab [4]
indicated that the CSM is not able to describe J/ψ production at large J/ψ transverse momenta, and hence that there may be significant contributions from higher orders in QCD or from the production of cc pairs in colour–octet (CO) states, which evolve into J/ψ mesons via radiation of soft gluons.
Models have been developed in the framework of non-relativistic QCD (NRQCD) [5] in which CS and CO contributions coexist. The transition of the coloured cc pair, with a given angular momentum, into a J/ψ is described in terms of long–distance matrix elements tuned to experimental data (hadroproduction of J/ψ mesons or B–meson de- cays to J/ψ). As well as describing high–p
Tcharmonium production in pp collisions [4], NRQCD calculations including CS and CO contributions are also consistent with the data on production of J/ψ mesons in γγ interactions at LEP2 [6]. However, J/ψ polarisation data from CDF [7] are inconsistent with NRQCD predictions. Comparisons with the decay angular distributions measured in e
+e
−collisions at BaBar [8] and Belle [9] are inconclusive.
The production of J/ψ mesons in ep collisions at HERA is sensitive to both CS and CO contributions. The CS mechanism is expected to be the dominant contribution at intermediate values of the inelasticity variable, z . 0.7. In the proton rest frame, z is the fraction of the virtual photon energy transferred to the J/ψ. The CO mechanism is expected to be dominant at high z. However, large contributions from the elastic and diffractive proton–dissociative J/ψ production processes [10,11] are also present at z ≈ 1.
Inelastic J/ψ production at HERA was studied previously in the photoproduction regime (photon virtuality Q
2≈ 0) by the H1 [12] and ZEUS [13] collaborations. The leading–
order (LO) NRQCD calculations and the next–to–leading-order (NLO) CSM predictions
are both consistent with the data. Inelastic J/ψ production in the deep inelastic scattering
(DIS) regime (Q
2& 1 GeV
2) has been studied by the H1 collaboration [14]. In this case,
the LO NRQCD predictions overestimate the data, whereas the LO CSM expectations
underestimate them. The shape of the differential cross sections are reasonably well reproduced by both models, except for the inelasticity distribution in the case of LO NRQCD and for the distribution of the J/ψ transverse–momentum squared in the photon–
proton centre–of–mass system in the case of the LO CSM. NLO CSM predictions are not available in the DIS regime.
Models in the framework of the semi–hard or k
T–factorisation approach [15] are also available. In these models, based on non–collinear parton dynamics governed by the BFKL [16] or CCFM [17] evolution equations, effects of non–zero gluon transverse mo- mentum are taken into account. Cross sections are then calculated as the convolution of unintegrated (transverse–momentum dependent) gluon densities and LO off–shell matrix elements. These models [18–20] succeed in describing the p
Tspectra of different quarko- nium states at Fermilab and J/ψ meson production at HERA, as well as the quarkonium polarisation properties measured both at Fermilab and HERA.
This paper presents a measurement of inelastic J/ψ production in DIS and comparison of the data with NRQCD and models in the k
T–factorisation approach. The reaction e p → e J/ψ X is studied for Q
2> 2 GeV
2. The photon–gluon fusion process leading to a J/ψ in the final state is assumed to be the dominant mechanism. Other contributions arise from the production of ψ
′mesons which subsequently decay to a J/ψ, and from J/ψ and ψ
′production from the resolved photon process, where the exchanged photon acts as a source of partons; the latter process, however, is suppressed at high Q
2. In addition, beauty production at high Q
2with subsequent decay of a B meson into a J/ψ also contributes to the measured cross section; this process is suppressed due to the small beauty cross section and the small B to J/ψ branching ratio.
Inelastic J/ψ production at large Q
2has a smaller cross section than in photoproduction but presents several interesting aspects. The contribution from the CO model is expected to be more significant; both the CO and the CS predictions should be more accurate due to the higher scale in the interaction. Also, backgrounds from diffractive processes are reduced at high Q
2. The measurements presented here are in a larger kinematic range than those previously published [14]. A measurement of the hadronic final state, X, is presented for the first time.
2 Experimental set-up
The data sample used in the analysis was collected with the ZEUS detector in the years 1996–2000 and corresponds to an integrated luminosity L = 108.8 ± 2.2 pb
−1. During the 1996–97 data taking, HERA operated with positrons of energy E
e= 27.5 GeV and protons of energy E
p= 820 GeV, corresponding to a centre-of-mass energy √
s = 300 GeV ( L
300=
32.7 ± 0.6 pb
−1). In the years 1998–2000, HERA collided electrons or positrons with protons of energy E
p= 920 GeV, corresponding to √
s = 318 GeV ( L
318= 76.1 ± 1.6 pb
−1).
The cross sections presented here were corrected to √
s = 318 GeV using the Monte Carlo (MC) simulation described in Section 4.
A detailed description of the ZEUS detector can be found elsewhere [21, 22]. Charged particles are tracked in the central tracking detector (CTD) [23], which operates in a magnetic field of 1.43 T provided by a thin superconducting coil. The CTD consists of 72 cylindrical drift chamber layers, organised in 9 superlayers covering the polar–angle
1region 15
◦< θ < 164
◦. The transverse–momentum resolution for full–length tracks is σ(p
T)/p
T= 0.0058p
T⊕ 0.0065 ⊕ 0.0014/p
T, with p
Tin GeV. Energy deposits are measured in the high–resolution uranium–scintillator calorimeter (CAL) [24] which consists of three parts: the forward (FCAL), the barrel (BCAL) and the rear (RCAL) calorimeters. Each part is subdivided transversely into towers and longitudinally into one electromagnetic section (EMC) and either one (in RCAL) or two (in BCAL and FCAL) hadronic sections (HAC). The smallest subdivision of the calorimeter is called a cell. The CAL energy res- olutions, as measured under test-beam conditions, are σ(E)/E = 0.18/ √
E for electrons and σ(E )/E = 0.35/ √
E for hadrons with E in GeV. The scattered electron
2identifica- tion is performed by combining information from the CAL, the small–angle rear tracking detector (SRTD) [25, 26] and the hadron–electron separator (HES) [27]. Muon identifica- tion is performed by finding tracks in the barrel and rear muon chambers (BMUON and RMUON) [28] or minimum–ionising energy deposits in the CAL, matched to CTD tracks.
The muon chambers are placed inside and outside a magnetised iron yoke surrounding the CAL. The barrel and rear inner muon chambers, used in this analysis, cover polar angles from 34
◦to 135
◦and from 135
◦to 171
◦, respectively.
The luminosity was determined from the rate of the electron–proton bremsstrahlung pro- cess, ep → eγp, where the photon was measured by a lead–scintillator calorimeter [29]
located at Z = − 107 m.
1
The ZEUS coordinate system is a right-handed Cartesian system, with the Z axis pointing in the proton beam direction, referred to as the “forward direction”, and the X axis pointing left towards the centre of HERA. The coordinate origin is at the nominal interaction point.
2
Here and in the following, the term “electron” denotes generically both the electron (e
−) and the
positron (e
+).
3 Event selection and reconstruction
3.1 Event selection
A three–level trigger system was used to select events online [22, 30]. The first– and second–level trigger selections were based on the identification of a scattered electron in the CAL, as described in detail elsewhere [26]. The third–level trigger selection required both a scattered electron in the CAL and a track segment reconstructed in the barrel or rear inner muon chambers.
Additional requirements were imposed in the offline selection in order to suppress the photoproduction background and select inelastic events with a J/ψ candidate identified by the presence of a pair of oppositely charged muons. In addition, the Z position of the reconstructed vertex was required to lie within 50 cm of the nominal interaction point.
3.2 Reconstruction of DIS kinematic variables
A scattered electron candidate, identified from the pattern of the energy deposits in the CAL [31], was required. The electron position measurement of the CAL was improved using information from the SRTD and the HES. To ensure full containment of the elec- tromagnetic shower, the electron impact position on the inner face of the rear calorimeter was required to lie outside the box | X | < 13 cm, | Y | < 7 cm. The energy of the scattered electron was required to be greater than 10 GeV.
The photon virtuality, Q
2, was reconstructed from the polar angle and energy of the scattered electron and was required to be in the range 2 < Q
2< 80 GeV
2. The Bjorken variable, y = (P · q)/(P · k), where P , q and k are the four–momenta of the incoming proton, exchanged photon and incoming electron, respectively, was reconstructed with the Σ method [32]. Monte Carlo studies showed this method to be the most precise in the selected phase space region. The photon–proton centre–of–mass energy, W , calculated from W
2= ys − Q
2, was restricted to the range 50 < W < 250 GeV.
Conservation of energy, E, and longitudinal momentum, p
Z, require δ = Σ
i(E
i− p
Z,i) =
2E
e= 55 GeV, where the sum runs over all the particles in the final state. The exper-
imentally reconstructed quantity δ
meas= Σ
i(E
i− p
Z,i) was calculated, where the sum
runs over all final–state energy–flow objects [33] (EFOs) which combine the information
from calorimetry and tracking. Only events with 40 < δ
meas< 65 GeV were kept. This
cut reduces background from photoproduction events, where the scattered electron is not
detected, and removes DIS events with large initial–state radiation, where the incoming
electron radiates a high–energy photon before the interaction and the photon escapes
detection in the rear beam hole. To reduce background from photoproduction events fur- ther, the condition y
e< 0.95 was applied, where y
eindicates the value of y reconstructed from the scattered electron energy and polar angle. In order to ensure an accurate re- construction of the final state, it was also required that the value of y, obtained with the Jacquet–Blondel method [34], be larger than 0.02.
3.3 J/ψ reconstruction
The oppositely charged muons from the J/ψ decays were reconstructed in the CTD. Each track considered in the analysis was required to be fitted to the event vertex, to reach at least the third superlayer of the CTD and to have transverse momentum p
T> 100 MeV;
this guarantees good reconstruction quality. At least one of the tracks from the J/ψ decay had to match a segment in the inner muon chambers and the other had to match a CAL cluster with an energy deposit consistent with the passage of a minimum ionising particle (mip). To ensure high muon–identification efficiency and purity, the track matched with the segment in the barrel (rear) inner muon chambers was required to have p
T> 1.4 GeV (p > 1.8 GeV, where p is the track momentum). For the track matched to the mip cluster in the CAL, the cut p > 1 GeV was applied. The muon identification and reconstruction efficiencies were estimated separately for muons reconstructed in the BMUON, RMUON and CAL using independent samples of dimuon events. The efficiency for tracks matched to the inner muon chambers varies from 35% for p
T∼ 1.4 GeV to 60% at high transverse momentum for the barrel inner muon chambers and from 50% for p ∼ 1.8 GeV to 65% at high momentum for the rear inner muon chambers. The efficiency for tracks matched to a mip in the CAL was 92%.
The J/ψ rapidity in the laboratory frame, defined as Y
lab=
1/
2ln[(E
ψ+p
Z,ψ)/(E
ψ− p
Z,ψ)], where E
ψand p
Z,ψare the energy and longitudinal momentum of the J/ψ meson, was limited to the region − 1.6 < Y
lab< 1.3, where the acceptance is high.
The inelasticity of the J/ψ meson, z = (P · p
ψ)/(P · q), where p
ψis the four–momentum of the J/ψ, was reconstructed using the expression
z = E
ψ− p
Z,ψ2 E
ey
Σ, where y
Σ= P
hadi
(E
i− p
Z,i)/δ
measand the sum in the numerator runs over all EFOs not
associated with the scattered electron. According to MC studies, the average resolution
in z is 10%. The inelasticity was restricted to the range 0.2 < z < 0.9. The lower z cut
removes the region of high non-resonant background due to fake muons and the upper z
cut removes elastic J/ψ events and suppresses diffractive J/ψ production with dissociation
of the proton. In order to suppress further the latter background, the following cuts were
applied:
• the analysis was restricted to events with an energy deposit greater than 1 GeV in a cone of 35
◦along the outgoing proton beam direction (excluding calorimeter deposits due to the decay muons);
• the event was required to have at least one track in addition to those associated with the two muons and with the scattered electron.
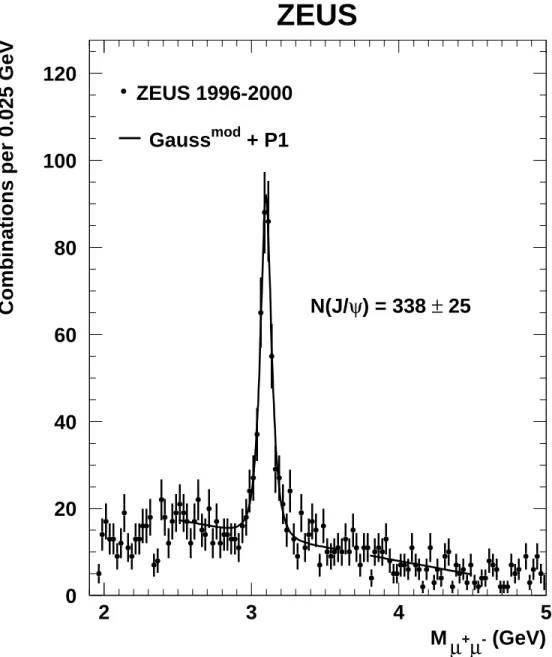
Figure 1 shows the invariant mass, M
µ+µ−, distribution of all selected muon pairs. The dis- tribution was fitted in the intervals 2.5 < M
µ+µ−< 3.6 GeV and 3.8 < M
µ+µ−< 4.5 GeV with a function taken to be the sum of a “modified” Gaussian, to describe the signal, and a linear function, to describe the non-resonant background. The range 3.6 < M
µ+µ−<
3.8 GeV was excluded to avoid any overestimation of the background due to the ψ
′state.
The modified Gaussian function had the form:
Gauss
mod∝ exp[ − 0.5 · x
1+1/(1+0.5·x)],
where x = | (M
µ+µ−− M
0)/σ | . This function was introduced to take into account the non–
Gaussian tails of the resonant signal. This functional form describes both data and MC signals well. The position of the Gaussian, M
0, the signal width, σ, as well as the number of signal events were free parameters of the fit. The fit yielded a peak position of M
0= 3098 ± 3 MeV, in agreement with the PDG value [35], and a width of σ = 35 ± 3 MeV, in agreement with the MC estimation of the detector resolution. The number of J/ψ mesons was 338 ± 25.
4 Monte Carlo models
Inelastic J/ψ events were generated using the Epjpsi [36] MC generator. Epjpsi incorpo- rates the photon–gluon fusion process at LO, with initial– and final–state parton showers performed according to the colour–dipole model as implemented in Ariadne [37]. J/ψ mesons were produced in the framework of the CSM. The GRV98 [38] parton distribution functions were used. The scales for the evaluation of the strong coupling constant and the proton structure function were set to the centre–of–mass energy in the γ
∗g frame. The hadronisation was performed with the Lund string model [39]. The Epjpsi MC predic- tions were reweighted to the data in Q
2and p
∗T2, where p
∗T2is J/ψ transverse momentum squared in the γp centre–of–mass frame. The helicity parameter in the Epjpsi MC was set to zero; this hypothesis is supported by the data [13].
Signal events were also generated using the Cascade MC program [40]. Cascade in-
corporates the off-shell matrix elements for the photon–gluon fusion process at LO. The
initial–state parton shower is generated according to the CCFM evolution equations [17].
The J/ψ mesons were produced in the framework of the CSM. The gluon density, un- integrated in transverse momentum, k
T, was obtained from an analysis of the proton structure functions based on the CCFM equations [41]; in the event generation the gluon density used corresponds to the set named “J2003 set 2”. In Cascade the hadronisation was also performed with the Lund string model.
Events with diffractive dissociation of the proton, ep → eJ/ψN , where N is a low mass state with the quantum numbers of the proton, were simulated using the Epsoft MC generator [42], which has been tuned to describe such processes at HERA [43]. Proton–
dissociative events were also simulated with the Diffvm [44] MC generator. Diffvm has a more detailed simulation of the final state than Epsoft .
J/ψ mesons originating from B–meson decay were simulated using the Rapgap MC generator [45], via the photon–gluon fusion process, γ
∗g → bb; the beauty–quark mass was set to 4.75 GeV. The CTEQ5L [46] parton distribution functions were used. The B to J/ψ branching ratio in Rapgap was set to the PDG value [35]. The MC prediction was normalised to the measured beauty cross section in DIS [47].
All generated events were passed through a full simulation of the ZEUS detector based on Geant 3.13 [48]. They were then subjected to the same trigger requirements and processed by the same reconstruction programmes as for the data.
5 Cross-section calculation
Prior to the cross–section calculation, the residual diffractive proton–dissociative back- ground was subtracted. Although such events are produced at z ∼ 1 and the inelasticity was restricted to 0.2 < z < 0.9, some diffractive events migrate into the data sample due to the finite z resolution. The reconstructed track multiplicity distribution was fitted to the sum of inelastic ( Epjpsi ) and diffractive ( Epsoft ) MC predictions. The fit yielded a contribution of 6 ± 1% from proton dissociation for the whole sample. The proton–
dissociative contributions were subtracted bin–by–bin from all measured cross sections according to the Epsoft predictions normalised to the above fraction.
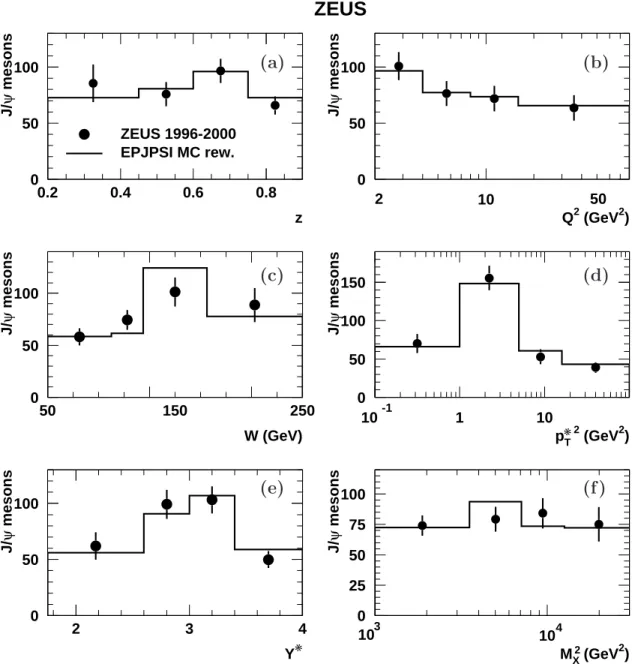
The number of J/ψ mesons reconstructed in the kinematic region 2 < Q
2< 80 GeV
2, 50 < W < 250 GeV, 0.2 < z < 0.9 and − 1.6 < Y
lab< 1.3, after subtraction of the proton–
dissociative admixture, was compared to the predictions of the Epjpsi MC generator.
The results are shown in Fig. 2 for z, Q
2, W , p
∗2T, the J/ψ rapidity in the γp frame
3, Y
∗, and M
X2, where M
Xis the invariant mass of the final state excluding the J/ψ and the scattered electron.
3
In the γp centre–of–mass frame, the photon direction was chosen to be the “forward direction”.
Data were corrected bin–by–bin for geometric acceptance, detector, trigger and recon- struction inefficiencies, as well as for detector resolution, using the Epjpsi MC gener- ator. The acceptance, A
i( O ), as a function of an observable, O , in a given bin, i, is A
i( O ) = N
irec( O )/N
igen( O ), where N
igen( O ) is the number of generated MC events and N
irec( O ) is the number of reconstructed events passing all the selection requirements.
Differential cross sections as a function of O in a given bin i were obtained using the expression
dσ
id O = N
iB L A
i( O ) ,
where N
iis the number of signal events, reconstructed in each bin after subtraction of the estimated contribution from the diffractive proton–dissociative events, B the branching ratio (5.88 ± 0.10)% [35] and L the integrated luminosity.
The background from ψ
′photoproduction is expected to be 15% [49]; this expectation was confirmed by a direct measurement of the ψ
′to J/ψ cross section ratio [13]. Re- stricting the phase–space region in this analysis similar to that for photoproduction, 50 < W < 180 GeV and 0.55 < z < 0.9, the number of observed ψ
′events was con- sistent with the expectation from the ψ
′to J/ψ ratio measured in the photoproduction regime. The contribution of J/ψ mesons from ψ
′decays was assumed to yield the same kinematic distributions as the dominant direct J/ψ contribution and, therefore, the the- oretical predictions for J/ψ production were scaled up by 15%. This change is small compared to the normalisation error of the LO NRQCD predictions.
Monte Carlo studies showed that the contribution from B–meson decays into J/ψ was concentrated at low–z values and small elsewhere. For 0.1 < z < 0.4, this contribution can be as large as 20%. The beauty contribution was estimated using the Rapgap MC and added to the J/ψ predictions. This change is small compared to the normalisation uncertainty of the LO NRQCD predictions.
The J/ψ meson can be produced via χ
cradiative decays, χ
c→ J/ψγ . While χ
cmesons can be produced copiously in hadron–hadron collisions through gg, gq and qq interactions, χ
cproduction via photon–gluon fusion is forbidden at LO in the CS model. This leaves only resolved photon processes, strongly suppressed at non–zero photon virtuality, or CO processes as sources of χ
cproduction. However, the ratio of the χ
cto J/ψ from the CO processes is expected to be below 1% [50]. This contribution was therefore neglected.
The effect of the LO electroweak corrections was studied using the Heracles [51] MC
program. The open charm DIS cross section was evaluated using the Rapgap [45] MC
program with and without radiative corrections, as calculated by Heracles , in a W –Q
2grid. The measured cross sections were then corrected to the QED Born level using the
Heracles predictions. In the region covered by the data, this correction was − 2% on
average and always below 7% in absolute value.
6 Systematic uncertainties
The systematic uncertainties of the measured differential cross sections were determined by changing the selection cuts or the analysis procedure in turn and repeating the ex- traction of the differential cross sections. The resulting uncertainty on the total cross section is given in parentheses. The following categories of systematic uncertainties were considered:
• scattered electron reconstruction: these uncertainties were evaluated as described else- where [52] (2%);
• CAL energy scale and resolution simulation: these uncertainties were evaluated as described elsewhere [52] (2%);
• tracking: the resolutions on track momenta and angles were varied by ± 20% of their values and the magnetic field by ± 0.3% (1%);
• muon reconstruction: the uncertainty of the muon acceptance, including those of the efficiency of the muon chambers, the trigger selection algorithms and the offline reconstruction, was obtained from a study based on an independent dimuon sample at high Q
2, performed following the method discussed elsewhere [53] (6%);
• fitting procedure: the invariant–mass range and the functional form of the background were varied (2%);
• simulation of the process γ
∗g → J/ψg: the Cascade MC rather than the Epjpsi MC was used to calculate acceptances (5%);
• subtraction of the remaining diffractive proton–dissociative admixture: Diffvm rather than Epsoft was used to perform the subtraction of the proton diffractive events (3%).
These estimations were also made in each bin of the differential cross sections. All of the above individual sources of systematic uncertainty were added in quadrature.
The following sources resulted in an overall shift of the cross section and were therefore treated as normalisation uncertainties:
• the integrated luminosity determination has an uncertainty of 2%;
• the branching ratio of J/ψ → µ
+µ
−has an uncertainty of 1.7% [35].
The normalisation uncertainties were not included in the total systematic uncertainty.
7 Results
The cross section for the process ep → eJ/ψX in the kinematic region 2 < Q
2< 80 GeV
2,
50 < W < 250 GeV, 0.2 < z < 0.9 and − 1.6 < Y
lab< 1.3 is
302 ± 23 (stat.)
+28−20(syst.) pb,
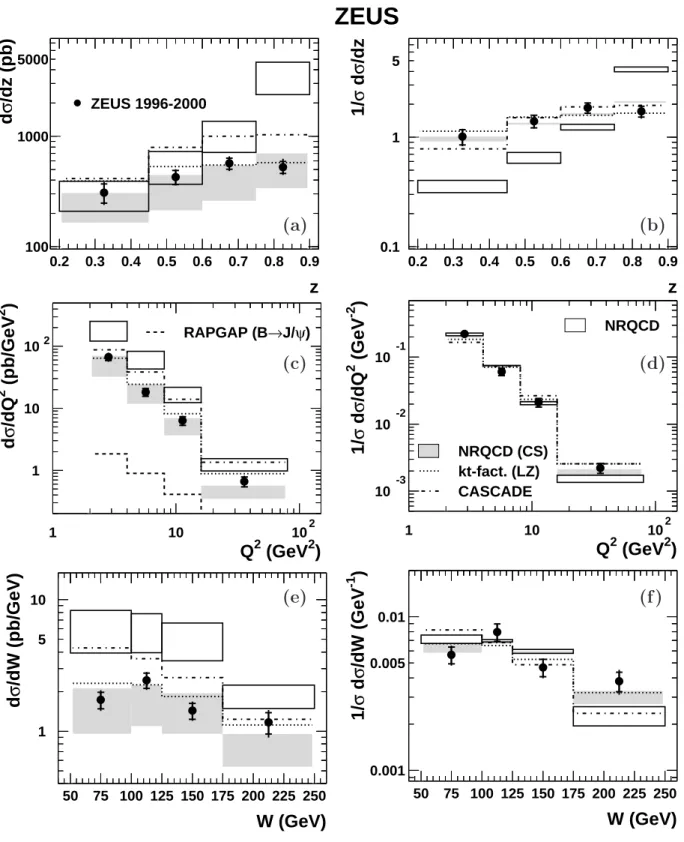
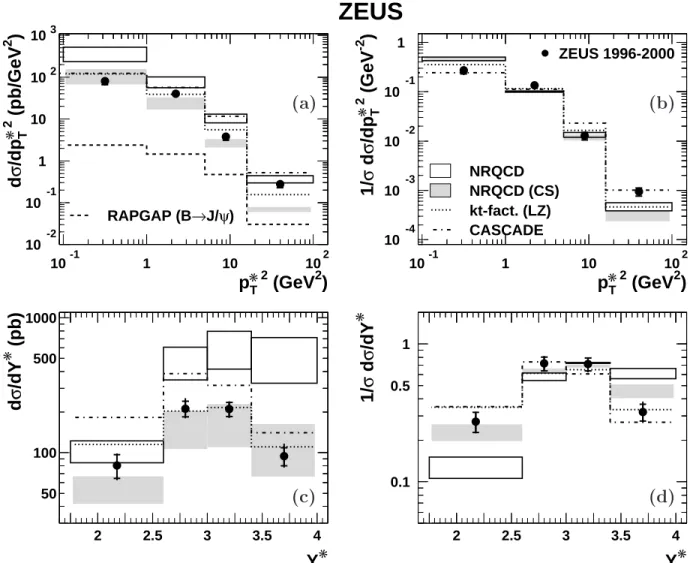
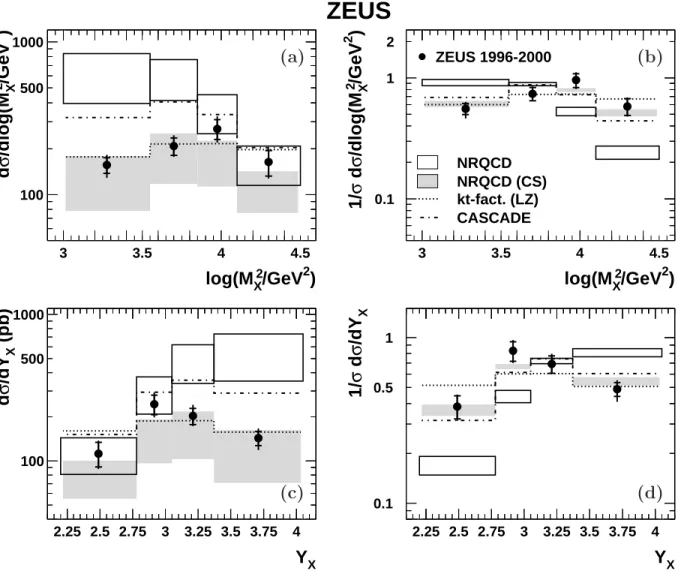
where the first uncertainty is statistical and the second systematic. In Figs. 3, 4 and 5, the differential cross sections as a function of z, Q
2, W , p
∗T2, Y
∗, log M
X2and the rapidity of the hadronic system X, Y
X, are shown. They are compared to the predictions of a NRQCD model [54], a CS model with k
Tfactorisation (LZ) [18] and to the Cascade MC. The beauty contribution, estimated using the Rapgap MC, is also shown separately in Figs. 3c and 4a. All differential cross sections and normalised cross sections are given in Tables 1 and 2.
The uncertainties for the CS and CO NRQCD predictions correspond to variations of the charm–quark mass (m
c= 1.5 ± 0.1 GeV) and of the renormalisation and factorisation scales from
1/
2√ Q
2+ M
ψ2to 2 √
Q
2+ M
ψ2. The uncertainty on the long–distance matrix elements and the effect of different choices of parton distribution functions (default set is MRST98LO) are also taken into account. The bands in the figures shows all these uncertainties added in quadrature.
In general, the CSM is consistent with the data. The predictions including both CS and CO contributions are higher than the data, especially at high z and low p
∗2T. At high values of p
∗2Tthe agreement with the data is reasonable. The prediction does not describe the shapes of the z, Y
∗, log M
X2and Y
Xdistributions. Previous photoproduction results [12, 13] showed that the agreement between data and theory at high z can be improved using resummed LO NRQCD predictions [55]. It should be noted that, in photoproduction, inclusion of the NLO corrections to the CSM, not available for DIS, significantly improved the description of the data.
For the LZ k
T–factorisation predictions, the parametrisation, KMS [56], of the uninte- grated gluon density was used. The charm–quark mass was set to m
c= 1.4 GeV, which is the mass used in the KMS parametrisation. The renormalisation and factorisation scales were both set to µ = k
Tfor k
T> 1 GeV. For k
T≤ 1 GeV the scales were fixed at 1 GeV.
Calculations based on the k
T-factorisation approach give a reasonable description of the data both in shape and normalisation.
The data are also compared with the predictions of the Cascade MC using the k
T- factorisation approach, where gluons are treated according to the CCFM evolution equa- tions. These predictions were obtained by setting the charm–quark mass to 1.5 GeV, the evolution scale of the strong coupling constant to the J/ψ transverse mass, q
M
ψ2+ p
2T, and using the unintegrated gluon–density parametrisation “J2003 set 2”. The Cascade MC is above the data for z > 0.45 and for W < 175 GeV.
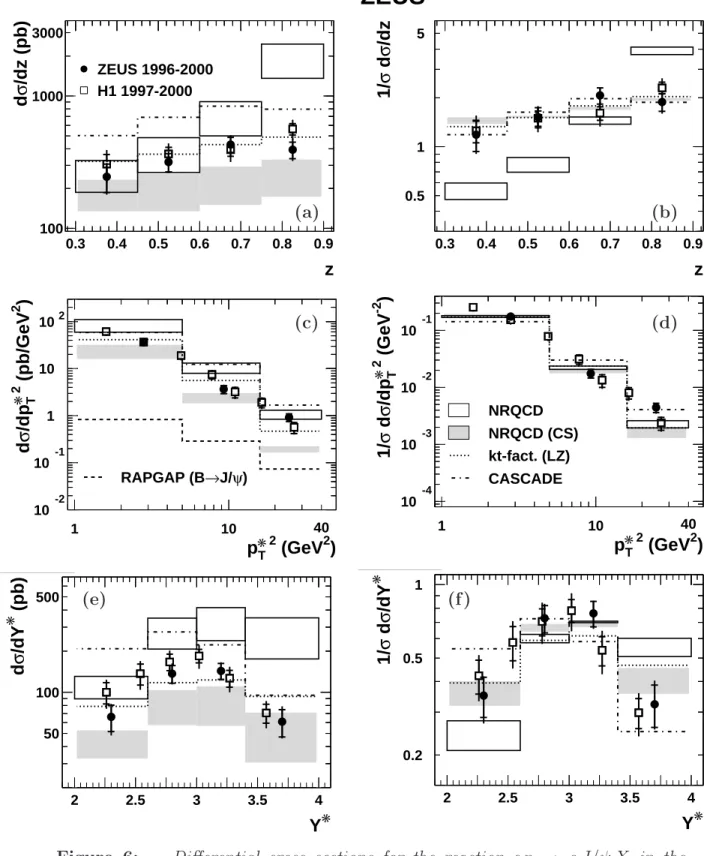
In order to compare the present measurements directly to the H1 results [14], differential cross sections were determined in the kinematic range 2 < Q
2< 100 GeV
2, 50 < W <
225 GeV, 0.3 < z < 0.9 and p
∗2T> 1 GeV
2; all ZEUS differential cross sections and
normalised cross sections are given in Table 3. The results of this comparison are shown in Fig. 6. The present results are in agreement with those from H1. In Fig. 3a, the ZEUS data are in better agreement with the CSM prediction than in Fig. 6a. This is a consequence of the p
∗2T> 1 GeV
2cut used in Fig. 6a combined with the fact that the CS prediction underestimate the data at high p
∗T2, as seen in Fig. 4a.
8 Conclusions
Inelastic J/ψ production in DIS has been measured in the kinematic region 2 < Q
2<
80 GeV
2, 50 < W < 250 GeV, 0.2 < z < 0.9 and − 1.6 < Y
lab< 1.3. The data are in agree- ment with the H1 results in the kinematic region 2 < Q
2< 100 GeV
2, 50 < W < 225 GeV, 0.3 < z < 0.9 and p
∗2T> 1 GeV
2. The data are compared with LO NRQCD predictions, including both CS and CO contributions, and k
T–factorisation calculations. Calculations of the CS process generally agree with the data, whereas inclusion of CO terms spoils this agreement.
Acknowledgments
We thank the DESY Directorate for their strong support and encouragement. The re-
markable achievements of the HERA machine group were essential for the successful
completion of this work. The design, construction and installation of the ZEUS detector
have been made possible by the effort of many people who are not listed as authors. It is a
pleasure to thank B.A. Kniehl, A.V. Lipatov, C.P. Palisoc, N.P. Zotov and L. Zwirner for
providing us with their calculations. We are grateful to H. Jung for helpful discussions.
References
[1] NMC Coll., D. Allasia et al., Phys. Lett. B 258, 493 (1991);
EMC Coll., J. J. Aubert et al., Nucl. Phys. B 213, 1 (1983);
UA1 Coll., C. Albajar et al., Phys. Lett. B 256, 112 (1991).
[2] CDF Coll., F. Abe et al., Phys. Rev. Lett. 69, 3704 (1992).
[3] E. L. Berger and D. Jones, Phys. Rev. D 23, 1521 (1981).
[4] CDF Coll., F. Abe et al., Phys. Rev. Lett. 79, 572 (1997);
CDF Coll., F. Abe et al., Phys. Rev. Lett. 79, 578 (1997).
[5] G. T. Bodwin, E. Braaten and G. P. Lepage, Phys. Rev. D 51, 1125 (1995).
Erratum-ibid D 55, 5853 (1997).
[6] DELPHI Coll., J. Abdallah et al., Phys. Lett. B 565, 76 (2003).
[7] CDF Coll., T. Affolder et al., Phys. Rev. Lett. 85, 2886 (2000).
[8] BaBar Coll., B. Aubert et al., Phys. Rev. Lett. 87, 162002 (2001).
[9] Belle Coll., K. Abe et al., Phys. Rev. Lett. 88, 52001 (2002).
[10] H1 Coll., C. Adloff et al., Phys. Lett. B 483, 23 (2000);
H1 Coll., A. Aktas et al., Phys. Lett. B 568, 205 (2003).
[11] ZEUS Coll., S. Chekanov et al., Eur. Phys. J. C 24, 345 (2002);
ZEUS Coll., S. Chekanov et al., Eur. Phys. J. C 26, 389 (2003).
[12] H1 Coll., C. Adloff et al., Eur. Phys. J. C 25, 25 (2002).
[13] ZEUS Coll., S. Chekanov et al., Eur. Phys. J. C 27, 173 (2003).
[14] H1 Coll., C. Adloff et al., Eur. Phys. J. C 25, 41 (2002).
[15] L.V. Gribov, E.M. Levin and M.G. Ryskin, Phys. Rep. 100, 1 (1983);
E.M. Levin and M.G. Ryskin, Phys. Rep. 189, 267 (1990);
E.M. Levin et al., Sov. J. Nucl. Phys. 53, 657 (1991);
E.M. Levin et al., Sov. J. Nucl. Phys. 54, 867 (1991);
S. Catani, M. Ciafaloni and F. Hautmann, Phys. Lett. B 242, 97 (1990);
S. Catani, M. Ciafaloni and F. Hautmann, Nucl. Phys. B 366, 135 (1991);
J.C. Collins and R.K. Ellis, Nucl. Phys. B 360, 3 (1991);
G. Marchesini and R.K. Webber, Nucl. Phys. B 386, 215 (1992).
[16] E.A. Kuraev, L.N. Lipatov and V.S. Fadin, Sov. Phys. JETP 44, 443 (1976);
E.A. Kuraev, L.N. Lipatov and V.S. Fadin, Sov. Phys. JETP 45, 199 (1977);
Ya.Ya. Balitski˘i and L.N. Lipatov, Sov. J. Nucl. Phys. 28, 822 (1978).
[17] M. Ciafaloni, Nucl. Phys. B 296, 49 (1988);
S. Catani, F. Fiorani and G. Marchesini, Phys. Lett. B 234, 339 (1990).
[18] A. V. Lipatov and N. P. Zotov, Eur. Phys. J. C 27, 87 (2003).
[19] S. P. Baranov and N. P. Zotov, J. Phys., G 29, 1395 (2003).
[20] S. P. Baranov, Phys. Rev. D 66, 114003 (2002).
[21] ZEUS Coll., M. Derrick et al., Phys. Lett. B 293, 465 (1992).
[22] ZEUS Coll., U. Holm (ed.), The ZEUS Detector. Status Report (unpublished), DESY (1993), available on http://www-zeus.desy.de/bluebook/bluebook.html.
[23] N. Harnew et al., Nucl. Inst. Meth. A 279, 290 (1989);
B. Foster et al., Nucl. Phys. Proc. Suppl. B 32, 181 (1993);
B. Foster et al., Nucl. Inst. Meth. A 338, 254 (1994).
[24] M. Derrick et al., Nucl. Inst. Meth. A 309, 77 (1991);
A. Andresen et al., Nucl. Inst. Meth. A 309, 101 (1991);
A. Caldwell et al., Nucl. Inst. Meth. A 321, 356 (1992);
A. Bernstein et al., Nucl. Inst. Meth. A 336, 23 (1993).
[25] A. Bamberger et al., Nucl. Inst. Meth. A 401, 63 (1997).
[26] ZEUS Coll., S. Chekanov et al., Eur. Phys. J. C 21, 443 (2001).
[27] A. Dwurazny et al., Nucl. Inst. Meth. A 277, 176 (1989).
[28] G. Abbiendi et al., Nucl. Inst. Meth. A 333, 342 (1993).
[29] J. Andruszk´ow et al., Preprint DESY-92-066, DESY, 1992;
ZEUS Coll., M. Derrick et al., Z. Phys. C 63, 391 (1994);
J. Andruszk´ow et al., Acta Phys. Pol. B 32, 2025 (2001).
[30] W. H. Smith, K. Tokushuku and L. W. Wiggers, Proc. Computing in High-Energy Physics (CHEP), Annecy, France, Sept. 1992, C. Verkerk and W. Wojcik (eds.), p. 222. CERN, Geneva, Switzerland (1992). Also in preprint DESY 92-150B.
[31] H. Abramowicz, A. Caldwell and R. Sinkus, Nucl. Inst. Meth. A 365, 508 (1995);
R. Sinkus and T. Voss, Nucl. Inst. Meth. A 391, 360 (1997).
[32] U. Bassler and G. Bernardi, Nucl. Inst. Meth. A 361, 197 (1995).
[33] ZEUS Coll., J. Breitweg et al., Eur. Phys. J. C 1, 81 (1998);
G. M. Briskin, Ph.D. Thesis, Tel Aviv University, (1998). DESY-THESIS-1999-036.
[34] F. Jacquet and A. Blondel, Proc. the Study of an eP Facility for Europe, U. Amaldi (ed.), p. 391. (1979). Also in preprint DESY 79-48.
[35] Particle Data Group, S. Eidelman et al., Phys. Lett. B 592, 1 (2004).
[36] H. Jung, Proc. Workshop on Physics at HERA, W. Buchm¨ uller and G. Ingelman (eds.), Vol. 3, p. 1488, DESY, Hamburg, Germany (1992);
H. Jung et al., Z. Phys. C 60, 721 (1993).
[37] L. L¨onnblad, Comp. Phys. Comm. 71, 15 (1992).
[38] M. Gl¨ uck, E. Reya and A. Vogt, Eur. Phys. J. C 5, 461 (1998).
[39] B. Andersson et al., Phys. Rep. 97, 31 (1983).
[40] H. Jung and G. P. Salam, Eur. Phys. J. C 19 (2001).
[41] H. Jung, Mod. Phys. Lett., A 19, 1 (2004).
[42] M. Kasprzak, Ph.D. Thesis, Warsaw University, Warsaw, Poland (1996).
DESY F35D-96-16.
[43] L. Adamczyk, Ph.D. Thesis, University of Mining and Metallurgy, Cracow, Poland (1999). DESY-THESIS-1999-045.
[44] B. List and A. Mastroberardino, Proc. Workshop on Monte Carlo Generators for HERA Physics, A.T. Doyle, et al. (eds.), p. 396. DESY, Hamburg, Germany (1999). Also in preprint DESY-PROC-1999-02, available on
http://www.desy.de/~heramc/.
[45] H. Jung, Comp. Phys. Comm. 86, 147 (1995).
[46] CTEQ Coll., H.L. Lai et al., Eur. Phys. J. C 12, 375 (2000).
[47] ZEUS Coll., S. Chekanov et al., Phys. Lett. B 599, 173 (2004).
[48] R. Brun et al., geant3 , Technical Report CERN-DD/EE/84-1, CERN, 1987.
[49] M. Kr¨amer et al., Phys. Lett. B 348, 657 (1995);
M. Kr¨amer, Nucl. Phys. B 459, 3 (1996).
[50] M. Kr¨amer, Prog. Part. Nucl. Phys., 47, 141 (2001).
[51] A. Kwiatkowski, H. Spiesberger and H.-J. M¨ohring, Comp. Phys. Comm.
69, 155 (1992). Also in Proc. Workshop Physics at HERA, DESY, Hamburg (1991).
[52] ZEUS Coll., S. Chekanov et al., Phys. Rev. D 69, 12004 (2004).
[53] M. Turcato, Ph.D. Thesis, Padova University (2002). DESY-THESIS-2003-039.
[54] B. A. Kniehl and L. Zwirner, Nucl. Phys. B 621, 337 (2002).
[55] M. Beneke, G. A. Schuler and S. Wolf, Phys. Rev. D 62, 34004 (2000).
[56] J. Kwiecinski, A. D. Martin and A. M. Stasto, Phys. Rev. D 56, 3991 (1997).
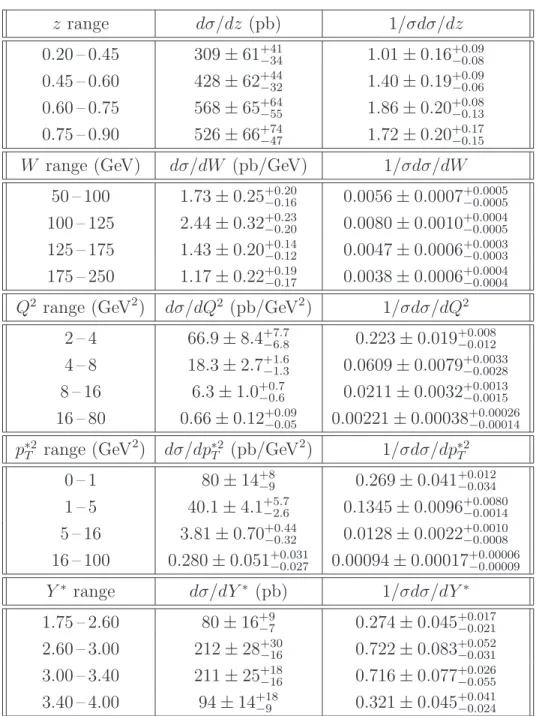
z range dσ/dz (pb) 1/σdσ/dz 0.20 – 0.45 309 ± 61
+41−341.01 ± 0.16
+0.09−0.080.45 – 0.60 428 ± 62
+44−321.40 ± 0.19
+0.09−0.060.60 – 0.75 568 ± 65
+64−551.86 ± 0.20
+0.08−0.130.75 – 0.90 526 ± 66
+74−471.72 ± 0.20
+0.17−0.15W range (GeV) dσ/dW (pb/GeV) 1/σdσ/dW
50 – 100 1.73 ± 0.25
+0.20−0.160.0056 ± 0.0007
+0.0005−0.0005100 – 125 2.44 ± 0.32
+0.23−0.200.0080 ± 0.0010
+0.0004−0.0005125 – 175 1.43 ± 0.20
+0.14−0.120.0047 ± 0.0006
+0.0003−0.0003175 – 250 1.17 ± 0.22
+0.19−0.170.0038 ± 0.0006
+0.0004−0.0004Q
2range (GeV
2) dσ/dQ
2(pb/GeV
2) 1/σdσ/dQ
22 – 4 66.9 ± 8.4
+7.7−6.80.223 ± 0.019
+0.008−0.0124 – 8 18.3 ± 2.7
+1.6−1.30.0609 ± 0.0079
+0.0033−0.00288 – 16 6.3 ± 1.0
+0.7−0.60.0211 ± 0.0032
+0.0013−0.001516 – 80 0.66 ± 0.12
+0.09−0.050.00221 ± 0.00038
+0.00026−0.00014p
∗2Trange (GeV
2) dσ/dp
∗2T(pb/GeV
2) 1/σdσ/dp
∗2T0 – 1 80 ± 14
+8−90.269 ± 0.041
+0.012−0.0341 – 5 40.1 ± 4.1
+5.7−2.60.1345 ± 0.0096
+0.0080−0.00145 – 16 3.81 ± 0.70
+0.44−0.320.0128 ± 0.0022
+0.0010−0.000816 – 100 0.280 ± 0.051
+0.031−0.0270.00094 ± 0.00017
+0.00006−0.00009Y
∗range dσ/dY
∗(pb) 1/σdσ/dY
∗1.75 – 2.60 80 ± 16
+9−70.274 ± 0.045
+0.017−0.0212.60 – 3.00 212 ± 28
+30−160.722 ± 0.083
+0.052−0.0313.00 – 3.40 211 ± 25
+18−160.716 ± 0.077
+0.026−0.0553.40 – 4.00 94 ± 14
+18−90.321 ± 0.045
+0.041−0.024Table 1: Differential cross sections and normalised differential cross sections in the kinematic region 2 < Q
2< 80 GeV
2, 50 < W < 250 GeV , 0.2 < z < 0.9 and
− 1.6 < Y
lab< 1.3 as a function of z, W , Q
2, p
∗2Tand Y
∗. The first uncertainty is
statistical and the second is systematic. Overall normalisation uncertainties due to
the luminosity measurement ( ± 2%) and to the J/ψ decay branching ratio (1.7%)
are not included in the systematic error.
log(M
X2/GeV
2) range dσ/d log(M
X2/GeV
2) (pb) 1/σdσ/d log(M
X2/GeV
2) 3.00 – 3.55 156 ± 18
+19−200.556 ± 0.057
+0.052−0.0743.55 – 3.85 208 ± 27
+25−160.740 ± 0.091
+0.056−0.0213.85 – 4.10 270 ± 40
+38−310.96 ± 0.13
+0.09−0.084.10 – 4.50 164 ± 31
+21−180.581 ± 0.092
+0.054−0.050Y
Xrange dσ/dY
X(pb) 1/σdσ/dY
X2.20 – 2.78 112 ± 21
+13−110.383 ± 0.061
+0.033−0.0332.78 – 3.05 243 ± 37
+33−260.83 ± 0.11
+0.08−0.073.05 – 3.37 203 ± 26
+29−150.692 ± 0.083
+0.067−0.0183.37 – 4.05 143 ± 16
+17−180.488 ± 0.047
+0.044−0.063Table 2: Differential cross sections and normalised differential cross sections in the kinematic region 2 < Q
2< 80 GeV
2, 50 < W < 250 GeV , 0.2 < z < 0.9 and
− 1.6 < Y
lab< 1.3 as a function of log(M
X2/GeV
2) and Y
X. The first uncertainty is
statistical and the second is systematic. Overall normalisation uncertainties due to
the luminosity measurement ( ± 2%) and to the J/ψ decay branching ratio (1.7%)
are not included in the systematic error.
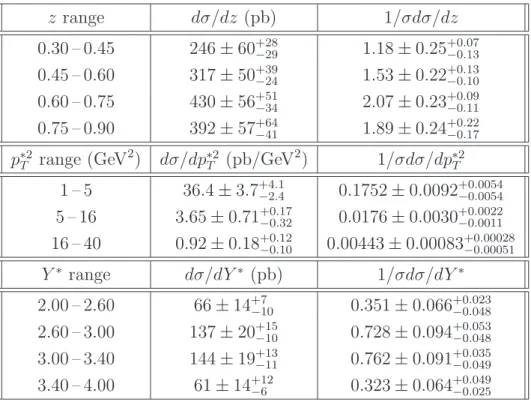
z range dσ/dz (pb) 1/σdσ/dz 0.30 – 0.45 246 ± 60
+28−291.18 ± 0.25
+0.07−0.130.45 – 0.60 317 ± 50
+39−241.53 ± 0.22
+0.13−0.100.60 – 0.75 430 ± 56
+51−342.07 ± 0.23
+0.09−0.110.75 – 0.90 392 ± 57
+64−411.89 ± 0.24
+0.22−0.17p
∗2Trange (GeV
2) dσ/dp
∗2T(pb/GeV
2) 1/σdσ/dp
∗2T1 – 5 36.4 ± 3.7
+4.1−2.40.1752 ± 0.0092
+0.0054−0.00545 – 16 3.65 ± 0.71
+0.17−0.320.0176 ± 0.0030
+0.0022−0.001116 – 40 0.92 ± 0.18
+0.12−0.100.00443 ± 0.00083
+0.00028−0.00051Y
∗range dσ/dY
∗(pb) 1/σdσ/dY
∗2.00 – 2.60 66 ± 14
+7−100.351 ± 0.066
+0.023−0.0482.60 – 3.00 137 ± 20
+15−100.728 ± 0.094
+0.053−0.0483.00 – 3.40 144 ± 19
+13−110.762 ± 0.091
+0.035−0.0493.40 – 4.00 61 ± 14
+12−60.323 ± 0.064
+0.049−0.025Table 3: Differential cross sections and normalised differential cross sections in
the kinematic region 2 < Q
2< 100 GeV
2, 50 < W < 225 GeV , 0.3 < z < 0.9 and
p
∗2T> 1 GeV
2as a function of z, p
∗2Tand Y
∗. The first uncertainty is statistical and
the second is systematic. Overall normalisation uncertainties due to the luminosity
measurement ( ± 2%) and to the J/ψ decay branching ratio (1.7%) are not included
in the systematic error.
0 20 40 60 80 100 120
2 3 4 5
M (GeV) µ + µ -
Combinations per 0.025 GeV
ZEUS 1996-2000 Gauss mod + P1
N(J/ψ) = 338 ± 25
ZEUS
Figure 1: Invariant mass spectrum after all selection cuts in the kinematic region
2 < Q
2< 80 GeV
2, 50 < W < 250 GeV , 0.2 < z < 0.9 and − 1.6 < Y
lab< 1.3. The
curve is the result of the fit with a modified Gaussian for the signal (see text) and
a linear function (P1) for the non–resonant background.
0 50 100
0.2 0.4 0.6 0.8 0
50 100
10
0 50 100
50 150 250 0
50 100 150
10
-11 10
0 50 100
2 3 4
ZEUS
z
J/ ψ mesons
ZEUS 1996-2000 EPJPSI MC rew.
Q
2(GeV
2)
J/ ψ mesons
50 2
W (GeV)
J/ ψ mesons
p
✳ 2T(GeV
2)
J/ ψ mesons
Y
✳J/ ψ mesons
M
2X(GeV
2)
J/ ψ mesons
10
30 25 50 75 100
10
4(a) (b)
(c) (d)
(e) (f)
Figure 2: Number of J/ψ mesons reconstructed in the kinematic region 2 <
Q
2< 80 GeV
2, 50 < W < 250 GeV , 0.2 < z < 0.9 and − 1.6 < Y
lab< 1.3 plotted
as a function of (a) z, (b) Q
2, (c) W , (d) p
∗T2, (e) Y
∗and (f ) M
X2. The data
distributions are shown as the points with statistical errors only. The histograms
show the Epjpsi MC predictions reweighted to the data shapes in Q
2and p
∗2Tand
area normalised to the data.
50 75 100 125 150 175 200 225 250 1
5 10
d σ /dW (pb/GeV)
W (GeV)
1 10 10
21 10 10
2d σ /dQ
2(pb/GeV
2)
Q
2(GeV
2)
RAPGAP (B → J/ ψ ) 0.2 0.3 0.4 0.5 0.6 0.7 0.8 0.9 100
1000 5000
d σ /dz (pb)
z
ZEUS 1996-2000
50 75 100 125 150 175 200 225 250 0.001
0.005 0.01
1/ σ d σ /dW (GeV
-1)
W (GeV)
10
-3
10
-2
10
-1
1 10 10
21/ σ d σ /dQ
2(GeV
-2)
Q
2(GeV
2)
NRQCD
NRQCD (CS) kt-fact. (LZ) CASCADE
0.2 0.3 0.4 0.5 0.6 0.7 0.8 0.9 0.1
1 5
1/ σ d σ /dz
z
ZEUS
(a) (b)
(c) (d)
(e) (f)
Figure 3: Differential cross sections for the reaction e p → e J/ψ X in the kinematic region 2 < Q
2< 80 GeV
2, 50 < W < 250 GeV , 0.2 < z < 0.9 and
− 1.6 < Y
lab< 1.3 as a function of (a) z, (c) Q
2and (e) W . The inner error bars
of the data points show the statistical uncertainty; the outer bars show statistical
and systematic uncertainties added in quadrature. The data are compared to LO
NRQCD predictions, a LO CS calculation, a prediction in the k
T–factorisation
approach within the CSM and the Cascade MC predictions. (b), (d) and (f ) show
the data and the theoretical predictions normalised to unit area.
2 2.5 3 3.5 4 50
100 500 1000
d σ /dY
✳(pb)
Y
✳10
-210
-1
1 10 10
210
310
-11 10 10
2d σ /dp
T✳ 2(pb/GeV
2)
p
T✳ 2(GeV
2)
RAPGAP (B→J/ψ)
2 2.5 3 3.5 4
0.1 0.5 1
1/ σ d σ /dY
✳Y
✳10
-410
-310
-210
-1