Regensburger
DISKUSSIONSBEITRÄGE zur Wirtschaftswissenschaft
University of Regensburg Working Papers in Business, Economics and Management Information Systems
Linking Multi-Category Purchases to Latent Activities of Shoppers: Analysing Market Baskets by Topic Models
Harald Hruschka∗ September 5, 2014
Nr. 482
JEL Classification: M32, L81, C35, C11
Key Words: multi-category buying behavior; market basket analysis; topic models
∗Prof. Dr. Harald Hruschka, Marketing Chair at the Department of Business Administration, Faculty of Business, Economics and Management Information Systems , University of Regensburg, 93040 Regensburg, Germany, Phone: +49-941-943-2279, E-mail: harald.hruschka@wiwi.uni-r.de
Abstract
We investigate the application of two topic models, latent Dirichlet allocation (LDA) and the correlated topic model (CTM), to market basket analysis. Topic models measure the association between observed purchases and underlying latent activities of shoppers by conceiving each basket as random mixture of latent activities. We explain the structure of the two topic models used. We discuss estimation of LDA models by blocked Gibbs sampling. In addition we show how to evaluate the performance of topic models on esti- mation and holdout data. In the empirical study we analyse a total of 18,000 purchases made at a medium-sized supermarket which refer to 60 product categories. The LDA model performs better than the CTM in terms of log likelihood values. Latent activities inferred by this models are intuitive and interpretable, e.g., related to shopping of bev- erages or personal care, to baking or to an inclination towards luxury food. To illustrate the managerial relevance of estimated topic models we sketch the core of a recommender system which ranks purchase probabilities of other product categories conditional on the basket of a shopper.
Keywords: multi-category buying behavior; market basket analysis; topic models
1. Introduction
In text mining the use of topic models is widespread and quite successful (Sun/Deng/Han 2012). We investigate the application of topic models to market basket analysis. Con- sistent with extant work on analysing cross-category purchases we look at purchases of product categories made by individual customers. The overwhelming majority of rel- evant contributions in the marketing literature are based on either multivariate logit models (e.g., Boztug/Hildebrandt 2008; Boztug/Reutterer 2008; Dippold/Hruschka 2013;
Russell/Petersen 2000.) or multivariate probit models (e.g., Chib/Seetharaman/Strijnev 2002;Duvvuri/Ansari/Gupta2007;Manchanda/Ansari/Gupta 1999.). These models con- sider pairwise relations between product categories only. In probit models these relations are reproduced by cross-category coefficients. In probit models pairwise residual correla- tions serve the same purpose.
Using topic models we do not restrict attention to pairwise relationships between cate- gories. Instead we focus on the association between observed purchases and underlying
latent activities of shoppers. Activities constitute a major element in definitions of con- sumer behaviour. For example, consumer behaviour is equated with ”activities people engage in when searching for, selecting, purchasing, using, evaluating, and disposing of products and services so as to satisfy their needs and desires ” (Belch/Belch2003, p. 105).
Topic models applied to market basket data infer latent activities from observed pur- chases, i.e., they only need data which are available to many firms. This way additional costs of primary research by, e.g. surveys, may be avoided. Topic models conceive a basket which consists of the categories purchased by a shopper as random mixture of latent activities. Latent activities are distributed over product categories and reflect co- occurrence of categories in shoppers’ baskets. In a grocery retailing context, for example, a latent activity may alternatively indicate which product categories are more important if a shopper wants to prepare a breakfast, intends to bake a cake or does the weekly purchase of beverages or personal care products, etc.
Our study is related to a paper ofBoztug/Reutter (2008)who determine basket prototypes using purchase data for 65 product categories using an online version of K-means. Topic models differ from K-means and similar clustering techniques in several respects. Firstly, K-means associates each basket with a single prototype, whereas topic models sample the latent variable repeatedly within a basket. Therefore topic models allow that a basket may be linked to several latent activities and reflect that a shopper may pursue several activities at the same time (e.g., that a shopper both prepares breakfast and does the weekly purchase of personal care products).
Secondly, in contrast to most clustering techniques topic models are based on a statistically defined objective function, e.g., a log likelihood function. Thirdly, topic models can be extended to measure the effect of predictors (e.g., socio-demographic or marketing variables), whereas clustering techniques exclude predictors.
Our main research goal consists in assessing whether basic topic models are appropriate tools for market basket analysis. To this end we use a data set which encompasses purchases referring to 60 categories. This number is much higher than the about five categories found in most multivariate logit and probit models estimated on market basket data sets.
We continue by explaining the structure of the two topic models, latent Dirichlet allocation (LDA) and the correlated topic model (CTM), by which we analyse market basket data.
We discuss estimation of LDA models by blocked Gibbs sampling. Then we show how to evaluate the performance of topic models with respect to estimation and holdout data.
The next section deals with the empirical study. It provides descriptive statistics, presents estimation results and gives an illustration of the managerial relevance of an estimated topic model. In the final section we summarize results, indicate advantages of topic models and discuss both limitations of our study as well as possibilities for future research.
2. Topic Models
In text mining applications topic models as a rule serve to relate words appearing in documents to discrete latent variables which are called topics. To the benefit of readers with a marketing background we will in the following only refer to product categories, market baskets and latent activities which take the place of words, documents and topics, respectively. We present and apply two topic models, latent Dirichlet allocation (LDA) and the correlated topic model (CTM).
Comprehensive descriptions of LDA and typical applications can be found in the text min- ing literature (e.g., Blei 2012; Blei/Ng/Jordan2003; Steyvers/Griffiths 2007;Sun/Deng/
Han 2012.). Tirunillai/Tellis (2014) present a marketing-related text mining study in which they extract latent dimensions of consumer satisfaction by LDA using consumers’
online product reviews.
According to LDA the product categories contained in each basket are generated by a mixture of latent activities. All baskets share the same latent activities, but their proportions are specific to each basket and randomly drawn from a Dirichlet basket- activity distribution. For each activity assigned to a basket this way a product category is chosen randomly from its corresponding distribution. LDA forms activities in such a way that categories with higher conditional probabilities for an activity frequently co- occur with each other in baskets (Crain et al. 2012, p. 143).
Let I, J and K denote the number of baskets, product categories and latent activities, respectively. Random parameters in a (J, K) matrix φ and a (K, I) matrix θ indicate the importance of categories for activities and the importance of activities for baskets, respectively. The k−th column of φ holds the conditional probability of the categories conditional on latent activity k and therefore sums to one.
The probability pij that basket i contains category j is related to the importance of this
category for activities and the importance of activities for this basket in the following manner (Griffiths/Steyvers2004, p. 5228):
(1) pij =
K
X
k=1
φjkθki
θ and φ are smoothed by Dirichlet hyperparameters α and β. α can be interpreted as prior count of the number of times any latent activity is assigned to a basket, before having observed any category contained in the basket. Low values of α lead to sparse distributions favoring a low number of activities. βon the other hand can be seen as prior count of the number of times that categories are sampled from a latent activity before the purchase of any category is observed. Each category j in a market basket i is linked to activities by integer random variableszi = 1,· · · , K which give the index of the generated activity.
We estimate LDA models by blocked Gibbs sampling, i.e. marginalizing out parameters inφandθ. Blocked Gibbs sampling determines the posterior distribution over latent vari- ables zi (the assignment of categories to topics), given the observed categories. For each basket i the Gibbs sampling procedure considers each category j purchased in turn, and determines the probability of assigning the current category to each activity, conditioned on the activity assignments of all other categories. From this conditional distribution an activity is sampled and stored as the new activity assignment for this category.
We denote this conditional distribution as P(zj = k|z−j,−j,−i). zj = k represents the topic assignment of category j to activity k, z−j the topic assignments of all other categories ,−j and−iare indices of all other categories and all other baskets, respectively.
This conditional probability is proportional to (Griffiths/Steyvers2004, p. 5229):
n1jk−1 +β n1jk −1 +P
j′6=jn1j′k+J β
n2ki−1 +α n2ki−1 +P
k′6=kn2ik′ +Kα (2)
Count variablesn1jkandn2kicontain the number of times categoryjis assigned to activity k and the number of times activity k is assigned to the categories of current basket i, respectively. The terms with −1 in expression (2) show that the current category and the current basket are not relevant for computing this conditional probability.
The left part of expression (2) equals the probability of category j under activity k. Its right part equals the probability of activity k under the current distribution of activities for basketi. Once a category has been frequently assigned to activitykacross all baskets,
it will increase the probability of assigning any instance of that category to activity k.
At the same time, if activity k has been used many times in a basket, it will increase the probability that any category in that basket will be assigned to activity k. Therefore, categories are assigned to activities depending on how likely the category is for a activity, as well as on how important an activity is in a basket.
Based on count variables n1jk and n2ki posterior estimates of parameters φjk and θki can be computed as (Griffiths/Steyvers2004, p. 5230):
φjk = n1jk +β PJ
j=1n1jk+J β (3)
θki = n2ki+α PK
k=1n2ki+Kα (4)
The correlated topic model (CTM) allows for arbitrary correlations between activities which may be of advantage if activities are highly correlated (Blei/Lafferty2007). In this respect the CTM differs from LDA which implies very small negative correlations between activities (Blei/Lafferty 2007, p. 21).
The generation of baskets according to the CTM occurs in the same way as for the LDA except that activity proportions are drawn from a logistic normal (Aitchson/Shen 1980) rather than from a Dirichlet distribution. For each basket a K −1 dimensional vector of random variables µ1i,· · · , µki is drawn from a multivariate normal distribution with complete (K −1, K −1) covariance matrix. The latter allows for correlations between activities.
Activity proportions result from the following multiple logistic transformation of these random variables (similar to Blei/Lafferty 2007, p. 20):
θki =
expµki
1+PK−1
k=1 expµki for k = 1,· · · , K−1
1 1+PK−1
k=1 expµki for k =K (5)
Like for LDA models we estimate CTM models by blocked Gibbs sampling, but to this end we have to add an appropriate data augmentation step for Bayesian logistic regression developed by Polsen/Scott/Windle (2013). We do not explain the CTM in more detail because its estimation is technically more involved and in the empirical study CTM models did not perform better than their LDA counterparts.
We evaluate the performance of topic models by log likelihood values both for estimation and for holdout data. We apply models determined on the basis of estimation data to holdout data to assess whether models are prone to overfitting.
The log likelihoodLLe across baskets and categories for the estimation data is defined as (Newman et al. 2009, p. 1811):
(6) LLe =
Ie
X
i=1 J
X
j=1
yij 1 S log
K
X
k=1 S
X
s=1
φsjkθski
Ie is the number of baskets in the estimation data set. yij is a binary indicator variable which equals one if basket i contains category j, otherwise it is zero. The log likelihood is defined as average across S parameter samples (φsjk and θkis denote parameter samples with s = 1,· · · , S).
The log likelihood LLh for the holdout data set is computed in an analogous manner:
(7) LLh =
Ih
X
i=1 J
X
j=1
yij 1 S log
K
X
k=1 S
X
s=1
φjkθski
Ih is the number of baskets in the holdout data set. To evaluate the holdout data the category-activities distribution remains constant by setting φjk parameters to their aver- age sampled values for the estimation data. For blocked Gibbs sampling on the holdout data therefore the left part of expression (2) is replaced by the corresponding constant es- timate ofφjk. Only theθki parameters which describe the activities to basket distribution are estimated according to equation (4).
3. Empirical Study
3.1. Data
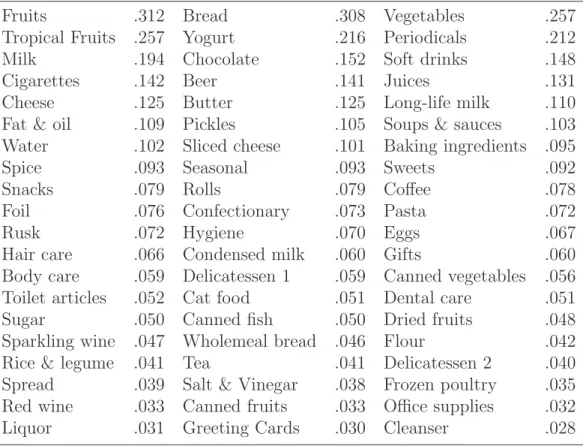
The data of the empirical study consist of 18,000 market baskets of purchases made at a medium-sized supermarket. The median number of categories purchased per basket equals four. 25 % of the baskets contain eight or more product categories. Out of a total of 209 categories, we analyse the 60 categories with the highest univariate purchase frequencies (see Tab. 1). We randomly divide the 18,000 baskets into two data sets and estimate topic models using the larger data set of 12,600 markets baskets. The remaining 5,400 baskets serve as holdout data.
3.2. Estimation Results
For each model the respective blocked Gibbs sampler performs 4,000 iterations for the estimation data and 400 iterations for the holdout data, respectively. Note that one
Fruits .312 Bread .308 Vegetables .257 Tropical Fruits .257 Yogurt .216 Periodicals .212
Milk .194 Chocolate .152 Soft drinks .148
Cigarettes .142 Beer .141 Juices .131
Cheese .125 Butter .125 Long-life milk .110
Fat & oil .109 Pickles .105 Soups & sauces .103 Water .102 Sliced cheese .101 Baking ingredients .095
Spice .093 Seasonal .093 Sweets .092
Snacks .079 Rolls .079 Coffee .078
Foil .076 Confectionary .073 Pasta .072
Rusk .072 Hygiene .070 Eggs .067
Hair care .066 Condensed milk .060 Gifts .060
Body care .059 Delicatessen 1 .059 Canned vegetables .056 Toilet articles .052 Cat food .051 Dental care .051
Sugar .050 Canned fish .050 Dried fruits .048
Sparkling wine .047 Wholemeal bread .046 Flour .042 Rice & legume .041 Tea .041 Delicatessen 2 .040 Spread .039 Salt & Vinegar .038 Frozen poultry .035 Red wine .033 Canned fruits .033 Office supplies .032
Liquor .031 Greeting Cards .030 Cleanser .028
Table 1: Relative univariate frequencies of analysed categories
iteration includes a complete pass over all market baskets in the estimation and holdout data set, respectively. The first half of these iterations is used for burn-in. Log likelihood values and parameter estimates are arithmetic averages across iterations of the second half.
For Gibbs sampling we set the the hyperparameters α =.4 and β = .01 after trial runs with several values. Especially higher values for β (e.g., β =.1) lead to much lower log likelihood values. These results are in accordance with the study ofAsuncion et al. (2009) who investigate how sensitive the performance of topic models is with respect to values of hyperparameters.
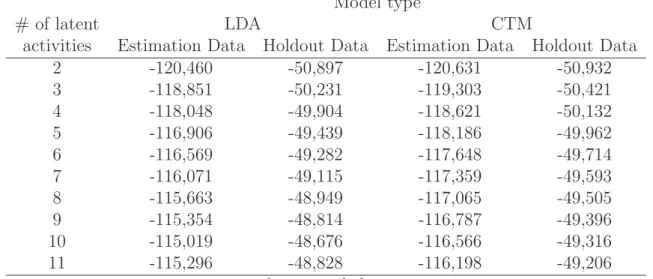
Tab. 2 gives the log likelihood values of LDA and CTM models with a minimum of two and a maximum of eleven latent activities both for the estimation and holdout data.
These models all perform better than the independent model which is based on marginal frequencies only and attains log likelihood values of -123,056 and -52,035 for the estima- tion and holdout data, respectively. We obtain the best log likelihood values both for estimation and holdout data for the LDA with ten latent activities. Results turn out to be quite robust as the ranking of models with different numbers of latent activities for the estimation data set does not change if these models are applied to the holdout data.
Model type
# of latent LDA CTM
activities Estimation Data Holdout Data Estimation Data Holdout Data
2 -120,460 -50,897 -120,631 -50,932
3 -118,851 -50,231 -119,303 -50,421
4 -118,048 -49,904 -118,621 -50,132
5 -116,906 -49,439 -118,186 -49,962
6 -116,569 -49,282 -117,648 -49,714
7 -116,071 -49,115 -117,359 -49,593
8 -115,663 -48,949 -117,065 -49,505
9 -115,354 -48,814 -116,787 -49,396
10 -115,019 -48,676 -116,566 -49,316
11 -115,296 -48,828 -116,198 -49,206
values rounded to nearest integer Table 2: Log likelihood values
At each of the investigated number of latent activities the CTM model attains lower log likelihood values than the corresponding LDA models. This results is in agreement with the very low estimated correlations between latent activities estimated for the CTM models. With respect to correlations of latent activities LDA and CTM do not really differ and LDA has the advantage of a lower number of parameters (e.g., for ten latent activities LDA has 36 parameters less). In view of its superior performance we only present and discuss estimation results of the LDA model with ten latent activities in the following.
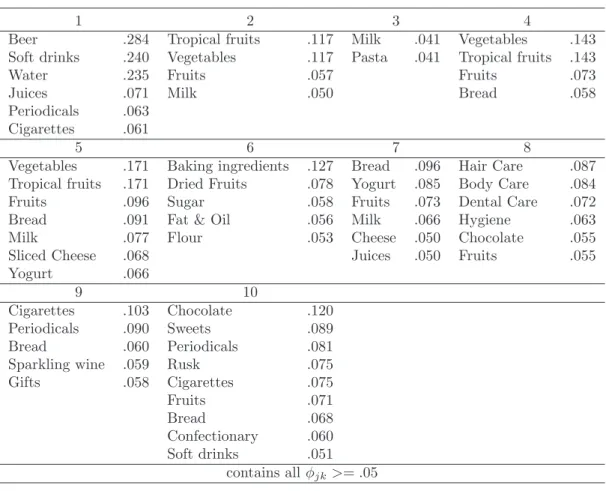
Tab. 3 gives importances of the product categories (i.e., the estimated φjk parameters) which are at least equal to .05. Most of the inferred latent activities are well defined and different from each other. In addition the latent activities of table 3 are intuitive and interpretable.
Activity 1 focuses on beverages and also includes periodicals and cigarettes, activity 3 focuses on milk and pasta. Activity 6 refers to various products appropriate for baking.
Activity 7 comprises bread and dairy products which are often purchased for breakfast.
Activity 8 is related to purchasing personal care products. Cigarettes, periodicals, bread, and sparkling wine are important categories for activity 9. Activity 10 shows an inclination towards luxury food, i.e., sweets, chocolate, confectionary, and cigarettes.
Several of the important categories for activities 2, 4, and 5 are identical, namely veg- etables, tropical fruits, and fruits. On the other hand activity 5 reflects a much broader assortment of shoppers as it also includes dairy products. Overall the latent activities in- ferred turn out to be more distinctive than the 14 prototypes chosen in Boztug/Reutterer
1 2 3 4
Beer .284 Tropical fruits .117 Milk .041 Vegetables .143 Soft drinks .240 Vegetables .117 Pasta .041 Tropical fruits .143
Water .235 Fruits .057 Fruits .073
Juices .071 Milk .050 Bread .058
Periodicals .063 Cigarettes .061
5 6 7 8
Vegetables .171 Baking ingredients .127 Bread .096 Hair Care .087 Tropical fruits .171 Dried Fruits .078 Yogurt .085 Body Care .084
Fruits .096 Sugar .058 Fruits .073 Dental Care .072
Bread .091 Fat & Oil .056 Milk .066 Hygiene .063
Milk .077 Flour .053 Cheese .050 Chocolate .055
Sliced Cheese .068 Juices .050 Fruits .055
Yogurt .066
9 10
Cigarettes .103 Chocolate .120
Periodicals .090 Sweets .089
Bread .060 Periodicals .081
Sparkling wine .059 Rusk .075
Gifts .058 Cigarettes .075
Fruits .071
Bread .068
Confectionary .060 Soft drinks .051
contains allφjk>=.05
Table 3: Product categories’ importances for latent activities 1-10
(2008). Five of their 14 prototypes focus on dairy products, three on beverages and one prototype on personal care categories.
3.3. Managerial Relevance
To illustrate the managerial relevance of topic models we sketch the core of a recommender system which processes estimated parameters of a LDA. Recommendations to a shopper are based on the categories already purchased and consist of categories with higher con- ditional probabilities. Such a system is of obvious interest for cross-selling programs of online retailers (see, e.g., Mild/Reutterer2003 for an overview of recommender systems), but could also be used by brick-and-mortar retailers if they get online information about market baskets of shoppers via electronic cash registers. In such a situation product recommendations may be added to the receipt printed out at the POS.
We explain the working of such a recommender system for initial baskets of two categories j1 and j2, the extension to baskets of larger size being rather straightforward. The pur- chase probability of any other category j3 6=j1, j2 conditional on purchases of categories
Rank Bread, Beer Bread, Tropical Fruits Bread, Flour
1 Soft drinks Vegetables Baking Ingred.
2 Water Fruits Dried Fruits
3 Cigarettes Milk Fat & Oil
4 Periodicals Yogurt Sugar
5 Juices Sliced Cheese Butter
Rank Bread, Hair Care Bread, Cigarettes Bread, Sweets
1 Fruits Periodicals Chocolate
2 Chocolate Soft Drinks Periodicals
3 Body Care Chocolate Fruits
4 Periodicals Beer Cigarettes
5 Dental Care Fruits Seasonal
Rank Chocolate, Milk Chocolate, Fruits Chocolate, Juices
1 Baking Ingred. Periodicals Periodicals
2 Bread Bread Cigarettes
3 Yogurt Sweets Bread
4 Fruits Cigarettes Sweets
5 Butter Seasonal Fruits
Rank Chocolate, Baking Ingred. Chocolate, Hair Care Chocolate, Cigarettes
1 Dried Fruits Body Care Periodicals
2 Sugar Fruits Sweets
3 Fat & Oil Sweets Bread
4 Flour Periodicals Fruits
5 Butter Dental Care Seasonal
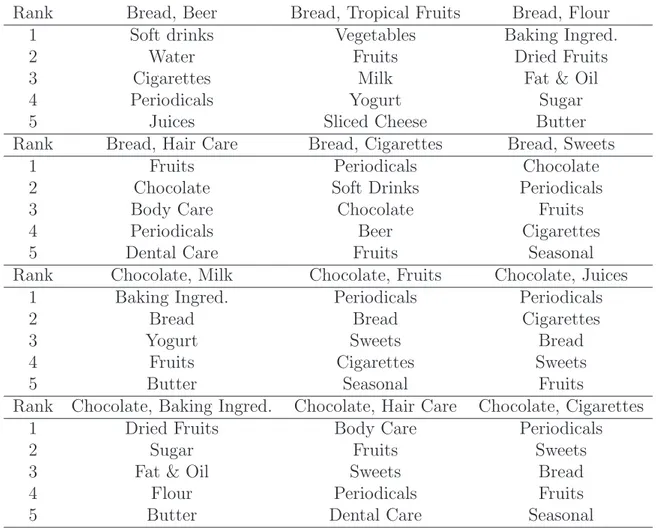
Table 4: Recommendations conditional on selected market baskets
j1 and j2 is defined as:
(8) pr(j3|j1, j2) = pr(j3, j1, j2,) pr(j1, j2)
pr(j3, j1, j2) and pr(j3, j1, j2) symbolize joint probabilities of the given three and two categories, respectively. For the LDA we finally obtain with prk denoting the probability of latent activity k:
(9) pr(j3|j1, j2) = PK
k=1φj3kφj1kφj2kprk PK
k=1φj1kφj2kprk
Expression 9 shows that the conditional purchase probability of category j3 increases if j3, j1, j2 have high(er) importances for the same latent activities. On the other hand, if these categories are related to different activities, a low conditional probability of category j3 results
The fact that after estimation such conditional probabilities can be computed based on K −1 +K ×J parameters constitutes a big advantage of LDA. An alternative direct approach needs J, J2
and J3
univariate, bivariate and trivariate frequencies, respec- tively. For ten latent activities and 60 categories this amounts 609 parameters for LDA versus 36,050 frequencies for the direct approach. In addition the sparseness of higher order frequencies causes the direct approach to provide unstable estimates of conditional probabilities. LDA is free of these problems because it smoothes low frequencies by means of hyperparameters.
Tab. 4lists five recommended other categories for each of twelve selected baskets with two categories each. Six of these baskets contain either bread or chocolate. The recommenda- tions are ranked according to conditional probabilities computed on the basis of the LDA model with ten latent activities (rank 1 gives the category with the highest conditional probability).
4. Conclusions
Our main research goal consists in assessing whether basic topic models are appropriate tools for market basket analysis. A LDA model with ten latent activities performs much better in terms of log likelihood values both for estimation and holdout data than the CTM with a maximum of eleven latent activities. Most of the inferred latent activities by this LDA model are well defined and different from each other. In addition the latent
activities are intuitive and interpretable, e.g., related to shopping of beverages or personal care, to various products appropriate for baking or to a tendency towards luxury food.
To illustrate the managerial relevance of estimated topic models we sketch the core of a recommender system which ranks purchase probabilities of other product categories conditional on the basket of a shopper.
In addition to interpretability we notice two important advantages of topic models com- pared to other models of market basket analysis, namely parsimony and scalability. Topic models are more parsimonious than logit and tobit models with pairwise coefficients and correlations, respectively. For our data constellation of 60 product categories topic models with ten latent activities require about 1,100 parameters less than the multivariate logit and probit models often applied in marketing. Scalability means that topic model are capable to deal with a very large number of product categories. Text mining studies with topic models which process a vocabulary of several thousand words provide clear evidence for this property (e.g., Blei/Laferty2007, pp. 27; Blei/Ng/Jordan2003, pp. 1008).
We see our paper as a first attempt to use topic models in market basket analysis. That is why we note several limitations of this study which on the other hand indicate interesting avenues of future research. The data set investigated refers to individual market baskets, but does identify individual shoppers. Therefore the topic models estimated here take latent heterogeneity across baskets into account, but cannot consider latent heterogeneity across shoppers. The data set also does not contain shoppers’ attributes (e.g., socio- demographics) and marketing variables (e.g., price, sales promotion, etc.). Though such a data constellation can be found frequently in grocery retailing, we think that future research efforts should extend basic topic models by including latent heterogeneity of shoppers and by measuring the effects of predictors on latent activities.
References
Aitchison, J./Shen, S.M. (1980): Logistic-Normal Distributions: Some Properties and Uses, in: Biometrika, Vol. 67, pp. 261-272.
Asuncion, A./Welling, M./Smyth, P./Teh, Y.W. (2009): On Smoothing and Inference for Topic Models, in: Proceedings of the 25th Conference on Uncertainty in Artificial Intelligence, pp. 27-34.
Belch, G.E./Belch, M.A. (2003): Advertising and Promotion, 6th ed., New York.
Blei, D. (2012): Probabilistic Topic Models, in: Communications of the ACM, Vol. 55, pp. 77-84.
Blei, D.M./Lafferty, J.D. (2007): A Correlated Topic Model of Science, in: The Annals of Applied Statistics, Vol. 1, pp. 1735.
Blei, D./Ng, A./Jordan, M. (2003): Latent Dirichlet Allocation, in: The Journal of Machine Learning Research, Vol. 3, pp. 993-1022.
Boztug, Y./Hildebrandt, L.(2008): Modeling Joint Purchases with a Multivariate MNL approach, in: Schmalenbach Business Review, Vol. 60, pp. 400-422.
Boztug, Y./Reutterer, T. (2008): A Combined Approach for Segment-Specific Market Basket Analysis, in: European Journal of Operational Research, Vol. 187, pp. 294- 312.
Chib, S./Seetharaman, P.B./Strijnev, A. (2002): Analysis of Multi-Category Purchase Incidence Decisions Using IRI Market Basket Data, in Franses, P.H/Montgomery, A.L. (Eds.): Econometric Models in Marketing, Amsterdam, pp. 57-92.
Crain, S.P./Zhou, K./Yang, S.-H./Zha, H.(2012): Dimensionality Reduction and Topic Modeling. From Latent Semantic Indexing to Latent Dirichlet Allocation and Be- yond, in: Aggarwal, C./Zhai, C.C. (Eds.): Mining Text Data, New York, pp. 129- 161.
Dippold, K./Hruschka, H. (2013): A Model of Heterogeneous Multicategory Choice for Market Basket Analysis, in: Review of Marketing Science, Vol. 11, pp. 1-31.
Duvvuri, S.D./Ansari, V./Gupta, S. (2007): Consumers Price Sensitivities across Com- plementary Categories, in: Management Science, Vol. 53, pp. 1933-1945.
Griffiths, T.L./Steyvers, M. (2004): Finding Scientific Topics, in: Proceedings of the National Academy of Sciences (Suppl. 1), Vol. 101, pp. 5228-5235.
Manchanda, P./Ansari, A./Gupta, S. (1999): The ”Shopping Basket”: A Model for Multi-Category Purchase Incidence Decisions, in: Marketing Science, Vol. 18, pp.
95-114.
Mild, A./Reutterer, T. (2003): An Improved Collaborative Filtering Approach for Pre- dicting Cross-Category Purchases Based on Binary Market Basket Data, in: Journal of Retailing and Consumer Services, Vol. 10, pp. 123-133.
Newman, D./Asuncion, A./Smyth, P./Welling, M. (2009): Distributed Algorithms for Topic Models, in: Journal of Machine Learning Research, Vol. 10, pp. 1801-1828 Polson, N.G./Scott, J.G./Windle, J. (2013): Bayesian Inference for Logistic Models
Using Polya-Gamma Latent Variables, in: Journal of the American Statistical As- sociation, Vol. 108, pp. 1339-1349.
Russell, G.J./Petersen, A. (2000): Analysis of Cross Category Dependence in Market Basket Selection, in: Journal of Retailing, Vol. 76, pp. 369-392.
Steyvers, M./Griffiths, T.(2007): Probabilistic Topic Models, in: Landauer, T./McNamara, D./Dennis, S./Kintsch, W. (Eds.): Handbook of Latent Semantic Analysis, Hills- dale, NJ, pp. 424-440.
Sun, Y./Deng, H./Han, J. (2012): Probabilistic Models for Text Mining, in: Aggarwal, C.C./Zhai C.X. (Eds.): Mining Text Data, New York, pp. 259-295.
Tirunillai, S./Tellis, G. (2014): Mining Marketing Meaning from Chatter: Strategic Brand Analysis of Big Data Using Latent Dirichlet Allocation, in: Journal of Mar- keting Research, forthcoming.