ATLAS-CONF-2010-096 16October2010
ATLAS NOTE
ATLAS-CONF-2010-096
October 15, 2010
Data-driven background estimation for the H → τ
+τ
−→ `τ
hsearch at
√ s = 7 TeV with the ATLAS detector
The ATLAS Collaboration
Abstract
Events characterised by the presence of an electron or muon, plus a hadronically de- caying tau lepton and large missing transverse momentum are searched for in √s= 7 TeV proton-proton collision data at the LHC. This event topology is of interest to the search for Higgs bosons with H → τ+τ− → `τh (` = e, µand τh= hadronically decaying tau). The total integrated luminosity of the analysed data is 310 nb−1. Candidate events with missing transverse momentum above 20 GeV were found, 12 in the electron and 17 in the muon channels. The sum is consistent with 25±9 expected from a data-driven background estima- tion and the observed visible mass distribution agrees with the shape from the estimation.
This note describes how this estimation is made, using information from data and Monte Carlo simulation.
1 Introduction
Discovering the mechanism responsible for electroweak symmetry-breaking and the origin of mass for elementary particles [1, 2, 3, 4] is one of the major goals of the physics program at the Large Hadron Collider (LHC) [5]. In the Standard Model [6] and most of its extensions this mechanism requires the existence of one or more scalar particles: the Higgs boson(s). The decay of a neutral Higgs particle into a pair of tau leptons is one of the most promising topologies to search for the Higgs boson at the LHC. Within the Standard Model the production through vector boson fusion and subsequent decay into tau leptons is one of the channels with the largest discovery potential for a Higgs boson mass be- low 130 GeV [7]. In extensions of the Standard Model, like the Minimal Supersymmetric Standard Model (MSSM) [8], not only the production in gluon fusion but also the associated production of Higgs bosons withb-flavoured quarks dominate the discovery potential. In particular, the latter gets more im- portant for large values of tanβ, which denotes the ratio of the vacuum expectation values of the two Higgs doublets [9]. The final state arising from the decays of the two tau leptons can be categorised according to whether they decay into another charged lepton (` = eorµ), or to hadrons (τh) as lepton- lepton, lepton-hadron and hadron-hadron. Only the lepton-hadron mode, which contributes 46% of the total branching ratio, is considered in this note. The signal topology is characterised by an electron or a muon, a low track multiplicity jet arising from the hadronically decaying tau lepton and missing trans- verse energy due to the presence of the three neutrinos. The background processes for the Higgs boson search which are considered in this study are production of QCD jets, W and Z bosons in association with jets (W/Z+jets), pairs of top quarks (tt), single top quarks (the so-called single-top) and pairs of¯ electroweak gauge bosons (WW,WZ,ZZ). As the accuracy of the description of the physics processes in MC event generators and of the detector response in the ATLAS detector simulation is limited, it is desirable to estimate the background contributions from control samples in the collision data.
As the integrated luminosity used for this note is 310 nb−1, much less than was assumed in recent sensitivity studies [7, 9], the full selection procedure proposed in those is not applied. Instead the first loose cuts provide the starting point for a Higgs boson search in the di-tau channel. At this level the dominant background sources are QCD jet and W+jets productions. A technique using the yields and kinematics of collision data events where the leptonic and hadronic tau candidates have the same charge
— a region with negligible signal contribution — is used to estimate the contribution of these two dom- inant background processes to the opposite charge signal region. The number of observed events in the signal region is compared with the results from this background estimation and the expectation from MC simulations.
The ATLAS detector is briefly described in Section 2. In Section 3 the collision data sample and the simulated Monte Carlo event samples used in this study are described. The reconstruction of physics objects, the trigger requirements and the offline event selection for the`τh final state are discussed in Section 4. The data-driven method used to estimate the dominant background processes is described in Section 5. Results are discussed in Section 6 and the systematic uncertainties are addressed in Section 7.
Conclusions on the readiness of theH→τ+τ−search are drawn in Section 8.
2 The ATLAS Detector
The ATLAS detector is described in detail elsewhere [10]. The ATLAS inner tracking detector is im- mersed in a 2 Tesla magnetic field provided by a superconducting solenoid. Charged particle position measurements are made by silicon pixel and microstrip detectors in the pseudorapidity range|η|<2.5 and by a straw tube tracker in the range|η|<2.0 which enhances an electron identification by the detection of transition-radiation photons. The calorimeters instrument the range|η|<4.9, using a variety of detector technologies. The lead-liquid argon (LAr) electromagnetic calorimeter is divided into a barrel component
(|η|<1.475) and the two endcap components (1.375<|η|<3.2). The hadronic tile calorimeter is placed directly outside the barrel electromagnetic calorimeter envelope. This steel/scintillating tile detector con- sists of a barrel covering the region|η|<1.0 and two extended barrels in the range 0.8 <|η| <1.7. The copper-LAr hadronic endcap calorimeter consists of two independent wheels per endcap (1.5<|η|<3.2) located directly behind the endcap electromagnetic calorimeter. Larger values of|η|(up to|η| <4.9) are covered by the forward calorimeters which consist of three modules in each endcap: the first made of copper-LAr is optimised for electromagnetic measurements while the other two made of tungsten-LAr measure primarily the energy of hadronic interactions. The muon spectrometer measures the deflection of muon tracks in the field of three large superconducting air-core toroid magnets. It is instrumented with separate trigger and high-precision tracking chambers. The trigger is provided by resistive plate chambers in the barrel (|η| < 1.5) and thin gap chambers in the endcap regions (up to|η| < 2.4). Over most of the pseudorapidity range precision measurements in the principle bending direction are made with monitored drift tubes. The range 2 < |η| < 2.7 of the innermost of the three layers is covered by higher granularity cathode strip chambers.
3 Data and Monte Carlo Simulated Samples
3.1 Data Sample
The results are based on proton-proton collision data collected at the LHC at a centre-of-mass energy of
√s= 7 TeV between March and July 2010. The integrated luminosity of the dataset, where all subsys- tems of the ATLAS detector relevant for this analysis were fully operational, corresponds to 310 nb−1. 3.2 MC Event Samples
The production of W and Z bosons in association with jets via strong interactions was simulated with the ALPGEN [11] generator, which employs the MLM matching scheme [12] between the hard process, calculated with leading-order matrix elements for up to 5 jets, and the parton shower. The tt, single-¯ top (t/s-channels, Wt) and di-boson (WW, WZ, ZZ) processes were generated using MC@NLO [13].
For all the event samples described above the parton shower and hadronisation were simulated with HERWIG [14] and the activity of the underlying event with JIMMY [15]. The loop-inducedgg→WW processes were generated using gg2WW [16]. QCD jet events were generated using PYTHIA [17].
The directgg→A/H/hproduction via gluon fusion was simulated with PYTHIA and the associated bbA¯ /H/hproduction with SHERPA [18] for pseudoscalar A-boson massmA= 120 GeV and tanβ =40 in the mmaxh MSSM benchmark scenario [19]. The production of all three neutral A/H/hHiggs bosons are considered; MC samples with the Higgs mass set to 120 GeV are used for theAandhHiggs bosons and a value of 130 GeV is used forHHiggs boson mass.
The values of the steering parameters in the HERWIG, JIMMY and PYTHIA generators are de- scribed in Ref. [20]. TAUOLA [21] and PHOTOS [22] are used to model the tau lepton decay and additional photon radiation from charged leptons in the leading-log approximation, respectively, except for SHERPA samples. All MC event samples were passed through the full simulation of the ATLAS detector using GEANT4 [23, 24] and are reconstructed with the same software version as used for data.
Cross-sections of the MC event samples used in this note are summarised in Table 1 except for QCD jet events, which are normalized to data as described in Section 4.3.
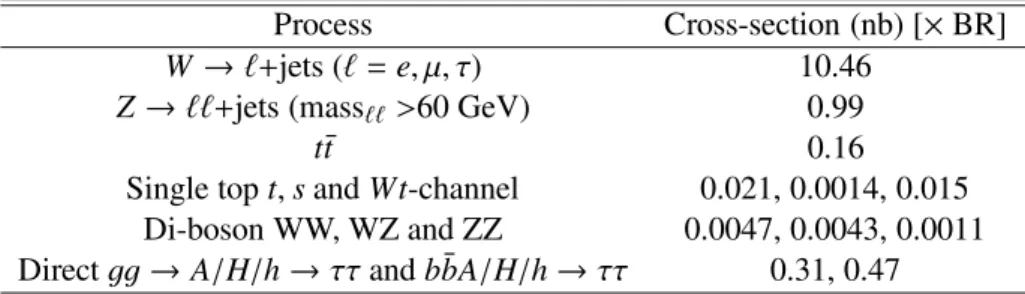
Table 1: Cross-sections (multiplied by the relevant branching ratios (BR)) used in this note; NNLO calculation for W/Z+jets and bbA¯ /H/h → ττ, NLO+NNLL for tt, NLO for single top and di-¯ bosons (MC@NLO samples), LO forgg →WW(gg2WW samples) and NNLO (top loop)+NLO (bot- tom loop and top/bottom loops interference) for direct gg → A/H/h → ττ formA = 120 GeV and tanβ=40.
Process Cross-section (nb) [×BR]
W →`+jets (`=e, µ, τ) 10.46 Z→``+jets (mass`` >60 GeV) 0.99
tt¯ 0.16
Single topt,sandWt-channel 0.021, 0.0014, 0.015 Di-boson WW, WZ and ZZ 0.0047, 0.0043, 0.0011 Directgg→A/H/h→ττandbbA¯ /H/h→ττ 0.31, 0.47
4 Object Reconstruction and Event Selection
4.1 Object Reconstruction
Muon Muon candidates are reconstructed using an algorithm which matches tracks reconstructed in the muon spectrometer to those found in the inner detector [7]. Muons are required to have transverse momenta ofpT >8 GeV and pseudorapidities of|η|<2.5. In addition, isolation requirements are made by requiring that the energy deposited in the electromagnetic and hadronic calorimeters in a cone of radius∆R=0.21around the muon is less than 10% of the muon pT.
Electron Electron candidates are reconstructed from a cluster of cells in the electromagnetic calorime- ter, matched to a track in the inner detector. The shower shape is also used in electron identification [7].
Electrons are required to havepT >10 GeV and to be in the fiducial volume of the barrel or the endcaps (|η| < 1.32 or 1.52 < |η| < 2.47). Isolation requirements are made in the same way as for muon candi- dates, by requiring that the calorimeter energy in a cone of radius ∆R = 0.2 around the electron is less than 10% of the electron pT.
Hadronic-tau Tau candidates are reconstructed using two algorithms: one is seeded by clusters in the electromagnetic and hadronic calorimeters, and the other by the presence of charged tracks [7]. Tau candidates are required to have pT > 20 GeV and|η| < 2.5. The number of charged tracks associated to the tau candidates is required to be 1 or 3 and the charge of the tau candidates, determined from the associated track(s), to be±1. The tau identification, including electron and muon vetoes, uses the cluster shapes and tracking information [25]. It was optimized using MC samples and will be replaced in future studies by a new identification algorithm optimised on data [26].
Jet Jets are reconstructed using the anti-kT algorithm [27], which is an infrared and collinear safe jet clustering algorithm, with distance parameter R = 0.4. The jet algorithm is run on topological clus- ters [28] which reconstruct a three-dimensional shower topology. A simple pT andηdependent calibra- tion scheme based on Monte Carlo simulation is used to convert the electromagnetic calibration of the ATLAS calorimeters to the calibrated hadronic scale [29]. These clusters are also corrected to take into
1The∆Rvariable is defined by∆R= p
(∆η)2+(∆φ)2, where∆ηand∆φcorrespond, respectively, to the difference between the pseudorapidity and azimuthal angles of the objects considered.
account dead material losses and out of cluster energy losses [30]. Jets are required to have pT >20 GeV and|η|<4.4. Jets are not explicitly used in the event selection but are used to categorise events passing each cut according to the jet multiplicity (Section 4.3), (in anticipation of using this in future analysis) and to estimate acceptance uncertainties due to jet energy scale via missing transverse energy (Section 7).
Missing transverse energy The missing transverse energy is based on the energy deposited in calorime- ter cells (|η| < 4.5). This relies on a cell-based algorithm which handles the calorimeter response in the same way as it is done for jets. To this vector is added the pTsum of selected muons [31].
Overlap removal When candidates passing the above selection overlap with each other geometri- cally (∆R < 0.2), one of them is selected. The overlap is resolved by selecting muons, electrons, taus and then jets, in this order of priority.
4.2 Trigger
An electron (muon) is used to trigger on events ofeτh (µτh) final states. Events for the electron channel are selected by triggering on a cluster in the electromagnetic calorimeter withET>10 GeV, while events for the muon channel are triggered by a muon candidate with pT >10 GeV. The trigger efficiency with respect to the event selection (see Section 4.3) is close to 100%.
4.3 Event Selection
Collision events that pass the trigger conditions discussed in Section 4.2 were selected by requiring a vertex with at least three tracks. To reduce fake collision events from cosmic-ray or beam-halo events, it is required that the vertex position along the beam axis be within 15 cm of the nominal position. Quality criteria are applied in order to suppress sources of fake missing transverse energy that does not come from proton-proton collisions [32] and of mis-measurement of energy of electron candidates due to in- efficient regions of the LAr calorimeter (e.g. the electronic front-end boards not providing any output signal) [31]. Since signal events are characterised by a final state topology with one isolated charged lepton (electron or muon), one hadronic-tau jet and missing transverse energy from the undetected neu- trinos, the following requirements using the objects defined in Section 4.1 are imposed;
1. One lepton: Exactly one lepton (electron or muon) with pT > 15 GeV is required. Events with more than one lepton with lower pT threshold described in Section 4.1 are rejected to suppress Z →ee, µµ,tt¯andWt(single top) processes
2. One hadronic-tau: Exactly one identified hadronic-tau with an opposite charge to the lepton is required.
3. MissingET: The missing transverse energy EmissT is required to be larger than 20 GeV to reject QCD jets andZ →ee, µµprocesses.
4. Transverse mass: The transverse mass between the lepton andETmissis calculated via:
mT =
q2plepT EmissT (1−cos∆φ), (1) where plepT denotes the transverse momentum of the lepton and∆φthe angle between the lepton andEmissT in the plane perpendicular to the beam direction.
Events are required to have mT ≤ 30 GeV to reduce contributions from theW+jets andtt¯back- ground processes.
Tables 2 and 3 summarise the number of events passing each cut, categorised according to the jet multiplicity (0, 1, 2 and 3 or more jets). A total number of 12 and 17 candidate events are observed in the electron and muon channels after applying the requirement on the missing transverse energy, respectively.
Table 2: Number of candidate events passing different selections, for the electron channel with 310 nb−1 of data.
Selections applied total 0 jet 1 jet 2 jets 3 jets ≥4 jets Quality, trigger, lepton and tau 107 74 22 6 2 3
alsoEmissT >20 GeV 12 8 2 1 0 1
alsomT≤30 GeV 3 2 1 0 0 0
Table 3: Number of candidate events passing different selections, for the muon channel with 310 nb−1of data.
Selections applied total 0 jet 1 jet 2 jets 3 jets ≥4 jets Quality, trigger, lepton and tau 84 50 18 11 4 1
alsoEmissT >20 GeV 17 6 5 3 3 0
alsomT≤30 GeV 7 2 2 1 2 0
The expected numbers of signal and background events estimated based on MC simulation at the later stages of the event selection are shown in Table 4 together with numbers of observed events in data.
Uncertainties shown in the table are only due to the statistical uncertainties of the MC samples. The theoretical predictions for the cross-section (Table 1) are used except for the QCD jets sample, for which the normalization to data, after the hadronic tau requirement in a region ofETmiss<15 GeV, was applied.
No significant deviations between the observed and expected event yields are observed.
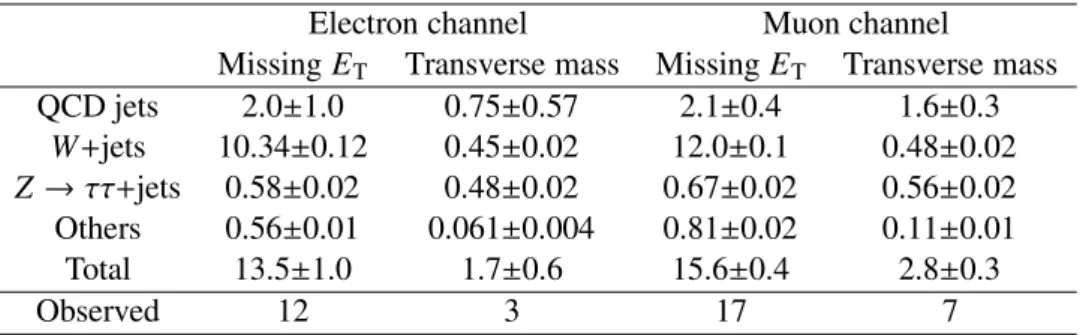
Table 4: Expected number of events after the cut on missing ET and transverse mass as obtained from MC simulation for 310 nb−1. Z → ee/µµ+jets, tt, single-top and di-bosons are included in “Others”.¯ Only QCD jet events are normalized to data as described in the text.
Electron channel Muon channel
MissingET Transverse mass MissingET Transverse mass QCD jets 2.0±1.0 0.75±0.57 2.1±0.4 1.6±0.3
W+jets 10.34±0.12 0.45±0.02 12.0±0.1 0.48±0.02 Z →ττ+jets 0.58±0.02 0.48±0.02 0.67±0.02 0.56±0.02 Others 0.56±0.01 0.061±0.004 0.81±0.02 0.11±0.01 Total 13.5±1.0 1.7±0.6 15.6±0.4 2.8±0.3
Observed 12 3 17 7
5 Background Estimation
As the accuracy of the description of the physics processes in MC event generators and of the detector response in the ATLAS detector simulation is limited, it is desirable to estimate the background contri- butions from control samples in the collision data. The goal is to predict, in the signal region, the rate and distribution in certain observables of the sum of all backgrounds. The method uses a combination of real data together with Monte Carlo simulations. The visible mass, i.e. the mass of the visible tau decays products, is used as the observable in this note, which is one of the discriminating variables used in Higgs boson searches. As the expected number of events is small in this dataset, the signal region in this study does not have the selection on the transverse mass applied, but is defined to be the phase space region after the requirement on the missing transverse energy. At this level the dominant background sources are QCD jet andW+jets productions.
The estimation described below makes use of the following assumptions:
• The shape of the visible mass distribution in the signal region does not depend upon whether the lepton (electron or muon) and hadronic tau candidate have the same charge sign (SS) or opposite charge signs (OS).
• The ratio between OS and SS event yields r = nOS/nSS for each background component is the same in control and signal regions.
Those assumptions have been checked using MC event samples as described later in this note.
The number of events in the signal region with opposite charge of leptonically and hadronically decaying tau leptons, nOS, in each bin of the visible mass distribution can hence be predicted according to: nOS(mvis)=rQCD·nQCDSS (mvis)+rW+jets·nW+jetsSS (mvis)+rother·notherSS (mvis), (2) where therQCD,rW+jets and rother denote the ratio of OS versus SS events for the different background classes, nQCDSS (mvis),nWSS+jets(mvis) andnotherSS (mvis) the number of SS events in the signal region for each background class as a function of the visible mass (mvis). The expression “other” summarises all back- ground classes apart from QCD jet production and W+jet production, i.e. Z+jet production, top quark pair production, single top quark production and pair production of electroweak gauge bosons.
As the determination of the individual contributions,i.e. rQCD,rW+jets,rother,nQCDSS (mvis),nW+jetsSS (mvis) and notherSS (mvis) is difficult from data, the method described in this note estimates combinations of the individual terms in the following way.
Defining the relative excess of OS events forW+jets askW+jetsand for others askother, rW+jets = nW+jetsOS
nW+jetsSS =1+kW+jets, (3) rother = notherOS
notherSS =1+kother, (4)
the expected number of OS background events in the signal regionnOS(mvis) can be written as:
nOS(mvis)=rQCD·nQCDSS (mvis)+nWSS+jets(mvis)+notherSS (mvis)+kW+jets·nWSS+jets(mvis)+kother·notherSS (mvis) (5) AssumingrQCD =1, which is discussed in Section 5.1, this equation can be written as:
nOS(mvis)=nallSS(mvis)+kW+jets·nW+jetsSS (mvis)+kother·notherSS (mvis) (6) wherenallSS(mvis) denotes the sum of same sign events for all background processes in the signal region.
The estimation of the background is done separately for each of three terms in the sum of the final equation; not only event yield, but also the shape of each term (its visible mass distribution) is considered.
Missing Transverse Energy [GeV]
0 10 20 30 40 50 60 70 80 90 100
Entries / 5GeV
0 20 40 60 80 100 120
data
=40 β , tan τ τ
→ A(120)/H/h
)+Jets τ τ
→ Z(
Others W+Jets QCD jets MC statistics
+ jets all channels τh
l
Opposite Sign
L=0.31pb-1
∫
=7TeV, s ATLASPreliminary
Missing Transverse Energy [GeV]
0 10 20 30 40 50 60 70 80 90 100
Entries / 5GeV
0 20 40 60 80 100 120
Missing Transverse Energy [GeV]
0 10 20 30 40 50 60 70 80 90 100
Entries / 5GeV
0 20 40 60 80 100 120
Missing Transverse Energy [GeV]
0 10 20 30 40 50 60 70 80 90 100
Entries / 5GeV
0 20 40 60 80 100 120
data
=40 β , tan τ τ
→ A(120)/H/h
)+Jets τ τ
→ Z(
Others W+Jets QCD jets MC statistics
+ jets all channels τh
l
Same Sign
L=0.31pb-1
∫
=7TeV, s ATLASPreliminary
Missing Transverse Energy [GeV]
0 10 20 30 40 50 60 70 80 90 100
Entries / 5GeV
0 20 40 60 80 100 120
Missing Transverse Energy [GeV]
0 10 20 30 40 50 60 70 80 90 100
Entries / 5GeV
0 20 40 60 80 100 120
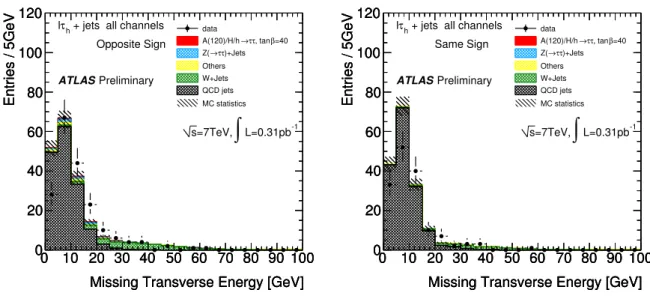
Figure 1: ETmissdistribution after the hadronic tau requirement for (left) opposite sign and (right) same sign events. Electron and muon channels are combined. Z → ee/µµ+jets,tt, single-top and di-bosons¯ are included in “Others”. A region with missing ETabove 20 GeV is defined as the signal region (Sec- tion 4.3), whereas below 15 GeV is the control region to checkrQCD =1.
5.1 Verification ofrQCD = 1
In the derivation of equation 6 the assumption of rQCD = 1 was used which implies that the charge of fake taus (from jets) is uncorrelated with that of the lepton, and therefore the number of OS events is the same as that of SS events. The lack of a correlation is more evident for gluon-initiated jets than quark-initiated jets. Since relatively low-pTQCD jet production, relevant to the backgrounds estimated here, is expected to be dominated by gluon-initiated jets, the parameterrQCDis assumed to be 1.
The validity of this assumption has been confirmed by selecting a control region in the data which is expected to be dominated by relatively low-pT QCD jet production like the signal region. This control region is defined by replacing the requirement ETmiss > 20 GeV by the requirement ETmiss < 15 GeV.
The distributions of the missing energy for OS and SS events for this control region after the hadronic tau requirement are shown in Figure 1. This control region is clearly dominated by QCD jet production with some contribution from other background sources. The number of OS and SS events in the control region (EmissT < 15 GeV) in data is 139 and 125 events, respectively. Neglecting the contributions from other background classes the OS/SS ratio is determined to be 1.11±0.14, which is consistent with the assumption of unity. At this stage of analysis, a value of unity is assumed forrQCD with an error inflated to±0.17. The observed value of 1.11 cannot be used in the final calculation of the expected background since the QCD termrQCD·nQCDSS is a part of the observed SS eventsnallSSin the signal region.
In addition it has been verified using QCD jets MC events that the assumption ofrQCD =1 holds in both the control and the signal regions. This means that the shape of OS events is identical to that of SS events in both the control and the signal regions.
5.2 Determination ofkW+jets andnWSS+jets
A significant deviation ofrW+jets from unity orkW+jetsfrom zero is expected forW+jets since production is dominated by gu/gd-processes often giving rise to a jet originating from a quark correlated with the
[GeV]
lν
MT
0 20 40 60 80 100 120 140
Entries / 10GeV
0 2 4 6 8 10 12 14 16
data
=40 β , tan τ τ
→ A(120)/H/h
)+Jets τ τ
→ Z(
Others W+Jets QCD jets MC statistics
+ jets all channels τh
l
Opposite Sign
L=0.31pb-1
∫
=7TeV, s ATLASPreliminary
[GeV]
lν
MT
0 20 40 60 80 100 120 140
Entries / 10GeV
0 2 4 6 8 10 12 14 16
[GeV]
lν
MT
0 20 40 60 80 100 120 140
Entries / 10GeV
0 2 4 6 8 10 12 14 16
[GeV]
lν
MT
0 20 40 60 80 100 120 140
Entries / 10GeV
0 2 4 6 8 10 12 14 16
data
=40 β , tan τ τ
→ A(120)/H/h
)+Jets τ τ
→ Z(
Others W+Jets QCD jets MC statistics
+ jets all channels τh
l
Same Sign
L=0.31pb-1
∫
=7TeV, s ATLASPreliminary
[GeV]
lν
MT
0 20 40 60 80 100 120 140
Entries / 10GeV
0 2 4 6 8 10 12 14 16
[GeV]
lν
MT
0 20 40 60 80 100 120 140
Entries / 10GeV
0 2 4 6 8 10 12 14 16
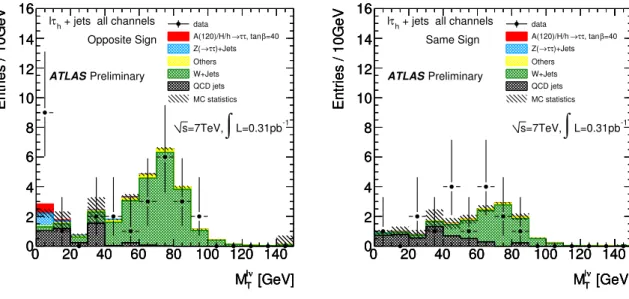
Figure 2: Transverse mass distribution after the ETmiss requirement for (left) opposite sign and (right) same sign events. Electron and muon channels are combined. A region with transverse massmT above 50 GeV is defined as the control region to determinekW+jets.
W. The overall contribution from OS events is greater than that from SS events2. The parameter of kW+jets =rW+jets−1 is determined in a control region which is dominated byW+jets events. This control region is defined by the default cut sequence for the signal region and adding the requirement that the transverse mass should be larger than 50 GeV. The distribution of the transverse mass for SS and OS events after the ETmiss requirement is shown in Figure 2. The OS and SS event yields are 15 and 8 in the control region, respectively. Both samples, OS and SS, are dominated byW+jets events. However a small contribution from the other background processes remains. This contribution, 1.1 for OS and 0.5 for SS events, is estimated from MC samples for the backgrounds other than QCD jets and subtracted from the observed event yields. HencekW+jetsis determined to be:
kW+jets =rW+jets−1= nmOS,dataTreq. −nother,mOS,MCT req.
nmSS,dataT req.−nother,mSS,MCTreq. −1=0.85±0.87 (stat.) (7) The statistical uncertainty is derived from the number of the OS and SS events in the control region. The suffix used,e.g. mT req., means that cuts up to transverse mass requirement described in Section 4.3 is applied.
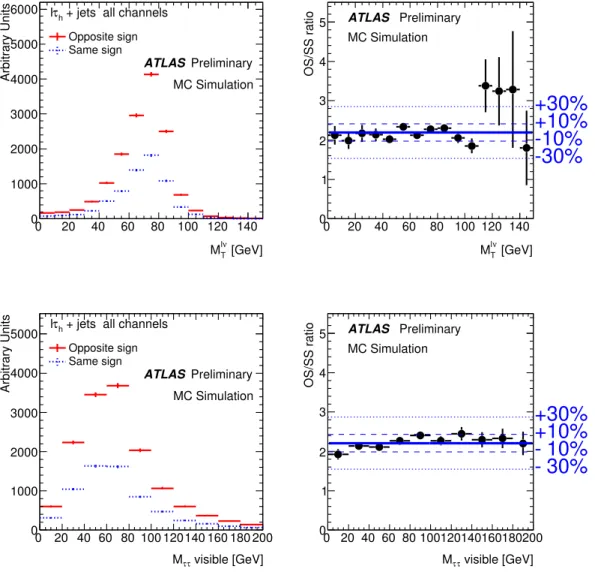
Figures 3 (top) show transverse mass distributions for OS and SS events and their OS/SS ratiorW+jets
as a function of transverse mass for W+jets events. This ratio is independent of the transverse mass range considered and the measured value ofrW+jets is consistent with MC prediction (∼1.2, see Figure 3 top-right) within uncertainties. The deviation of the OS/SS ratio from unity is assumed to be the same in theW+jets control region and the signal region.
2If a gluon-initiated jet fakes a tau inW+jets, the charge of the fake tau is uncorrelated with that of theWboson. Thus, the OS/SS ratiorW+jetsdepends on the jet multiplicity of the events; as the number of jets in the events increases, gluon-initiated jets dominates and thenrW+jetsapproaches 1. This property has been verified in MC samples while due to a lack of available statistics of data, the parameter ofrW+jets(orkW+jets) is inclusively determined in this note.
The yield ofkW+jets·nW+jetsSS is determined to be:
kW+jets·nWSS+jets =kW+jets×
nmSS,dataTreq.−nother,mSS,MCT req.
× nWSS,MC+jets,EmissT req.
nW+jets,mSS,MC Treq. =7.6±7.8, (8) where the last term is a scale factor, obtained from MC, to consider the yield just after theEmissT require- ment. The quoted error includes all statistical and systematic uncertainties discussed in Section 7.
In the current study, the shape of this contribution (nWSS+jets), which is called the W+jets ‘add-on’
shape, is taken fromW+jets MC events as the visible mass distribution of OS events minus that of SS events. It has been verified that the shape of the visible mass distribution is the same between OS and SS events usingW+jet MC samples as shown in Figure 3 (bottom). For the future it is foreseen to estimate this shape from a control sample in data,e.g.with relaxed requirements for the tau lepton identification.
5.3 Determination ofnallSS
The number of same sign events for all background processes nallSS is determined from SS events in the signal region in data with the same selection criteria used for OS events except for the charge requirement.
The number of observed SS events is 16 and their visible mass distribution is shown in Figure 4 (left) with “Same Sign”.
5.4 Determination ofkother·notherSS
The final remaining background component which needs to be added is the contribution resulting from deviation of the OS/SS ratio from unity for the remaining backgrounds,i.e. Z+jet production, di-boson production, top quark pair production and single top production. For the current study this contribution kotherand its shapenotherSS are completely estimated using MC event samples. The yield ofkother·notherSS is found to be 1.9±0.5 from MC simulation. The error quoted is discussed in Section 7.
6 Results: Visible Mass Distribution and Event Yield
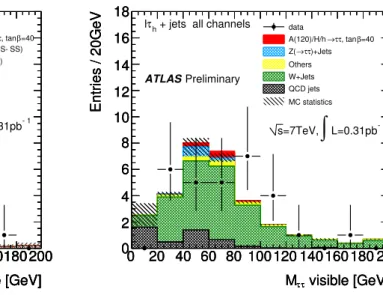
The application of the technique explained in Section 5 to the data gives the estimation of the background shown in Figure 4 (left). The bands showing the systematic uncertainties include the uncertainty of the same-sign component, add-on component and MC statistics as discussed in detail in Section 7. A decent agreement on both the yield and the shape between the derived estimate of the background (histogram) and observed events (points with error bars) is found. Figure 4 (right) shows the comparison of the background estimation based on MC simulation (histogram, only MC statistical error) with the observed events. Recall that the MC QCD component is rescaled to match the data as described in Section 4.3.
Both predictions are consistent within the limited data statistics available.
The overall yield fornallSS, kW+jets ·nWSS+jets and kother ·notherSS is estimated to be 16±5, 7.6±7.8 and 1.9±0.5, respectively. The errors quoted include all statistical and systematic uncertainties discussed in Section 7. Summing these gives a total of 25±9 events, which agrees well with the observation of 29 events in the signal region in data shown in Figure 4 (left) and Tables 2 and 3.
7 Systematic Uncertainties
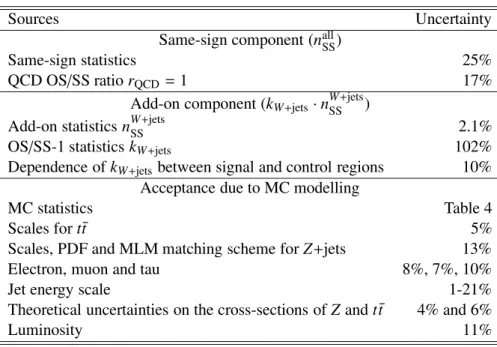
Systematic uncertainties considered for the data-driven background estimation are summarised in Ta- ble 5. The present dominant sources of uncertainties are the statistical uncertainties of SS events (25%) in the signal region and those of OS and SS events used to verify rQCD = 1 (17%) in the region of
[GeV]
ν l
MT
0 20 40 60 80 100 120 140
Arbitrary Units
0 1000 2000 3000 4000 5000 6000
Opposite sign Same sign + jets all channels τh
l
MC Simulation ATLAS Preliminary
[GeV]
ν l
MT
0 20 40 60 80 100 120 140
OS/SS ratio
0 1 2 3 4 5
+30% +10%
-30% -10%
MC Simulation ATLAS Preliminary
visible [GeV]
τ
Mτ
0 20 40 60 80 100 120140 160 180 200
Arbitrary Units
0 1000 2000 3000 4000
5000 Opposite sign Same sign + jets all channels τh
l
MC Simulation ATLAS Preliminary
visible [GeV]
τ
Mτ
0 20 40 60 80 100120140160180200
OS/SS ratio
0 1 2 3 4 5
+30% +10%
-30% -10%
MC Simulation ATLAS Preliminary
Figure 3: Shape comparison of (top) transverse mass and (bottom) visible mass between OS and SS events (left) and OS/SS ratio (right) after theEmissT requirement obtained fromW+jets MC samples. The OS/SS ratio in right plots is obtained from left plots and shows MC prediction ofrW+jets.
visible [GeV]
τ
Mτ
0 20 40 60 80 100120140160180200
Entries / 20GeV
0 2 4 6 8 10 12 14 16 18
data
=40 β , tan τ τ
→ A(120)/H/h
)+Jets(OS-SS) τ
τ
→ Z(
Others(OS-SS) W+jets AddOn Same Sign syst.
visible [GeV]
τ
Mτ
0 20 40 60 80 100120140160180200
Entries / 20GeV
0 2 4 6 8 10 12 14 16
18 lτh + jets all channels
L=0.31pb-1
∫
=7TeV, s ATLASPreliminary
visible [GeV]
τ
Mτ
0 20 40 60 80 100120140160180200
Entries / 20GeV
0 2 4 6 8 10 12 14 16 18
visible [GeV]
τ
Mτ
0 20 40 60 80 100120140160180200
Entries / 20GeV
0 2 4 6 8 10 12 14 16 18
visible [GeV]
τ
Mτ
0 20 40 60 80 100120 140160180 200
Entries / 20GeV
0 2 4 6 8 10 12 14 16 18
data
=40 β , tan τ τ
→ A(120)/H/h
)+Jets τ τ
→ Z(
Others W+Jets QCD jets MC statistics
+ jets all channels τh
l
L=0.31pb-1
∫
=7TeV, s ATLASPreliminary
visible [GeV]
τ
Mτ
0 20 40 60 80 100120 140160180 200
Entries / 20GeV
0 2 4 6 8 10 12 14 16 18
visible [GeV]
τ
Mτ
0 20 40 60 80 100120 140160180 200
Entries / 20GeV
0 2 4 6 8 10 12 14 16 18
Figure 4: Visible mass distribution after the EmissT requirement estimated (left) from the data-driven background estimation (right) from MC simulation. Observed events are shown by points with error bars. Bands shown in them are explained in the text.
ETmiss<15 GeV and to estimatekW+jets (102%). Since the add-on shape weightnWSS+jets is obtained from MC simulation, its statistical uncertainty is assigned as a systematic one (2.1%). An additional contri- bution of 10% is derived from the dependence ofkW+jets between signal and control region as shown in Figure 3 (top).
MC modelling systematic uncertainties are considered: MC statistics forW+jets,Z+jets,tt, single-¯ top and di-boson processes, luminosity for Z+jets, tt, single-top and di-boson processes, acceptance¯ change due to jet energy scale for Z+jets, tt, single-top and di-boson processes, due to factorisation¯ and renormalisation scales for Z+jets andtt¯processes, and due to parton distribution function (PDF) and MLM matching scheme [12] parameters for Z+jets. The largest uncertainty, 21%, comes from Z → ττ+jets and the smallest one fromtt. In the former case, since the tau¯ pT distribution has a peak around 20 GeV, the acceptance change due to jet energy scale contributes significantly. In addition uncertainties of the efficiencies of trigger, reconstruction and identification for electron, muon and tau candidates are assigned to be 8%, 7% and 10%, respectively.
The background estimation in this note uses the data themselves for the calculation. As a result, it naturally accounts for all the data-taking conditions including pileup. The simulations however do not and future updates of this work will need to consider MC samples with pileup.
8 Conclusions
Events characterised by the presence of an electron or muon, plus a hadronically decaying tau lepton and large missing transverse momentum are searched for in √s= 7 TeV proton-proton collision data of 310 nb−1at the LHC. Candidate events with missing transverse momentum above 20 GeV were found in data, 12 in the electron and 17 in the muon channels. The sum is consistent with 25±9 expected from a data-driven background estimation and the observed visible mass distribution agrees with the shape from the estimation. With a further requirement of a large transverse mass, 3 and 7 candidate events are observed in the electron and muon channels, respectively. The events are expected to come mainly from
Table 5: Systematic uncertainties on the background estimation
Sources Uncertainty
Same-sign component (nallSS)
Same-sign statistics 25%
QCD OS/SS ratiorQCD =1 17%
Add-on component (kW+jets·nWSS+jets)
Add-on statisticsnW+jetsSS 2.1%
OS/SS-1 statisticskW+jets 102%
Dependence ofkW+jets between signal and control regions 10%
Acceptance due to MC modelling
MC statistics Table 4
Scales fortt¯ 5%
Scales, PDF and MLM matching scheme forZ+jets 13%
Electron, muon and tau 8%, 7%, 10%
Jet energy scale 1-21%
Theoretical uncertainties on the cross-sections ofZandtt¯ 4% and 6%
Luminosity 11%
theW+jets,Z+jets and QCD jets processes and represent backgrounds for theH→τ+τ−→`τhsearch.
The study presented in this note provides a starting point for upcoming Higgs boson searches in di-tau channels and their data-driven background estimation.
References
[1] F. Englert and R. Brout,Broken Symmetry and the Mass of Gauge Vector Mesons, Phys. Rev. Lett.
13(1964) 321.
[2] P. W. Higgs,Broken symmetries, massless particles and gauge fields, Phys. Lett.12(1964) 132.
[3] P. W. Higgs,Broken Symmetries and the Masses of Gauge Bosons, Phys. Rev. Lett.13(1964) 508.
[4] P. W. Higgs,Spontaneous Symmetry Breakdown without Massless Bosons, Phys. Rev.145(1966) 1156.
[5] L. Evans and P. Bryant,LHC Machine, JINST3(2008) S08001.
[6] A. Djouadi,The anatomy of electroweak symmetry breaking: Tome I: The Higgs boson in the Standard Model, Phys. Rep.457(2008) 1, and references therein.
[7] The ATLAS Collaboration,Expected Performance of the ATLAS Experiment - Detector, Trigger and Physics, CERN-OPEN-2008-020,arXiv:0901.0512.
[8] A. Djouadi,The anatomy of electroweak symmetry breaking Tome II: The Higgs bosons in the Minimal Supersymmetric Model, Phys. Rep.459(2008) 1, and references therein.
[9] The ATLAS Collaboration,Discovery Potential of A/H→τ+τ−→`h in ATLAS, ATL-PHYS-PUB-2010-011.
[10] The ATLAS Collaboration, G. Aad et al.,The ATLAS Experiment at the CERN Large Hadron Collider, JINST3(2008) S08003.
[11] M. L. Mangano et al.,ALPGEN, a generator for hard multiparton processes in hadronic collisions, JHEP07(2003) 001.
[12] J. Alwall et al.,Comparative study of various algorithms for the merging of parton showers and matrix elements in hadronic collisions, Eur. Phys. J.C53(2008) 473,arXiv:0706.2569.
[13] S. Frixione and B. R. Webber,Matching NLO QCD computations and parton shower simulations, JHEP06(2002) 029,hep-ph/0204244.
[14] G. Corcella et al.,HERWIG 6: an event generator for hadron emission reactions with interfering gluons (including supersymmetric processes), JHEP01(2001) 010.
[15] J. M. Butterworth, J. R. Forshaw, and M. H. Seymour,Multiparton Interactions in Photoproduction at HERA, Z. Phys.C72(1996) 637.
[16] T. Binoth, M. Ciccolini, N. Kauer, and M. Kramer,Gluon-induced W-boson pair production at the LHC, JHEP12(2006) 046.
[17] T. Sjostrand, S. Mrenna and P. Skands,PYTHIA 6.4 physics and manual, JHEP05(2006) 026.
[18] T. Gleisberg et al.,Event generation with SHERPA 1.1, JHEP02(2009) 007.
[19] M. Carena, S. Heinemeyer, C. E. M. Wagner, and G. Weiglein,Suggestions for benchmark
scenarios for MSSM Higgs boson searches at hadron colliders, Eur. Phys. J.C26(2003) 601–607, hep-ph/0202167.
[20] The ATLAS Collaboration,ATLAS Monte Carlo Tunes for MC09, ATL-PHYS-PUB-2010-002.
[21] S. Jadach, J. H. Kuhn and Z. Was,TAUOLA - a library of Monte Carlo programs to simulate decays of polarizedτleptons, Comput. Phys. Commun.64(1990) 275.
[22] E. Barberio, B. V. Eijk and Z. Was,Photos - a universal Monte Carlo for QED radiative corrections in decays, Comput. Phys. Commun.66(1991) 115.
[23] The GEANT4 Collaboration, S. Agostinelli et al.,GEANT4 - a simulation toolkit, Nucl. Instrum.
Meth.A506(2003) 250.
[24] The ATLAS Collaboration, G. Aad et al.,The ATLAS Simulation Infrastructure, ATLAS-SOFT-2010-01-004, submitted to Eur. Phys. J. C.,arXiv:1005.4568. [25] The ATLAS Collaboration,Cut based identification of hadronic tau decays,
ATL-PHYS-PUB-2010-001.
[26] The ATLAS Collaboration,Tau Reconstruction and Identification Performance in ATLAS, ATLAS-CONF-2010-086.
[27] M. Cacciari, G. P. Salam, and G. Soyez,The anti-kt jet clustering algorithm, JHEP04(2008) 063.
[28] W. Lampl et al.,Calorimeter Clustering Algorithms : Description and Performance, ATL-LARG-PUB-2008-002.
[29] The ATLAS Collaboration,Jet energy scale and its systematic uncertainty for jets produced in proton-proton collisions at √s=7TeV and measured with the ATLAS detector,
ATLAS-CONF-2010-056.
[30] T. Barillari et al.,Local Hadron Calibration, ATL-LARG-PUB-2009-001.
[31] The ATLAS Collaboration,Measurement of the W→`νproduction cross-section and observation of Z→``production in proton-proton collisions at √s=7TeV with the ATLAS detector,
ATLAS-CONF-2010-051.
[32] The ATLAS Collaboration,Data-Quality Requirements and Event Cleaning for Jets and Missing Transverse Energy Reconstruction with the ATLAS Detector in Proton-Proton Collisions at a Center-of-Mass Energy of √s=7TeV, ATLAS-CONF-2010-038.