Frederike Korth1 , Annette Kock1, Damian L. Arévalo‐Martínez1 , and Hermann W. Bange1
1GEOMAR Helmholtz Centre for Ocean Research Kiel, Kiel, Germany
Abstract
Hydroxylamine (NH2OH), a short‐lived intermediate in the nitrogen cycle, is a potential precursor of nitrous oxide (N2O) in the ocean. However, measurements of NH2OH in the ocean are sparse. Here we present a data set of depth profiles of NH2OH from the equatorial Atlantic Ocean and the eastern tropical South Pacific and compare it to N2O, nitrate, and nitrite profiles under varying oxygen conditions. The presence of NH2OH in surface waters points toward surface nitrification in the upper 100 m.Overall, we found a ratio of 1:3 between NH2OH and N2O in open ocean areas when oxygen concentrations were >50μmol/L. In the equatorial Atlantic Ocean and the open ocean eastern tropical South Pacific, where nitrification is the dominant N2O production pathway, stepwise multiple regressions demonstrated that N2O, NH2OH, and nitrate concentrations were highly correlated, suggesting that NH2OH is a potential indicator for nitrification.
Plain Language Summary
Hydroxylamine (NH2OH) is a short‐lived intermediate in the nitrogen cycle. It could be a precursor of nitrous oxide (N2O) in the ocean. Nitrous oxide (N2O) is an important greenhouse gas and leads to the production of other nitrogen species that can deplete the ozone layer. In the ocean, N2O can be produced by two processes—nitrification and denitrification, while only during nitrification, the oxidation of ammonia to nitrate, is NH2OH involved. The key aim of this study is to decipher the role of NH2OH as a potential indicator for N2O production. We found out that NH2OH is strongly correlated with N2O in open ocean areas, where nitrification is the main N2O pathway and can therefore be used as an indicator for active nitrification and in situ N2O production.1. Introduction
Hydroxylamine (NH2OH) is a short‐lived intermediate in the nitrogen cycle (e.g., Ward, 2008). During nitrification, the oxidation of ammonia (NH3) to nitrate (NO3−) in presence of oxygen (O2), NH2OH can be produced and consumed by ammonia‐oxidizing bacteria (AOB): NH3 → NH2OH → NO → NO2−→NO3−(for review see Kuypers et al., 2018). Additionally, ammonia‐oxidizing archaea (AOA) have been discovered to be widespread in marine environments, often outnumbering their bacterial counterparts by orders of magnitude (Wuchter et al., 2006). Vajrala et al. (2013) could show through combined physiological and stable isotope tracer analyses that NH2OH is both produced and consumed during the oxidation of NH3to nitrite (NO2−) by AOA, indicating that NH2OH may be an intermediate in archaeal nitrification, too. However, the microbial pathway of archaeal nitrification and the role of NH2OH in this process is largely unknown so far. Genes encoding the NH2OH oxidoreductase complex similar to AOB have not been identified in AOA (Kozlowski et al., 2016; Stieglmeier et al., 2014). However, due to the short lifetime of NH2OH of only a few hours in seawater (Butler et al., 1987, 1988), its presence in the water column is strongly indicative of in situ production, and therefore, NH2OH might be interpreted as an indicator for active nitrification.
NH2OH is also a potential precursor for nitrous oxide (N2O), which is a strong greenhouse gas and a major contributor to ozone depletion in the stratosphere (Crutzen, 1970; IPPC WG2, 2013; Ravishankara et al., 2009). In the ocean N2O can be produced by nitrification and denitrification: Under anoxic and suboxic conditions NO3−is stepwise reduced by denitrifying bacteria to molecular nitrogen (N2) via the reaction chain NO3−→NO2−→NO→N2O→N2. Under oxic to suboxic conditions, N2O is produced during bacterial and archaeal oxidation of NH3 to NO2−, the first step of nitrification (Löscher et al., 2012;
Santoro et al., 2011). The prevailing view of bacterial ammonia oxidation is via a two‐step enzymatic
©2019. American Geophysical Union.
All Rights Reserved.
Key Points:
• Hydroxylamine concentrations are significantly correlated with nitrous oxide concentrations in oxygenated waters
• In waters that likely were influenced by denitrification the correlation between hydroxylamine and nitrous oxide breaks down
• Hydroxylamine may be useful as an indicator for active in situ production of nitrous oxide by nitrification in the open ocean
Supporting Information:
•Figure S1
Correspondence to:
F. Korth, fkorth@geomar.de
Citation:
Korth, F., Kock, A., Arévalo‐Martínez, D. L., & Bange, H. W. (2019).
Hydroxylamine as a potential indicator of nitrification in the open ocean.
Geophysical Research Letters,46, 2158–2166. https://doi.org/10.1029/
2018GL080466
Received 13 SEP 2018 Accepted 30 JAN 2019
Accepted article online 5 FEB 2019 Published online 19 FEB 2019
process involving the enzyme ammonia monooxygenase and hydroxylamine oxidoreductase (HAO; Arp &
Stein, 2003). Here nitric oxide (NO) is arising from the incomplete oxidation of NH2OH by HAO, in which NO is a HAO by‐product that is further reduced to N2O by the enzyme NO reductase (Stein, 2011).
Recently, Caranto and Lancaster (2017) suggested that NO is an intermediate of NH3oxidation to NO2− and not a by‐product. Their results showed that under aerobic conditions most of the NH2OH is converted to NO2− via both NO oxidation and the nonenzymatic reaction of NO with O2 by a pure culture of the nitrifierNitrosomonas europaea(Caranto & Lancaster, 2017). Furthermore, Maalcke et al.
(2014) showed that NH2OH is oxidized to NO and not NO2− by an anammox bacterium. In the AOB N. europaeaa direct enzymatic pathway from NH2OH to N2O has been found (Caranto et al., 2016). In contrast, N2O production during archaeal nitrification might result from a nonenzymatic reaction (Kozlowski et al., 2016). Only recently it was shown that N2O can also be produced by abiotic extracelluar reactions from NH2OH, which is released from AOB, AOA, and comammox (bacterial complete ammonium oxidation) cultures (Liu et al., 2017).
So far, NH2OH concentrations have been measured only in a few coastal sites including the Baltic Sea (Gebhardt et al., 2004; Schweiger et al., 2007), the continental shelf of Oregon (Von Breymann et al., 1982), the Yaquina River estuary, Oregon (Butler et al., 1987), and a coastal lagoon in California (Butler et al., 1988). To our knowledge the only other study that reports NH2OH concentration measurements in the open ocean is the recently published study from Ma et al. (2018) showing three profiles from the Southwest Indian Ocean. The main objective of this study was (i) to explore the water column distribution of NH2OH in the open ocean and (ii) to decipher its role as a potential indicator for nitrification. To this end, we present here a set of depth profiles of NH2OH from the equatorial Atlantic Ocean and the eastern tropical South Pacific Ocean (ETSP) and compare it to N2O, NO3−, and NO2−vertical distribution under varying O2conditions.
2. Materials and Methods
2.1. Study Site Description
Samples in the equatorial Atlantic Ocean were taken aboard the R/VMaria S. Meriancruise 18, leg 2 (MSM 18/2; Figure 1). Sampling took place in May 2011. During this period of the year, equatorial winds are Figure 1.Map showing stations sampled (black dots) during the MSM 18/2, M90, and M91 cruises.
usually weak, and vertical transport is reduced (Xie & Carton, 2004). In this region, equatorial upwelling starts in June as a response to enhanced trade winds and increased vertical advection of cold, nutrient‐rich waters to the surface (Philander & Pacanowski, 1986).
Samples in the ETSP off Peru were taken during two research cruises aboard the R/VMeteorin November (M90) and December (M91) 2012 (Figure 1). The Peruvian upwelling belongs to the four major eastern boundary upwelling systems (Chavez & Messié, 2009), and its underlying oxygen minimum zone (OMZ) is one of three major OMZs of the global ocean (Karstensen et al., 2008; Paulmier & Ruiz‐Pino, 2009). The OMZ of the ETSP is a key region for marine nitrogen (N) cycling, with significant loss offixed N by denitri- fication and anammox, as well as other N transformation processes like nitrification (Kalvelage et al., 2013;
Lam et al., 2009).
2.2. Sampling
Water samples were collected with 12 10‐L Niskin bottles on a standard CTD/Rosette. The CTD system was used with double sensors for temperature, conductivity (salinity), and O2. O2and nutrients (NO3−and NO2−) concentrations were measured on board as described in Stramma et al. (2013). The overall uncer- tainty for NO3−and NO2−measurements was ±0.1μmol/L, and the detection limit for O2was 2μmol/L.
2.3. N2O
N2O concentrations were already published by Arévalo‐Martínez et al. (2015, 2017) and Kock et al. (2016), and further descriptions of the N2O sampling and measurements can be found in these publications.
Briefly, bubble‐free samples were collected in triplicate in 20‐ml brown glass vials and sealed with butyl rub- ber stoppers and aluminum caps to avoid any gas exchange. Ten milliliters of the sample was replaced with a synthetic air (MSM18/2) or helium (M90 and M91) headspace for each vial. To prevent microbial activity, 50μl of a saturated aqueous mercuric chloride (HgCl2) solution was added. After an equilibration period of at least 2 hr the samples were analyzed using a gas chromatography/electron capture detector system (Hewlett Packard 5890 Series II). Calculation of the N2O concentrations is described in Walter et al. (2006).
2.4. NH2OH
Dissolved NH2OH was measured as described in Kock and Bange (2013). This improved ammonium iron (III) sulfate (FAS) conversion method is based on the conversion of NH2OH to N2O while NO2−, which results in a significant bias in the NH2OH concentration measurements, is removed by adding sulfanilamide (SA). In detail, triplicate samples were taken from the same Niskin bottle in clear glass vials with a volume of either 56.6 ml (MSM18/2) or 60 ml (M90/91) and stored at 4 °C in the dark. Following the addition of a 10‐ml headspace of synthetic air (MSM18/2) or helium (M90/91) and 400μl of a mixture of acetic acid/SA (172‐mg SA/100‐ml acetic acid [glacial]) and 200‐μL FAS solution (1.206‐g FAS/50‐ml MilliQ). Subsequently, samples were stored at room temperature for at least 24 hr before analysis of N2O with the gas chromatography/electron capture detector system.
The NH2OH concentration in the samples was calculated as follows:
NH2OH
½ ¼ ½N2OFAS−½N2OBG
=RC; (1)
RC¼mstd×2; (2)
where [N2O]FASand [N2O]BGare the N2O concentrations of samples with and without FAS conversion.mstd
is the regression slope of the standard addition. To determine the recovery factor (RC), standard additions of NH2OH were carried out by adding 100μl of four stock solutions with different NH2OH concentrations. The factor of two in the calculation of the RC results from the stoichiometry of the reaction between NH2OH and FAS. The RC varied between 0.46 and 0.84 (M90: 0.46–0.74; M91: 0.56–0.62; MSM18/2: 0.76–0.84), which agrees well with the RC reported by Butler and Gordon (1986), 0.40–0.83; Schweiger et al. (2007), 0.44– 0.64; and Ma et al. (2018), 0.68–0.80.
N2O concentrations of the NH2OH measurements were corrected for the change in the volume of the water phase due to the addition of the reagents, the heating of the samples from 4 °C to room temperature and due to the pressure changes from DIC release upon sample acidification. We calculated the uncertainty of the NH2OH concentration from an error propagation based on the standard deviations of the N2O
concentration measurements of samples with FAS ([N2O]FAS) and without FAS ([N2O]BG) addition and the determination of the RC. The uncertainties of the NH2OH concentrations for each sample are given as error bars in Figure 2. The calculated mean uncertainty for NH2OH was ±2.5 nmol/L based on the error propaga- tion. Stepwise multiple linear regressions were performed using the R statistical software package (version 3.5.0).
3. Results and Discussion
3.1. NH2OH and N2O Distribution
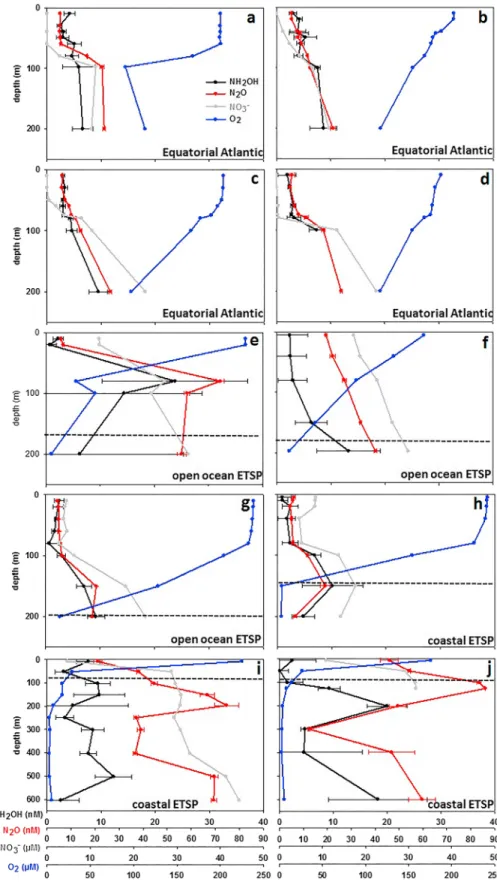
NH2OH concentrations ranged from 2.0 to 9.5 nmol/L (MSM18/2) in the equatorial Atlantic, from 0.6 to 23.8 nmol/L (M90) in the open ocean ETSP, and from 1.5 to 20.0 nmol/L (M91) in the coastal ETSP (Figure 2). Due to the uncertainties of the NH2OH measurements, some of the surface NH2OH concentra- tions might be close to the detection limit. However, in the equatorial Atlantic and in most of the surface waters in the ETSP, NH2OH was indeed present in low concentrations in the surface waters. The presence of NH2OH also in surface waters is strongly indicative for active in situ production of NH2OH. This, in turn, supports the suggestion of nitrification and potentially in situ N2O production taking place in in the upper 100 m of the water column (Dore & Karl, 1996; Zamora & Oschlies, 2014). Maximum NH2OH concentra- tions of up to 23.8 nmol/L were higher compared to the only other open ocean NH2OH study from Ma et al.
(2018) in the Southwest Indian Ocean where highest measured concentrations were 6.8 nmol/L and most concentrations were below 2 nmol/L. In this study, the water column was oxic with O2concentrations
>50μmol/L. However, even if we only consider NH2OH concentrations at stations were O2concentrations were > 50μmol/L, concentrations are still higher with up to 14.3 nmol/L. Butler et al. (1987) reported higher NH2OH concentrations up to 362 nmol/L in the Yaquina River (Oregon, USA). However, in a coastal lagoon in California similar concentrations to our study ranging from 0 to 18 nmol/L NH2OH, except two higher values of up to 175 nmol/L, were measured (Butler et al., 1988). Schweiger et al. (2007) presented measure- ments of NH2OH over a whole seasonal cycle at the time series station Boknis Eck (Baltic Sea). Their NH2OH concentrations were comparable to ours ranging from 0 to 18.5 nmol/L. Contrarily, the measure- ments of Gebhardt et al. (2004) in the central Baltic Sea show much higher concentrations of NH2OH (0 to 179 nmol/L). Except of the study from Ma et al. (2018), previous NH2OH measurements were done with- out the SA solution, which could have led to an overestimation of the concentrations since NO2−can pro- duce significant amounts of N2O through the decomposition of HNO2 as a consequence of the acidification of the samples during FAS conversion (Kock & Bange, 2013). Without the addition of SA, a cor- relation between NO2−and NH2OH could thus be an indication for NH2OH production from the abiotic decomposition of HNO2. In this study, neither in the Atlantic nor the Pacific a correlation was found between NH2OH and NO2−(Table 1).
Overall, NH2OH concentrations were lower than N2O concentrations. In the equatorial Atlantic, N2O con- centrations were comparable to former studies. Maximum N2O values ranged from 22.3 to 24.9 nmol/L in 240 to 280 m at the equatorial stations by Walter et al. (2006), compared to 23.4 to 26.2 nmol/L in 200 m in our study and the study from Arévalo‐Martínez et al. (2017). N2O concentrations in the ETSP were higher with up to 86.1 nmol/L due to enhanced N2O production by nitrification and/or denitrification under tran- sient O2concentrations (Ji et al., 2015; Kock et al., 2016).
3.2. Equatorial Atlantic
Under oxic conditions, which we found in the equatorial Atlantic (O2> 90μmol/L), N2O is produced via two possible pathways, namely, nitrification and nitrifier denitrification, both of which can be carried out by nitrifying organisms (Wrage et al., 2001). Nitrifier denitrification has been suggested to play a crucial role in N2O formation under low O2 (Wrage et al., 2001), also by Frame et al. (2014) in the eastern South Atlantic. In the equatorial Atlantic the sampled water column was oxic and surface O2concentrations decreased from 200μmol/L to a minimum of 90μmol/L in 200‐m depth. Under these O2concentrations, we can infer that nitrification is the main contributor to N2O production. Based on N2O distributions and ΔN2O (N2O anomaly) versus AOU (apparent oxygen utilization) andΔN2O versus NO3− correlations, Arévalo‐Martínez et al. (2017) concluded that N2O is mainly derived from subsurface production through nitrification in the equatorial Atlantic. In our study we used the N2O concentrations from four out of 53
Figure 2.Vertical distribution of NH2OH (nmol/L; black), N2O (nmol/L; red), NO3−(μmol/L; gray), and O2(μmol/L;
blue) at stations MSM18/2_1 (a), MSM18/2_2 (b), MSM18/2_3 (c), MSM18/2_4 (d), M90/4 (e), M90/2 (f), M90/3 (g), M90/1 (h), M91/1 (i), and M91/2 (j). The dashed line indicates the depth level of O2concentrations of 20μmol/L (e.g., Paulmier & Ruiz‐Pino, 2009). The error bars are shown for NH2OH and N2O measurements and are based on three individual sample measurements from the same Niskin bottle.
stations that were already published in Arévalo‐Martínez et al. (2017) and complemented the data set with NH2OH concentrations at those four stations. We found a significant correlation between NH2OH and N2O concentrations (p < 0.05; Table 1), supporting the results from Arévalo‐Martínez et al. (2017) that the main N2O pathway is via nitrifica- tion. Our results furthermore suggest that active nitrification and N2O production takes place over the full water column in the equatorial Atlantic. Additionally, parameters that are assumed to be directly connected to the production pathways of N2O via nitrification are O2, AOU, and NO3−(Yoshida et al., 1989). NH2OH was also correlated with AOU (Figure S1 in the supporting information). In our study N2O was significantly correlated with O2 and NO3− (p < 0.05; Table 1), which would be consistent with nitrification as the source of N2O in the equatorial Atlantic.
3.2.1. NH2OH and N2O Discrepancy
We have to point out that the NH2OH concentrations of 4.3 ± 1.9 nmol/L were lower than N2O concentra- tions of 11.1 ± 6.1 nmol/L. This discrepancy is not necessarily contradictory to a nitrification‐dominated N2O production pathway. Unlike N2O, NH2OH does not accumulate in the water column due to its short half‐life of only a few hours (Butler et al., 1987, 1988). Additionally, Arévalo‐Martínez et al. (2017) showed, based on an inverse relationship between N2O and sea surface temperature, that N2O‐enriched waters are transported to the surface during the upwelling season in the equatorial Atlantic. However, we cannot account how much of the N2O is from the lateral transport of N2O rich water and how much is produced locally. Furthermore, a significant amount of oceanic N2O is thought to originate from archaeal rather than from bacterial nitrification (Löscher et al., 2012; Santoro et al., 2011). Although genes encoding the NH2OH oxidoreductase complex have not been identified in AOA (Walker et al., 2010; Vajrala et al., 2013), NH2OH is likely an intermediate in archaeal nitrification, too (Santoro et al., 2011; Vajrala et al., 2013). Still, the relative contribution of bacterial and archaeal NH3oxidation to nitrification and N2O production is still not well con- strained, and we cannot decipher how much of the NH2OH is converted to N2O during active nitrification.
However, this is thefirst time showing that there is a significant correlation between NH2OH and N2O in the open ocean. In areas like the equatorial Atlantic where nitrification is the major pathway of N2O formation (Arévalo‐Martínez et al., 2017; Walter et al., 2006; Yoshida et al., 1989), NH2OH can be, therefore, inter- preted as an indicator for active nitrification.
3.3. Eastern Tropical South Pacific
The ETSP is one of the most important oceanic regions for N2O emissions to the atmosphere (Arévalo‐ Martínez et al., 2015). Anoxic conditions can be found in large parts of the water column of the ETSP and NH4+, NO2−, and NO3−are present in the steep upper oxycline, supporting both nitrification and denitrifi- cation taking place in close proximity. During M90 and M91, O2 concentrations rapidly decreased to 2.5μmol/L (Figure 2) in the ETSP. N2O profiles typically show a two‐peak structure with pronounced max- ima in the upper and lower oxycline and N2O depletion in the OMZ core. This can be explained by enhanced N2O production by nitrification and denitrification at the boundaries of the OMZ and by N2O consumption through denitrification in the core of the OMZ (Bange et al., 2001; Codispoti & Christensen, 1985). Rates of N2O production in the OMZ of the ETSP close to our study area showed that the highest N2O production rates from both nitrification and denitrification contribute to peak N2O concentrations in the water column with denitrification being the main N2O production pathway (Ji et al., 2015). Especially in the coastal waters off Peru, where active upwelling leads to ventilation of the water column on the one hand and strong remi- neralization leads to rapid O2consumption on the other hand, extreme N2O accumulation, most likely due to extraordinarily high N2O production from denitrification, was observed (Kock et al., 2016). At coastal sta- tions during M91, where besides nitrification, denitrification is a major N2O production pathway (Ji et al., 2015; Kock et al., 2016), the correlation between NH2OH and N2O is not significant. Furthermore, stepwise multiple regressions demonstrated that N2O, O2, and NO3−were not correlated in the coastal waters, which is in line with the results from all coastal stations sampled during this and the following campaigns (M92 and M93) to the ETSP (Arévalo‐Martínez et al., 2015; Kock et al., 2016).
Table 1
Spearman's Rank Correlation Coefficients of NH2OH and N2O Concentration During the MSM18/2 (Equatorial Atlantic), M90 (Open Ocean ETSP) and M91 (Coastal ETSP) Cruises With NH2OH, NO3−, NO2−, O2, and N2O, Respectively
NH2OH N2O
MSM18/2 M90 M91 MSM18/2 M90 M91
NO3− 0.75 0.72 0.31 0.93 0.94 0.52
NO2− 0.01 −0.35 −0.20 0.28 −0.06 −0.02
O2 −0.77 −0.79 −0.20 −0.83 −0.81 0.10
N2O 0.68 0.68 0.08 — — —
Note. Correlation coefficients are reported at a level of confidence of p< 0.05.
At offshore stations linear relationships forΔN2O and AOU have been identified in oxic waters of the ETSP (with O2 concentrations
>50μmol/L; Arévalo‐Martínez et al., 2015; Kock et al., 2016; Ryabenko et al., 2012), which is expected when nitrification is the dominant process for N2O production (Nevison et al., 2003). An increasing slope of the ΔN2O/AOU relationship with increasing AOU could be an indicator for additional N2O production from denitrification or nitrifier denitrification, however. At the stations sampled for NH2OH during M90, we indeed observed a significant correlation between N2O and O2 and N2O and NO3−(p< 0.05; Figure 2 and Table 1) in the upper oxycline. Similar to the equatorial Atlantic, a significant positive correlation was also observed between NH2OH and N2O at the offshore stations pointing toward active nitrification contributing to the N2O accumulation in this area.
3.4. General NH2OH Distribution in the Open Ocean
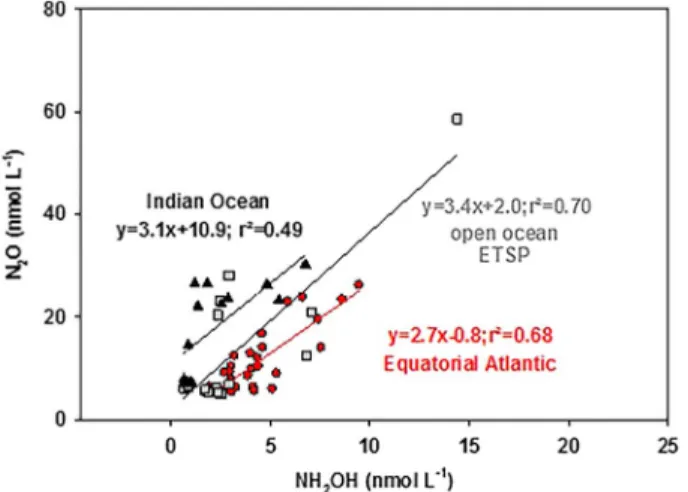
Comparing our results from the Equatorial Atlantic and the open ocean ETSP (M90) with the results from Ma et al. (2018) from the SW Indian Ocean, wefind a similar relationship of 1:3 for NH2OH to N2O in all three areas for samples with O2concentrations >50μmol/L (Figure 3). In gen- eral, NH2OH concentrations were 32 ± 18% of the N2O concentrations. Since we onlyfind a correlation between NH2OH and N2O in areas where nitrification is the main N2O production pathway, we only included samples with O2concentrations >50μmol/L. This O2concertation was chosen, since former stu- dies found a clear positive correlation betweenΔN2O and AOU, which is an indication for nitrification as the main N2O production pathway, at O2concentrations >50μmol/L (e.g., Arévalo‐Martínez et al., 2015;
Kock et al., 2016; Ryabenko et al., 2012; Walter et al., 2006). Due to this, samples from the coastal ETSP are not included in this comparison. Overall, this comparison indicates that there is a relative uniform global relationship between NH2OH to N2O in areas where nitrification is the main N2O production pathway.
4. Conclusions
In this study, NH2OH concentrations showed a significant correlation with N2O concentrations in two dif- ferent open ocean areas, where also positive linearΔN2O/AOU relationships can be found. This is consistent with the assumption that under oxic conditions, nitrification is the main N2O production pathway and that active nitrification contributes to the local N2O inventory. This is further supported by the fact that N2O is positively correlated with NO3−, thefinal product of nitrification in those oxic waters (Walter et al., 2006;
Yoshida et al., 1989). However, when the N2O distribution in the water column is strongly influenced by denitrification as in the oxygen‐deficient waters of the ETSP (Ji et al., 2015), no relationships can be found between NH2OH and N2O. Ourfindings indicate that besides the straightforward interpretation of the linear ΔN2O/AOU relationship as an indicator for N2O formation via nitrification, NH2OH may be useful as an indicator for active nitrification and in situ N2O production. Even though NH2OH concentrations in the upper 100 m of the water column were low, its presence in the surface points toward nitrification in the upper 100 m, where until now no direct evidence of N2O production was found. Overall, our results point toward a ratio of 1:3 between NH2OH and N2O in open ocean areas when O2 concentrations were
>50μmol/L. To further quantify the in situ N2O production from NH2OH, the molecular mechanisms and the stoichiometry of the NH2OH conversion to N2O by archaeal and bacterial nitrifiers need to be inves- tigated in more detail.
References
Arévalo‐Martínez, D. L., Kock, A., Löscher, C. R., Schmitz, R. A., & Bange, H. W. (2015). Massive nitrous oxide emissions from the tropical South Pacific Ocean.Nature Geoscience,8(7), 530–533. https://doi.org/10.1038/ngeo2469
Arévalo‐Martínez, D. L., Kock, A., Steinhoff, T., Brandt, P., Dengler, M., Fischer, T., et al. (2017). Nitrous oxide during the onset of the Atlantic cold tongue.Journal of Geophysical Research: Oceans,122, 171–184. https://doi.org/10.1002/2016JC012238
Arp, D. J., & Stein, L. Y. (2003). Metabolism of inorganic N compounds by ammonia‐oxidizing bacteria.Critical Reviews in Biochemistry and Molecular Biology,38(6), 471–495. https://doi.org/10.1080/10409230390267446
Figure 3.NH2OH (nmol/L) versus N2O (nmol/L) for the equatorial Atlantic (black dots, cruise MSM 18/2), the ETSP (light gray squares, cruise M90), and the Indian Ocean (dark gray triangles) for samples with O2> 50μmol/L and their regression lines. Data from the Indian Ocean are from Ma et al. (2018).
Acknowledgments
We sincerely thank the captains and crews of the R/VMeteor and R/V Maria S. Merianfor their support at sea during the cruises M90, M91, and MSM 18/2.
Likewise, we thank the chief scientists Lothar Stramma (M90) and Peter Brandt (MSM 18/2). We are grateful for the technical and analytical assistance of Natascha Martogli and Joel Craig.
We thank Carolin Löscher and one anonymous reviewer for their helpful comments on the manuscript. This study is a contribution of the Sonderforschungsbereich 754
“Climate‐Biogeochemistry Interactions in the Tropical Ocean,”which is supported by the German Research Foundation. M90 and MSM 18/2 were funded as part of this German DFG collaborative research project. M91 was funded as part of SOPRAN (BMBF FKZ 03F0611 and 03F0662). The N2O data set described here is archived in MEMENTO, the MarinE MethanE and NiTrous Oxide database (https://
memento.geomar.de).
Bange, H. W., Rapsomanikis, S., & Andreae, M. O. (2001). Nitrous oxide cycling in the Arabian Sea.Journal of Geophysical Research, 106(C1), 1053–1065. https://doi.org/10.1029/1999JC000284
Butler, J. H., & Gordon, L. I. (1986). An improved gas chromatographic method for the measurement of hydroxylamine in marine and fresh waters.Marine Chemistry,19(3), 229–243. https://doi.org/10.1016/0304‐4203(86)90025‐3
Butler, J. H., Jones, R. D., Garber, J. H., & Gordon, L. I. (1987). Seasonal distribution and turnover of reduced trace gases and hydroxyla- mine in Yaquina Bay, Oregon.Geochimica et Cosmochimica Acta,51(3), 697–706. https://doi.org/10.1016/0016‐7037(87)90080‐9 Butler, J. H., Pequegnat, J. E., Gordon, L. I., & Jones, R. D. (1988). Cycling of methane, carbon monoxide, nitrous oxide and hydroxylamine
in a meromictic, coastal lagoon.Estuarine Coastal and Shelf Science,27(2), 181–203. https://doi.org/10.1016/0272‐7714(88)90089‐3 Caranto, J. D., & Lancaster, K. M. (2017). Nitric oxide is an obligate bacterial nitrification intermediate produced by hydroxylamine oxi-
doreductase.Proceedings of the National Academy of Science of the United States of America,114(31), 8217–8222. https://doi.org/10.1073/
pnas.1704504114
Caranto, J. D., Vilbert, A. C., & Lancaster, K. M. (2016). Nitrosomonas europaea cytochrome P460 is a direct link between nitrification and nitrous oxide emission.Proceedings of the National Academy of Science of the United States of America,113(51), 14,704–14,709. https://
doi.org/10.1073/pnas.1611051113
Chavez, F. P., & Messié, M. (2009). A comparison of eastern boundary upwelling ecosystems.Progress in Oceanography,83(1‐4), 80–96.
https://doi.org/10.1016/j.pocean.2009.07.032
Codispoti, L. A., & Christensen, J. P. (1985). Nitrification, denitrification and nitrous oxide cycling in the eastern tropical South Pacific Ocean.Marine Chemistry,16(4), 277–300. https://doi.org/10.1016/0304‐4203(85)90051‐9
Crutzen, P. J. (1970). The influence of nitrogen oxides on the atmospheric ozone content.Quarterly Journal of the Royal Meteorological Society,96(408), 320–325. https://doi.org/10.1002/qj.49709640815
Dore, J. E., & Karl, D. M. (1996). Nitrification in the euphotic zone as a source for nitrite, nitrate, and nitrous oxide at station ALOHA.
Limnology and Oceanography,41(8), 1619–1628. https://doi.org/10.4319/lo.1996.41.8.1619
Frame, C. H., Deal, E., Nevison, C. D., & Casciotti, K. L. (2014). N2O production in the eastern South Atlantic: Analysis of N2O stable isotopic and concentration data.Global Biogeochemical Cycles,28, 1262–1278. https://doi.org/10.1002/2013GB004790
Gebhardt, S., Walter, S., Nausch, G., & Bange, H. W. (2004). Hydroxylamine (NH2OH) in the Baltic Sea.Biogeosciences Discussions,1(1), 709–724. https://doi.org/10.5194/bgd‐1‐709‐2004
IPPC WG2 (2013). IPCC Fifth Assessment Report (153 pp.) Retrieved from http://www.ipcc.ch/
Ji, Q., Babbin, A. R., Jayakumar, A., Oleynik, S., & Ward, B. B. (2015). Nitrous oxide production by nitrification and denitrification in the Eastern Tropical South Pacific oxygen minimum zone.Geophysical Research Letters,42, 10,755–10,764. https://doi.org/10.1002/
2015gl066853
Kalvelage, T., Lavik, G., Lam, P., Contreras, S., Arteaga, L., Löscher, C. R., Oschlies, A., et al. (2013). Nitrogen cycling driven by organic matter export in the South Pacific oxygen minimum zone.Nature Geoscience,6(3), 228–234. https://doi.org/10.1038/ngeo1739.
Karstensen, J., Stramma, L., & Visbeck, M. (2008). Oxygen minimum zones in the eastern tropical Atlantic and Pacific oceans.Progress in Oceanography,77(4), 331–350. https://doi.org/10.1016/j.pocean.2007.05.009
Kock, A., Arévalo‐Martínez, D. L., Löscher, C. R., & Bange, H. W. (2016). Extreme N2O accumulation in the coastal oxygen minimum zone off Peru.Biogeosciences,13(3), 827–840. https://doi.org/10.5194/bg‐13‐827‐2016
Kock, A., & Bange, H. W. (2013). Nitrite removal improves hydroxylamine analysis in aqueous solution by conversion with iron (III).
Environmental Chemistry,10(1), 64–71. https://doi.org/10.1071/EN12141
Kozlowski, J. A., Stieglmeier, M., Schleper, C., Klotz, M. G., & Stein, L. Y. (2016). Pathways and key intermediates required for obligate aerobic ammonia‐dependent chemolithotrophy in bacteria and Thaumarchaeota.ISME Journal,10(8), 1836–1845. https://doi.org/
10.1038/ismej.2016.2
Kuypers, M. M. M., Marchant, H. K., & Kartal, B. (2018). The microbial nitrogen‐cycling network.Nature Reviews Microbiology,16(5), 263–276. https://doi.org/10.1038/nrmicro.2018.9
Lam, P., Lavik, G., Jensen, M. M., van de Vossenberg, J., Schmid, M., Woebken, D., Dimitri, G., et al. (2009). Revising the nitrogen cycle in the Peruvian oxygen minimum zone.Proceedings of the National Academy of Sciences of the United States of America,106(12), 4752–4757.
https://doi.org/10.1073/pnas.0812444106
Liu, S. R., Han, P., Hink, L., Prosser, J. I., Wagner, M., & Brüggemann, N. (2017). Abiotic conversion of extracellular NH2OH contributes to N2O emission during ammonia oxidation.Environmental Science & Technology,51(22), 13,122–13,132. https://doi.org/10.1021/acs.
est.7b02360
Löscher, C. R., Kock, A., Könneke, M., LaRoche, J., Bange, H. W., & Schmitz, R. A. (2012). Production of oceanic nitrous oxide by ammonia‐oxidizing archaea.Biogeosciences,9(7), 2419–2429. https://doi.org/10.5194/bg‐9‐2419‐2012
Ma, X., Bange, H. W., Eirund, G. K., & Arévalo‐Martínez, D. L. (2018). Nitrous oxide and hydroxylamine measurements in the Southwest Indian Ocean.Journal of Marine Systems. https://doi.org/10.1016/j.jmarsys.2018.03.003
Maalcke, W. J., Dietl, A., Marritt, S. J., Butt, J. N., Jetten, M. S., Keltjens, J. T., Barends, T. R. M., et al. (2014). Structural basis of biological NO generation by octaheme oxidoreductases.The Journal of Biological Chemistry,289(3), 1228–1242. https://doi.org/10.1074/jbc.
M113.525147
Nevison, C. D., Butler, J. H., & Elkins, J. W. (2003). Global distribution of N2O and the N2O‐AOU yield in the subsurface ocean.Global Biogeochemical Cycles,17(4), 1119. https://doi.org/10.1029/2003GB002068
Paulmier, A., & Ruiz‐Pino, D. (2009). Oxygen minimum zones (OMZs) in the modern ocean.Progress in Oceanography,80(3‐4), 113–128.
https://doi.org/10.1016/j.pocean.2008.08.001
Philander, S. G. H., & Pacanowski, R. C. (1986). A model of the seasonal cycle in the tropical Atlantic Ocean.Journal of Geophysical Research,91(C12), 14,192–14,206. https://doi.org/10.1029/JC091iC12p14192
Ravishankara, A. R., Daniel, J. S., & Portmann, R. W. (2009). Nitrous oxide (N2O): The dominant ozone‐depleting substance emitted in the 21st century.Science,326(5949), 123–125. https://doi.org/10.1126/science.1176985
Ryabenko, E., Kock, A., Bange, H. W., Altabet, M. A., & Wallace, D. W. R. (2012). Contrasting biogeochemistry of nitrogen in the Atlantic and Pacific Oxygen Minimum Zones.Biogeosciences,9(1), 203–215. https://doi.org/10.5194/bg‐9‐203‐2012
Santoro, A. E., Buchwald, C., McIlvin, M. R., & Casciotti, K. L. (2011). Isotopic signature of N2O produced by marine ammonia‐oxidizing archaea.Science,333(6047), 1282–1285. https://doi.org/10.1126/science.1208239
Schweiger, B., Hansen, H. P., & Bange, H. W. (2007). A time series of hydroxylamine (NH2OH) in the southwestern Baltic Sea.Geophysical Research Letters,34, L24608. https://doi.org/10.1029/2007GL031086
Stein, L. Y. (2011). Surveying N2O‐producing pathways in bacteria.Methods in Enzymology,486, 131–152. https://doi.org/10.1016/B978‐0‐ 12‐381294‐0.00006‐7
Stieglmeier, M., Mooshammer, M., Kitzler, B., Wanek, W., Zechmeister‐Boltenstern, S., Richter, A., & Schleper, C. (2014). Aerobic nitrous oxide production through N‐nitrosating hybrid formation in ammonia‐oxidizing archaea.ISME Journal,8(5), 1135–1146. https://doi.
org/10.1038/ismej.2013.220
Stramma, L., Bange, H. W., Czeschel, R., Lorenzo, A., & Frank, M. (2013). On the role of mesoscale eddies for the biological productivity and biogeochemistry in the eastern tropical Pacific Ocean off Peru.Biogeosciences,10(11), 7293–7306. https://doi.org/10.5194/bg‐10‐ 7293‐2013
Vajrala, N., Martens‐Habbena, W., Sayavedra‐Soto, L. A., Schauer, A., Bottomley, P. J., Stahl, D. A., & Arp, D. J. (2013). Hydroxylamine as an intermediate in ammonia oxidation by globally abundant marine archaea.Proceedings of the National Academy of Sciences of the United States of America,110(3), 1006–1011. https://doi.org/10.1073/pnas.1214272110
Von Breymann, M. T., De Angelis, M. A., & Gordon, L. I. (1982). Gas chromatography with electron capture detection for determination of hydroxylamine in seawater.Analytical Chemistry,54(7), 1209–1210. https://doi.org/10.1021/ac00244a048
Walker, C. B., de la Torre, J. R., Klotz, M. G., Urakawa, H., Pinel, N., Arp, D. J., Brochier‐Armanet, C., et al. (2010).Nitrosopumilus mar- itimusgenome reveals unique mechanisms for nitrification and autotrophy in globally distributed marine crenarchaea.Proceedings of the National Academy of Sciences of the United States of America,107(19), 8818–8823. https://doi.org/10.1073/pnas.0913533107 Walter, S., Bange, H. W., Breitenbach, U., & Wallace, D. W. R. (2006). Nitrous oxide in the North Atlantic Ocean.Biogeosciences,3(4),
607–619. https://doi.org/10.5194/bg‐3‐607‐2006
Ward, B. B. (2008). Nitrification in marine systems. In D. G. Capone, D. A. Bronk, M. R. Mulholland, & E. J. Carpenter (Eds.),Nitrogen in the marine environment(pp. 199–262). Academic Press/Elsevier.
Wrage, N., Velthof, G. L., van Beusichem, M. L., & Oenema, O. (2001). Role of nitrifier denitrification in the production of nitrous oxide.
Soil Biology and Biochemistry,33(12‐13), 1723–1732. https://doi.org/10.1016/S0038‐0717(01)00096‐7
Wuchter, C., Abbas, B., Coolen, M. J. L., Herfort, L., van Bleijswijk, J., Timmers, P., Strous, M., et al. (2006). Archaeal nitrification in the ocean.Proceedings of the National Academy of Sciences of the United States of America,103(33), 12,317–12,322. https://doi.org/10.1073/
pnas.0600756103
Xie, S.‐P., & Carton, J. A. (2004). Tropical Atlantic variability: Patterns, mechanisms, and impacts. In C. Wang, S.‐P. Xie, & J. A. Carton (Ed.),Earth climate: The ocean‐atmosphere Interactions(pp. 121–142).
Yoshida, N., Morimoto, H., Hirano, M., Koike, I., Matsuo, S., Wada, E., Saino, T., et al. (1989). Nitrification rates and N‐15 abundances of N2O and NO3−in the western North Pacific.Nature,342(6252), 895–897. https://doi.org/10.1038/342895a0
Zamora, L. M., & Oschlies, A. (2014). Surface nitrification: A major uncertainty in marine N2O emissions.Geophysical Research Letters,41, 4247–4253. https://doi.org/10.1002/2014GL060556