Hydrothermal Fluid Flow Modeling
C. Y. Galerne1 and J. Hasenclever2
1GEOMAR Helmholtz Centre for Ocean Research Kiel, Kiel, Germany,2Institute of Geophysics, Hamburg University, Hamburg, Germany
Abstract
Magma emplacement in organic‐rich sedimentary basins is a main driver of past environmental crises. Using a 2‐D numerical model, we investigate the process of thermal cracking in contact aureoles of cooling sills and subsequent transport and emission of thermogenic methane by hydrothermalfluids. Our model includes a Mohr‐Coulomb failure criterion to initiate hydrofracturing and a dynamic porosity/permeability. We investigate the Karoo Basin, taking into account host‐rock material properties from borehole data, realistic total organic carbon content, and different sill geometries. Consistent with geological observations, wefind that thermal plumes quickly rise at the edges of saucer‐shaped sills, guided along vertically fractured high‐permeability pathways. Contrastingly, less focused and slower plumes rise from the edges and the central part offlat‐lying sills. Using a novel upscaling method based on sill‐to‐sediment ratio, wefind that degassing of the Karoo Basin occurred in two distinct phases during magma invasion. Rapid degassing triggered by sills emplaced within the top 1.5 km emitted ~1.6·103Gt of thermogenic methane, while thermal plumes originating from deeper sills, carrying a 13‐times‐greater mass of methane, may not reach the surface. We suggest that these large quantities of methane could be remobilized by the heat provided by neighboring sills. We conclude that the Karoo large igneous province may have emitted as much as ~22.3·103Gt of thermogenic methane in the half million years of magmatic activity, with emissions up to 3 Gt/year. This quantity of methane and the emission rates can explain the negativeδ13C excursion of the Toarcian environmental crisis.1. Introduction
Degassing of an organic‐rich sedimentary basin intruded by a large igneous province (LIP) plumbing system is a potential source of atmospheric forcing volatiles, which is nearly 10 times greater than any other volcanic related sources. Jones et al. (2016) estimate a release of up to 70 Mt carbon (C) per cubic kilometer of magma emplaced based on various studies of the Karoo LIP (Aarnes et al., 2010, 2011; Svensen et al., 2007). This process is now broadly accepted as one of the main driving mechanisms for rapid climate change and mass extinction (e.g., Aarnes et al., 2010; Ganino & Arndt, 2009) such as the End‐Permian (Siberian Traps, Heydari et al., 2008;
Retallack & Jahren, 2008; Svensen et al., 2009), the End‐Triassic (Central Atlantic Magmatic Province, e.g., Blackburn et al., 2013; Jones et al., 2016), the Toarcian (Karoo‐Ferrar LIP, Svensen et al., 2007, 2012; Burgess et al., 2015), the Palaeocene‐Eocene Thermal Maximum (Northeast Atlantic Igneous Province, e.g., Svensen et al., 2004), and the mid‐Miocene climatic optimum associated with the Columbia River Basalt (McKay et al., 2014). Traces of violent release of thermogenic gases at the basin top are found in the form of pipe‐like structures that root to the contact aureole of the sill intrusions at depth (Figure 1). These sill complexes have been extensively documented through seismic imaging (e.g., Berndt et al., 2016; Cartwright & Hansen, 2006;
Hansen & Cartwright, 2006; Hansen et al., 2004; Planke & Symonds, 2000; Svensen et al., 2004; Thomson, 2005, 2007; Thomson & Hutton, 2004). On land, sill complexes and related hydrothermal vent complexes (HVCs) outcrop in eroded basins such as the Karoo Basin in South Africa (Svensen et al., 2006, 2007) and the Tunguska Basin in Russia (Svensen et al., 2009). However, despite their evident control on the basin degassing rates, HVCs and the processes that lead to the formation of high‐permeability pathways remain unaccounted for in quantitative assessments of thermogenic gas emission to the oceanfloor.
HVCs observed in 2‐D and 3‐D seismic studies can be traced down to the upper rim of saucer‐shaped sills (e.g., Berndt et al., 2016; Planke et al., 2005), and it is commonly accepted that this type of sill geometry acts as a major
©2019. American Geophysical Union.
All Rights Reserved.
Key Points:
• Sill geometry and emplacement depth as well as intruded host‐rock type are the main factors controlling methane mobilization and degassing
• Dehydration‐related porosity increase and pore pressure‐induced hydrofracturing are important mechanisms for a quick transport of methane from sill to the surface
• The Karoo Basin may have degassed
~22.3·103Gt of thermogenic methane in the half million years of magmatic activity
Supporting Information:
•Supporting Information S1
•Table S3
Correspondence to:
C. Y. Galerne, cgalerne@geomar.de
Citation:
Galerne, C. Y., & Hasenclever, J. (2019).
Distinct degassing pulses during magma invasion in the stratified Karoo Basin—New insights from
hydrothermalfluidflow modeling.
Geochemistry, Geophysics, Geosystems, 20, 2955–2984. https://doi.org/10.1029/
2018GC008120
Received 10 DEC 2018 Accepted 10 APR 2019
Accepted article online 3 JUN 2019 Published online 25 JUN 2019
controlling parameter in the formation and distribution of HVCs (Figure 1A). Otherfluid pathways identified as breccia pipes have been mapped in the deep parts of organic‐rich basins like the Karoo in South Africa.
However, their distribution in a map view appears random and thus contrasts with the prominent circular pat- tern formed by HVCs that highlight the contour of saucer‐shaped sills (e.g., Berndt et al., 2016).
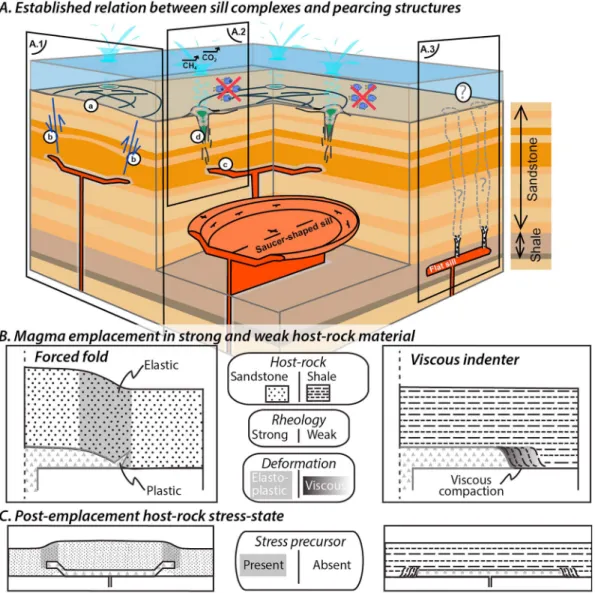
To understand the relation between HVCs and breccia pipes to sill complexes, we rely on the following obser- vations from the Karoo Basin. HVCs are identified near the basin top in sandstone‐dominated formations host- ing saucer‐shaped sills, while breccia pipes are identified in the deep part of the basin in shale dominated formations hostingflat‐lying sills. This relation between sill geometry and host‐rock material can be explained in a simple end‐member rheological model. Saucer‐shaped sill geometries form when an invading magma acts as an inflating viscous phase at the base of a coherently elastic overburden such as a sandstone lithology (Figures 1A and 1B; e.g., Galland & Scheibert, 2013). The uplifted material results in surface doming of the basin—a deformation process known as forced folding (Figures 1A.1; Hansen & Cartwright, 2006, 2007;
Figure 1.(A) Processes associated with sill emplacement in sedimentary basins. (A.1) Sill emplacement in sandstone dominated lithologies and forced fold mechanism: (a) Smooth dome structure related to the deformation by saucer‐shaped sill emplacement at depth (e.g., Galland, 2012). (b) Shear bands develop at the edge of the uplifted overburden. (A.2) Hydrothermal vent complexes: (c) Contact metamorphism develops an aureole around sills and mobilizes large volumes of greenhouse gases (e.g., Svensen et al., 2004). (d) Pipe outlet of hydrothermal vent complexes pierces through the oceanfloor, liberating thermogenic gases into the ocean‐atmosphere system (e.g., Jamtveit et al., 2004). (A.3) Sill emplacement in shale‐dominated lithologies and potentially associated breccia pipes with more random distribution. (B, C) Examination of the impact of the rheological response of different sedimentary host‐rocks during magma emplacement (B) and implications for the overburden post‐emplacement stress state (C). Left column considers a strong sandstone host‐rock material; right column considers a weak shale host‐rock material.
Galland et al., 2009; Schmiedel et al., 2017; Galland et al., 2018). Thefinal saucer‐shape is acquired when the yield strength of the bending plate is overcome at the front of the propagating sill so that inclined magmatic sheets transgress upward and outward through the overburden (Figures 1A.1 and 1B; Pollard & Johnson, 1973; Malthe‐Sørenssen et al., 2004; Galland et al., 2009; Haug et al., 2018).
In contrast, space accommodation for a magma invading into less cohesive shale occurs mostly laterally.
Considering a case where a shale formation is encased above and below by stronger formations, aflat sill will form through lateral compaction of the shale (Figure 1B). This latter accommodation process, called“vis- cous indenter” (Figure 1B; Merle & Donnadieu, 2000; Mathieu et al., 2008; Abdelmalak et al., 2012;
Spacapan et al., 2016), concentrates the deformation locally at the tip of the propagating sill, while in the for- mer saucer‐shaped sill case a larger deformation affects the overburden up to the basin top (Figure 1C).
The current research challenge lies with establishing a causal link between LIP emplacement and degassing of an organic‐rich basin. The goal is to precisely quantify the amount and rates at which thermogenic gases are mobilized and released by venting into the ocean and/or atmosphere. To that end, conductive heatflow models have been developed to simulate the devolatilization process considering the exothermic process of magma crystallization and the endothermic processes of kerogen cracking and dehydration reactions (Aarnes et al., 2010). A calibrated kerogen cracking model considering the breaking of different kerogen bounds (Sweeney & Burnham, 1990) allows to calculate the amount of thermogenic gas that is converted from the total organic carbon (TOC) present in the host‐rock. This kerogen cracking model has been used to estimate the degassing caused by contact metamorphism within the contact aureole around cooling sills (Iyer et al., 2018; Iyer et al., 2017; Iyer et al., 2013; Aarnes et al., 2015; Aarnes et al., 2011; Aarnes et al., 2010;
Kjeldstad et al., 2003). To provide a potential basin‐scale degassing estimate, the surface area of sill intru- sions in the sedimentary basin of interest, for example, ~85,000 km2in the Vøring and Møre Basins (offshore Norway, Svensen et al., 2004) and ~370,000 km2in the Karoo Basin (South Africa, Svensen et al., 2017), is used to upscale the quantitative results obtained from a single cooling sill model (e.g., Aarnes et al., 2010;
Iyer et al., 2013). These types of numerical studies establish that the LIP event that intruded the Karoo Basin potentially mobilized ~2,700–16,200 Gt CH4(Aarnes et al., 2010), while the magmatic event of the North Atlantic Province potentially mobilized ~600–3,500 Gt CH4 from the Vøring and Møre Basins (Aarnes et al., 2010). Subsequent studies that additionally accounted for heat transport by hydrothermal fluidflow (Iyer et al., 2013, 2017) have estimated that the total amount of thermogenic gas mobilized by organic cracking and emitted at the top of these intruded sedimentary basins is sufficient to trigger an environmental crisis.
The goal of our study is to address two important aspects that have been neglected by the above‐ mentioned studies. First, sediment dehydration and hydrothermalfluidflow cause high pore pressures that can locally lead to mechanical failure of the host‐rock, especially if the rock is prestressed by the magma emplacement. This process may be key for the formation of high‐permeability channels that affect basin‐scale degassing rates. Second, thick sedimentary basins are always stratified and often show significant depth variations in rheological, hydraulic, and thermal material properties as well as, most importantly, in TOC content. Such variations cannot be accounted for when upscaling single numerical calculations to basin scale.
In our study, we have introduced a failure criterion using a simple Mohr‐Coulomb rheology that—coupled to pore pressure in the hydrothermal system—promotes hydrofracturing and the formation of high‐ permeability pathways. The pre‐existing host‐rock stress state (Figure 1C), which is directly related to the host‐rock type and the magma emplacement process, plays an important role in this hydrofracturing pro- cess. Furthermore, we explicitly account for the porosity increase associated with host‐rock dehydration, which directly affects the rock permeability and hence thefluidflow patterns. These improvements have been implemented in a state‐of‐the‐art 2‐D numerical model for hydrothermalfluidflow through porous rocks (e.g., Hasenclever et al., 2014). We consider borehole data (Svensen et al., 2018) to constrain the sill proportion with respect to their host sedimentary rock at the basin scale. Important petrophysical host‐rock properties are derived from stratigraphic studies of the Karoo (e.g., Johnson et al., 2006), while hydraulic properties are derived from measured porosity (Baiyegunhi et al., 2014). Finally, we constructed a realistic initial TOC profile based on various sources (EIA, 2015; Branch et al., 2007; Faure & Cole, 1999). Our model is applied to one of the best documented organic‐rich basins intruded by a LIP plumbing system, the Karoo
Basin in South Africa (Figure 2). In a set of model calculations, we investigate sills at various depths within different lithologies. Our new quantitative results of thermogenic degassing are discussed in the perspective of the Toarcian environmental crisis and more globally as a geological forcing mechanism for paleo‐ environmental crises associated with LIP volcanism.
2. A Window Into a LIP Plumbing System: The Karoo Basin, South Africa
The Karoo Basin is part of the Jurassic basin system that developed at the southern margin of Gondwana (e.g., Catuneanu et al., 1998; Johnson et al., 2006). It covers most of present‐day South Africa and is bounded in the South by the Cape Fold Belt (Johnson et al., 2006). The basement is made of the Archean Kaapval craton, shielded in the South by a Proterozoic basement (Tankard et al., 2009). The 5‐to 6‐km clastic sedimentary strata are capped by 1.5 km of basaltic lavas that are the surface expression of the Karoo LIP magmatism (Figure 2A). The Karoo LIP includes a vast plumbing system of magma intrusions emplaced throughout the Karoo Basin stratigraphy (Chevallier & Woodford, 1999; Galerne et al., 2008). The magmatic event of the Karoo has marked the end of the basin subsidence at 183 Ma (Catuneanu et al., 1998). The present‐day exhumed Karoo Basin offers a window on the entire basin stratigraphy and exposes the Karoo LIP plumbing system and associated HVCs (Figures 1A and 2A).
The most organic‐rich formations of the Karoo Basin are located in the Ecca Group (Gp.) and include the black shale formations of the Prince Albert, Whitehill, and Tierberg Formations. These formations are reported to have considerable variations in TOC from 1.10 to 15 wt.%, locally reaching up to 18 wt.% in the Whitehill Formation (Branch et al., 2007; Faure & Cole, 1999). Due to the overall high TOC contents of the Ecca Gp., the lower part of the Karoo stratigraphy has been identified as the most significant source of methane‐richfluids potentially mobilized by contact metamorphism (e.g., Aarnes et al., 2011).
With the exception of the Stormberg Gp., sills and saucer‐shaped sills clearly dominate the overall intrusive system of the Karoo in comparison to the relatively rare dykes (e.g., Chevallier & Woodford, 1999). Sills and saucer‐shaped sills are in general >10 km in diameter in the deepest stratigraphy, while smaller sills of≤10 km in diameter intruded the upper part of the Karoo stratigraphy (Chevallier & Woodford, 1999; Du Toit, 1920). Sill thicknesses vary between 50 and 150 m (Galerne et al., 2008; Chevallier & Woodford, 1999;
Galerne et al., 2010).
Hundreds of cylindrical piercing structures identified as breccia pipes and HVCs have been mapped in the Karoo Basin (e.g., Svensen et al., 2007). The breccia pipes are exclusivelly observed in the lower Ecca Gp.
(Svensen et al., 2007; Woodford et al., 2001) and are commonly up to 50–80 m in diameter (Woodford et al., 2001). In contrast, HVCs are represented only in the upper Beaufort Gp. and Stormberg Gp. They are characterized by structures of up to 300 m in diameter of inward dipping concentric structures (Svensen et al., 2006). HVCs are generally found at the base of the extrusive basalts but rarely cut through, although some phreatomagmatic complexes have been reported to postdate the earliest flood basalts (Stockley, 1947). Consequently, these phreatic types of eruptions are interpreted as dominantly predating theflood basalt eruptions (Svensen et al., 2006) within a significant ambient water column. Similar phrea- tomagmatic eruptions in the twin magmatic province Ferrar in Antarctica consistently predate the main effusive phase suggesting a similar sequence of events in both provinces (Hanson & Elliot, 1996; White &
McClintock, 2001).
3. Model Description
3.1. Hydrothermal Model
We use a 2‐Dfinite element model (Hasenclever et al., 2014) to simulate hydrothermalfluidflow triggered by a magmatic sill intrusion. The model solves for the thermal evolution of the sill and surrounding host‐ rock as well as theflow of water through porous rocks. For this study, we have improved the model by Hasenclever et al. (2014) by considering (1) the conversion of organic matter, (2) the devolatilization of sedi- ments and associated increase in porosity, (3) the transport of methane dissolved in the porefluid, and (4) hydrofracturing. In the following, we will describe the governing equations. Indicesfandrrefer tofluid and rock properties, respectively. Allfluid properties are functions of both pressure and temperature and
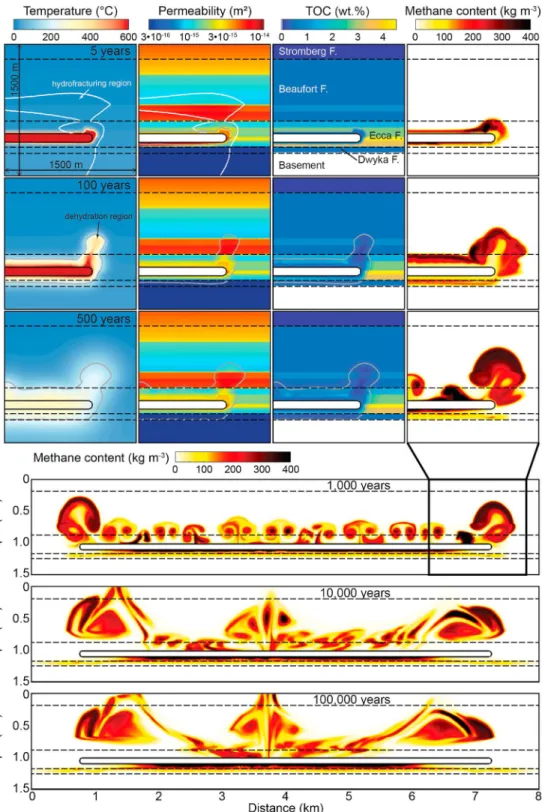
Figure 2.(A) Depth map of the Karoo Basin sediment thickness extracted from the Laske et al., (2013) database. The gray isocontours at 1.2‐and 2.9‐km depths separate three areas: the shallowest sedimentary section of the basin represented by Area S1 (corresponding profile S1 in B), medium depth section represented by Area S2 (corresponding profile S2 in B), and deepest section of the basin represented by Area S3 (corresponding profile S3 in B). (B) Corresponding 2‐D section of the Karoo Basin highlights the three representative stratigraphic sections considered. For simplicity, the main strati- graphic groups are assumed to linearly decrease from the deepest section to the shallowest. The sill emplacement levels considered for each section are sketched, together with the sill geometry controlled by the host‐rock type: Sandstone imposes saucer‐shaped geometry, while shale imposesflat‐lying sill geometry. (C) Reference synthetic stratigraphic log of the Karoo Basin representing a typical Eastern Cape sedimentary section. (C1) The stratigraphic untis used to define the host‐rock material properties in each formation (Catuneanu et al., 1998; Johnson et al., 2006). (C2) Initial porosity cal- culated with equation (10) using measurements by Baiyegunhi et al. (2014). The porosity range from the Ecca formation is indicated in blue (Campbell, Lenhardt, et al., 2016). (C3) Initial permeability calculated using equation (11) with reported corresponding permeability range after Campbell, Lenhardt, et al. (2016). (C4) Initial weight percent total organic carbon profile; see text for details. (C4) Density values from Baiyegunhi et al. (2014); thermal conductivity and heat capacity are taken fromČzermák and Rybach (1982).
are evaluated from precalculated lookup tables based on the IAPWS‐84 formulation. A complete list of sym- bols with corresponding values and units is given in Table 1.
We consider porousflow of pure water through a rigid medium. Throughout the calculations, pore pressures are above the critical point of pure water so that thefluid remains in a single‐phase state. Our single‐phase hydrothermal model requires this assumption, because in the system H2O–NaCl–CO2–CH4phase transi- tions would be possible even at higher pressures. We will discuss potential consequences of this simplifica- tion later. Fluidflow is described by Darcy's law
!v
f ¼−K μf
∇P−ρf!g
(1) where!v
fis the Darcy velocity,Kis the rock's permeability,μfis thefluid's dynamic viscosity,ρfis thefluid's density,Pis pore pressure, and!g is the gravitational acceleration vector. The equation for pore pressure is derived from mass conservation under the assumption that the compressibility of the rock is several orders of magnitude lower than that of thefluid and hence negligible. However, we do consider temporal changes of porosityϕdue to dehydration reactions of the host‐rock. Mass conservation is hence expressed as
∂ðϕρfÞ
∂t ¼ϕ∂ρf
∂t þρf
∂ϕ
∂t ¼−∇·ρf!vf
þRH2OþRCH4 (2) withRH2Obeing a source term from mass offluid released into the pore space by dehydration of the host‐ rock andRCH4being the mass of methane released into pore space during organic cracking (also discussed below).
Substituting equation (1) into equation (2) and rearranging yields ϕ∂ρf
∂t ¼∇· ρf
K
μf∇P−ρf!g
−ρf∂ϕ
∂tþRH2OþRCH4 (3) We use a fully compressible formulation so that thefluid's density is a function of both temperatureTand pressure, that is,∂ρ∂tf¼ρf βf∂P
∂t−αf∂T
∂t
, whereαfandβfare thefluid's thermal expansivity and compressibility, respectively, so that we obtain
ϕρfβf
∂P
∂t ¼∇· ρf
K μf
∇P−ρf!g
þϕρfαf∂T
∂t−ρf
∂ϕ
∂tþRH2OþRCH4: (4) We solve equation (4) with an implicitfinite element method to obtain the pressurefield. With the pressure solution, we obtain the Darcy velocityfield using equation (1).
To obtain the temperature evolution, we solve for energy conservation considering temporal changes in porosity
∂
∂t ϕρfcpfþð1−ϕÞρrcpr
T
¼∇·ðkr∇TÞ−!vf·∇Tþμf
K!v2
f− ∂lnρf
∂lnT
P
DP
Dt þQ (5)
withcpbeing specific heat capacity andkrthermal conductivity of the rock.Qsummarizes all heat sources and sinks (discussed below). Fluid and rock are assumed to be in local thermal equilibrium (that is, T=Tr=Tf) so that the porosity‐weighted mixture appears on the left‐hand side of equation (5). Changes in temperature depend on heat conduction (first term on the right‐hand side), heat advection byfluidflow (second term), heat generation by internalfluid friction (third term), the pressure‐volume work of thefluid (fourth term), and heat sources and sinks (fifth term). Details can be found in Hasenclever et al. (2014) and its supplement. Rearranging the terms in equation (5) yields
ϕρfcpfþð1−ϕÞρrcpr
∂T
∂t ¼∇·ðkr∇TÞ−!vf∇Tþμf
K!v2
f− ∂ lnρf
∂ lnT
P
DP
DtþQ− ρfcpf−ρrcpr
T∂ϕ
∂t (6) which we solve using operator splitting. The advection term is treated with a semi‐Lagrange advection scheme, while all other terms are handled by an implicit finite element method. The term Q in
Table 1
List of Parameters and Variables in the 2‐D Model
Symbol Description Value Unit
Primary variables
x Horizontal coordinate m
z Vertical coordinate m
t Time — s
Δt Time step in numerical calculation — s
!g Gravitational acceleration 9.81 m/s2
P Pore pressure — Pa
T Temperature — °C
!vf Darcy velocity equation (1) m/s
!uf Pore velocity ¼!vf=ϕ m/s
Q Heat sources/sinks in energy equation equation (7) J·m−3·s−1
Temperature‐and pressure‐dependentfluid properties
μf Dynamic viscosity EOS Pa·s
ρf Density EOS kg/m3
cpf Specific heat capacity EOS J·kg−1·K−1
αf Thermal expansion coefficient EOS K−1
βf Compressibility EOS Pa−1
Host‐rock material properties (see stratigraphic log data)
ρr Density Figure 2C Pa s
cpr Specific heat capacity Figure 2C J·kg−1·K−1
kr Thermal conductivity Figure 2C W·m−1·K−1
Ф Porosity Figure 2C 1
Ф0 Porosity at reference depth z = 0 Figure 2C 1
b Exponent in equation (10) 0.45·10−3 m−1
K Permeability equation (11), Figure 2C m2
K0 Reference permeability at depth z = 0 3·10−13 m2
n Exponent in Kozeny‐Carman equation, equation (11) 1.5 1
TOC Initial total organic carbon Figure 2C kg (TOC)/kg
Tbrittle Lower limit of brittle‐ductile‐transition 500 °C
Tductile Upper limit of brittle‐ductile‐transition 750 °C
C Cohesion (sandstone/shale) 27.2/38.4 MPa
θ Angle of internal friction (sandstone/shale) 27.8/14.4 °
σ1,σ3 Largest/smallest principle stress — Pa
σdiff Differential stress =σ1−σ3 Pa
σm Mean stress =(σ1+σ3)/2 Pa
τ Shear strength equation (20) Pa
A Ratio smallest/largest principle stress =σ3/σ1 1
Fshear Pressure required to enable shear failure mode equation (21) Pa
Ftensile Pressure required to enable tensile failure mode equation (22) Pa
Pfail Pore pressure required to initiate hydrofracturing equation (23) Pa
λ Ratio between pore pressure and failure pressure equation (24) 1
a Exponent controlling permeability increase, equation (25) 2 1
LH2O Enthalpy of mineral dehydration 2,800 kJ/kg(H2O)
RH2O Rate offluid mass released into pore space equation (8) kg(H2O)·m−3·s−1
LOM Enthalpy of organic cracking 375 kJ/kg(TOC)
ROM Rate of organic cracking equation (15) kg (TOC)·m−3·s−1
RCH4 Rate of methane release into pore space equation (16) kg (CH4)·m−3·s−1
wH2O Water content of host‐rock — wt.%
FOM Total converted fraction of organic material equation (12) 1
%Ro Vitrinite reflectance equation (13) 1
wOM Remaining convertible organic material equation (14) kg (TOC)/kg
mC/CH4 Conversion factor from carbon to methane 1.34 kg/kg
MCH4 Mass of methane equation (17) kg/m
Magma/sill properties
Tm Initial temperature of sill 1150 °C
TL Liquidus temperature 1150 °C
TS Solidus temperature 950 °C
h Thickness of sill 100 m
ρm Density of magma/sill 2,830 kg/m3
km Thermal conductivity of magma/sill 2.8 W·m−1·K−1
equation (6) includes the energy released by magma crystallization (index C) and the energy consumed during cracking of organic matter (index OM) and dehydration of the host‐rock (index H2O):
Q¼LCRC−LOMROM−LH2ORH2O (7) HereLdenotes the total enthalpy associated with the completion of the process (see Table 1) andRdenotes the rate, in units of kilograms per cubic meter per second, at which each process or reaction takes place. Note that crystallization of magma is exothermic and releases latent heat, while conversion of organic matter and devolatilization are endothermic processes and consume energy.
Equations (6) and (7) pose a nonlinear problem because (7) appears on the right‐hand side of (6), while the rates in (7) depend on the temperature evolution obtained with equation (6). We solve this nonlinearity by iteratively solving equation (6) and recalculating equation (7) until a consistent solution for temperature and the rates of magma crystallization, organic matter conversion, and host‐rock dehydration has been derived.
Convergence of this iterative thermo‐reactive scheme is usually achieved within three tofive iterations.
3.2. Porosity‐Permeability Relation and Host‐Rock Dehydration
The dehydration of the host‐rock is calculated as a temperature‐dependent process. Using the thermody- namic codePerple_X(Connolly, 2009), we calculate the stable mineral assemblage for an average pelite com- position (a composition identical to that used by Aarnes et al., 2010) as a function of temperature (0 to 1200
°C) and pressure (0 to 300 MPa). From this phase diagram (see Figure 4b in Aarnes et al., 2010), we deter- mine the maximum weight fraction of water,wH2O, that can be stored in the mineral assemblage. The pres- sure range in our model calculations is 25 to ~100 MPa, and here the maximum water content is mainly a function of temperature. For simplicity, we neglect the pressure dependence and use a temperature‐ dependent profile at 85 MPa (supporting information S1). We assume that all host‐rock types contain initi- ally 5‐wt.% water and follow the same temperature‐dependent dehydration path. The rate of dehydration, RH2O, is calculated from the change in maximum water content storable in the mineral assemblage of the rock:
RH2O¼−ð1−ϕÞρr∂wH2O
∂t (8)
The temporal change in porosity is directly related to the dehydration rate of the host‐rock:
∂ϕ
∂t¼−ð1−ϕÞ ∂wH2O
∂t (9)
Note that the dehydration rateRH2Ois defined to be positive for dehydration and cannot be negative since we do not consider rehydration of the host‐rock.
To calculate the initial porosity profile as function of depth we use Athy's formulation (Athy, 1930) ϕð Þ ¼z ϕ0·eð−b·zÞ (10) whereϕ0is the porosity of a given host‐rock material at reference depth (z= 0 km),zis the actual depth, and bis a constant characterizing the compressibility of the host‐rock material. The porosity calculated with equation (10) represents the initial state. Dehydration of the sediments leads to an increase in pore space Table 1
(continued)
Symbol Description Value Unit
cpm Specific heat capacity of magma/sill 900 J·kg−1·K−1
ФC Crystal fraction in magma equation (18) 1
LC Enthalpy of fusion (latent heat of crystallization) 320 kJ/kg
RC Rate of crystallization equation (19) kg·m−3·s−1
according to equation (9). This process is assumed to be irreversible, and the host‐rock is not allowed to rehydrate again. Permeability is defined as a function of porosity following the simplified Kozeny‐Carman equation (Costa, 2006),
K zð Þ ¼K0 ϕð Þznþ1 1−ϕð Þz ð Þn
" #
(11) whereK0is the reference permeability at the surface (z= 0 km) andn= 1.5 is a constant. Hence, permeabil- ity also increases irreversibly during dehydration of the host‐rock.
3.3. Conversion of Organic Matter and Methane Generation
The rate of kerogen conversion into hydrocarbons is calculated using the calibrated modelEasy%Roby Sweeney and Burnham (1990). Easy%Ro calculates the total converted fraction as the sum of 20 reactions involved in the breaking down of the different kerogen bonds. See the model description by Sweeney and Burnham (1990) for details. For a given change in temperature fromT(t) at timettoT(t+Δt) over a time intervalΔt, the model calculates the total converted fraction of organic material:
FOM¼f T tð ð Þ;T tð þΔtÞ;ΔtÞ (12) Note that Easy%Ro assumes that only 85 % of the TOC is convertible so that at least 15% of organic material remains. The maturation of vitrinite is a kinetic process that relates to hydrocarbon generation. Although it depends on the chemistry of the kerogen involved, its value generally increases with the organic maturity of the source rock (Dow, 1977), which is mainly a temperature‐controlled process. Hence, vitrinite reflectance (%Ro) is a good proxy to temperature and reflects the maximum temperature experienced by a rock.
Following the parametrization of the Easy%Ro model (Iyer et al., 2013; Beardsmore & Cull, 2001; Aarnes et al., 2010; Sweeney & Burnham, 1990), we define
%Ro¼eð−1:6þ3:7·FOMÞ (13) The rate of thermogenic degassing is calculated by monitoring the evolution of the fraction of convertible organic materialwOMin the host‐rock. Initially,wOM=TOCis a host‐rock‐dependent value derived from the stratigraphic log data (see TOC profile in Figure 2C). Using the total converted fractionFOMcalculated with Easy%Ro, we calculate the remaining fraction of convertible organic material in the host‐rock by
wOM¼ð1−FOMÞ·TOC (14)
The rate of kerogen conversion into hydrocarbons is given by the change in fraction of convertible organic material over time, that is,
ROM¼−ρr
∂wOM
∂t (15)
In analogy to the dehydration rate, we define this rate to be positive for conversion so thatROM≥0. The high temperatures in the contact aureole favor the transformation of organic matter into gaseous products rather than into liquid petroleum (e.g., Aarnes et al., 2010, and references therein). We thus assume that all hydrocarbon is converted into methane (CH4). The rate at which CH4is released by the host‐rock is calcu- lated as
RCH4 ¼mC=CH4ROM (16)
wheremC/CH4= 1.34 is the conversion factor from carbon to CH4. We further assume that all released methane is dissolved in the porefluid without affecting thefluid's physical and thermodynamic properties.
This allows us to use the pressure‐and temperature‐dependent properties of pure water independent of the methane concentration. Iyer et al. (2013) showed that varying the density of methane‐bearingfluids does not significantly affect the methane release rates at the surface, at least in single‐phaseflow models such as ours.
Methane released by the host‐rock is accumulated in and advected with the hydrothermalfluid according to
∂
∂tMCH4¼−∇·MCH4!uf
þRCH4 (17)
whereMCH4is the mass of methane per unit area. Note that the pore velocity!uf¼!vf=ϕrather than the Darcy velocity!vfappears in equation (17). We use thefinite volume method on the unstructured triangular finite element meshes (e.g., Vehling et al., 2018) to accumulate and advect methane until it is possibly released by hydrothermal venting at the top. We have benchmarked our implementation of sill cooling/crystallization, organic cracking, and dehydration against data from contact aureoles around a 10.4‐m‐thick dike (see supporting information S1).
3.4. Magma Crystallization
The crystal fractionϕCin the cooling sill is described as a simple, linear function of temperature between liquidus temperatureTL, and solidus temperatureTS. ForTS≤T≤TL, we define
ϕC¼1− T−TS
TL−TS
(18) The rate of magma crystallization,RC, is given by
RC¼ρr
∂ϕC
∂t (19)
We do not consider physical or thermodynamic changes of the magma during crystallization so that all sill properties remain constant (see Table 1). Furthermore, the magma is assumed to have zero pore space and to be impermeable so that hydrothermal circulation cannot penetrate the sill.
3.5. Mohr‐Coulomb Rheology, Hydrofracturing, and Dynamic Permeability
Saucer‐shaped sills develop in comparatively strong host‐rock environments and cause an uplift of the elas- tically deforming overburden. As a result of this deformation, a stress anomaly exists in the overburden above the edges of the saucer‐shaped sill (cf. section 1 and Figures 1B and 1C). When pore pressure increases, rocks fracture once a critical yield pressure is exceeded; a process called hydrofracturing. The fractured rock will have a higher permeability, which in turn may affect theflow paths and time scales of the hydrothermal system. Already‐stressed rocks require a lower critical pressure to initiate failure, which we take into consid- eration in our models with saucer‐shaped sills. In our model, we formulate a Mohr‐Coulomb failure criterion
τ¼σn· tanð Þ þθ C (20)
whereτis the shear strength,σnis the normal stress,Cis the rock's cohesion, andθis the angle of internal friction. Failure occurs when the Mohr‐Circle touches or exceeds the failure envelope. For any given stress state, the tangential point of the Mohr‐Circle to the failure envelope defines the critical stress required for failure. We consider both shear failure mode derived here to explicitly include the differential stress
Fshear¼σm−σdiff
2 · sinð Þθ (21)
and tensile failure mode
Ftensile¼ σm−σdiff
2 · sinð Þθ h i
· tanð Þ þθ C (22)
whereσm¼ðσ1þσ2 3Þ is the mean stress,σdiff=σ1−σ3is the differential stress, andσ1andσ3are the largest and smallest principle stresses, respectively. We assume that the vertical load is the largest principle stress (i.e.,σ1=σz), while the horizontal stress is the smallest principle stress. The latter is defined to be a fraction Aof the vertical load, that is,σ3=σx=Aσz. Forflat sills emplaced in shale lithologies without uplifting the overburden, we useA= 1, so that the differential stress is 0 everywhere. Saucer‐shaped sills emplaced in sandstone lithologies are assumed to have uplifted the overburden. Here we choose a Gaussian‐shaped tran- sition fromA= 0.7 toA= 1 in a 1.5‐km‐wide vertical column above the sill edges up to the surface andA= 1
everywhere else (see supporting information S1). Failure occurs where the porefluid pressure exceeds the pressure required for failure, that is,
P≥Pfail¼ min½Fshear;Ftensile (23)
The above formulation defines the conditions for hydraulic fracturing of the permeable host‐rock.
Permeability increase accompanies mechanical failure because fractured rock provides more permeable pathway for penetratingfluids. This increase in permeability upon failure, especially the dynamic feedback between pore pressure, mechanical failure, and permeability changes, has been found to affect the tempo‐ spatial evolution of hydrothermal systems (e.g., Weis, 2015). To quantify the local increase of permeability during failure, we follow the formulation given by Weis (2015), which uses the ratioλbetween actual pore pressure and the pressure required for failure
λ¼ P Pfail
(24) In regions, where failure occurs (that is,λ> 1), we increase the porosity‐controlled permeabilityK(ϕ) for the next time step according to
Kðϕ;PÞ ¼Kð Þϕ· min½λa;100 (25) where the exponenta= 2 is used to scale the permeability increase. We limit the maximum permeability increase from hydrofracturing to 2 orders of magnitude above the initial permeability. Note that the failure‐related permeability increase defined by equation (25) is assumed to be reversible so that permeabil- ity returns to its porosity‐controlled valueK(ϕ) once pore pressure drops again below the failure pressure.
3.6. Brittle‐Ductile Transition
The above hydromechanical processes are largely controlled by temperature and also occur in the contact aureole of the sills, where temperatures reach several hundred degrees Celsius after the sill emplacement.
Above a certain temperature, sedimentary rocks change their deformation behavior from brittle to ductile, which affects the Mohr‐Coulomb rheology introduced above. We include the effect of this brittle‐ductile transition by modifying the differential stressσdiffat higher temperatures. We assume the brittle‐ductile transition occurs betweenTbrittle= 500 ° C andTductile= 750 ° C, where the latter is the estimated melting temperature of a sedimentary rock (e.g., Aarnes et al., 2010; Nichols et al., 1994). Within this temperature range, we reduce the differential stress linearly according to
σdiff ¼σdiff· 1− T−Tbrittle
Tductile−Tbrittle
(26) Above 750 °C, the rocks are assumed to behave perfectly ductile and to have a zero differential stress.
3.7. Model Initialization and Boundary Conditions
We assume that the Karoo Basin temperature distribution was at steady state at the time of the Karoo LIP emplacement. For our initial temperature, we use the average heatflow of the Namaqua‐Natal basement of 61 ± 11 mW/m2(Jones, 1993) and solve for the steady state geothermal gradient considering the strati- graphic profile used in the calculation. The resulting geothermal gradient of about 25.3 °C/km is consistent with Jones (1993) and Dhansay et al. (2017).
All simulations assume an instantaneous emplacement of the magmatic body with an initial temperature of 1150 °C, which is also the assumed liquidus temperature. The sills are defined to have zero porosity through- out the simulations and are hence impermeable (cf. equation (11)). All sills have a thickness of 100 m and a horizontal extent of 6.4 km. After emplacement, each sill cools dynamically in response to conductive heat loss to the surrounding rock and heat removed by hydrothermalfluidflow.
The boundary conditions of all model calculations are as follows. Side boundaries and bottom are imperme- able and thermally insulating, while the top boundary mimics an oceanfloor wherefluids are allowed to enter and leave the domain. Here we use a mixed boundary condition (e.g., Hasenclever et al., 2014),
wherefluids enter at 2 °C at inflow locations and vent freely with∂T∂z¼0 at outflow locations. Pressure at the top isfixed at 25 MPa. We run all calculations untilfluidflow velocity become very low and only heat con- duction occurs within the domain, which occurred after 100,000–250,000 years depending on the model setup.
4. Application to the Karoo Basin, South Africa
4.1. General Setup
In order to apply our model to the Karoo Basin some simplifications have been made. The Karoo Basin stra- tigraphy can be summarized as a succession of sandstone‐dominated formations (of the Stormberg Gp. and Beaufort Gp.) from the basin top down to almost the deepest formation, which is dominantly made of organic‐rich shale formations (Ecca Gp.). Using this basic stratigraphic sequence, we have dissected the basin in three regions with different basin depths (Figure 2). Each of these regions will be investigated in a specific 2‐D modeling section, which we refer to as setups S1, S2, and S3. In each of these setups, sills and saucer‐shaped sills are placed according to the basic relation identified above, which relates host‐rock accommodation process and sill geometry (i.e., saucer‐shaped sill in sandstone lithology andflat‐lying sill in shale lithology, Figure 2B).
This procedure leads to afirst‐order approximation of the Karoo Basin sediment volume. Using the Karoo Basin sediment thickness estimates from the Laske et al. (2013) database, we have calculated the area of the basin where sediment depth was ranging between the surface down to 1.2 km, that is, 309,928 km2; 1.2 to 2.9 km, that is, 137,752 km2, and 2.9 to 5.7 km, that is, 55,036 km2. These regions are further used to estimate a corresponding volume of sedimentary rock associated with each setup, S1: 371,913 km3, S2:
399,482 km3, and S3: 313,708 km3. These volumes will be used in our quantitative estimate of the thermo- genic degassing associated with the Karoo LIP plumbing system.
The conducted 2‐D simulations have the objectives to (1) determine the amount of degassing at the basin top and (2) establish the time lapse between magma emplacement at depth and degassing at the basin top. The numerical setups considered in this study are summarized in Table 2 and illustrated in Figure 2B. The gen- eral vertical distribution of sill intrusions along our synthetic stratigraphic log is based on a statistical distri- bution of sills found in 27 boreholes across the Karoo Basin (Svensen et al., 2018, supporting information S1.
Details of distribution and thickness of the sills in the Ecca Gp. and Beaufort Gp. is based on previous studies (Aarnes et al., 2011; Galerne et al., 2008) and includefield observations, geological mapping (Johnson et al., 1996), and satellite images. Based on borehole data published by Svensen et al., (2018), we have calculated that 23% of the Beaufort Gp. and Ecca Gp. consist of sill intrusions (supporting information S1). This value is consistent with a previous estimate of sill to sediment proportion in the Karoo Basin (Rowsell & De Swardt, 1976). To reflect this information in our quantitative estimate of thermogenic gas mobilization and degassing at basin scale, the thinnest setup S1 only contains two levels of saucer‐shaped sills in the Beaufort Gp. and one level offlat sills in the Ecca Gp., while setups S2 and S3 each contain three levels of saucer‐shaped sills in the Beaufort Gp. and two levels offlat sills in the Ecca Gp. (Figure 2B).
4.2. One‐Dimensional Reference Profile
Our one‐dimensional reference lithostratigraphic profile (Figure 2C) represents the thickest part of the basin (S3 in Figure 2B) and combines information from boreholes (Svensen et al., 2018) and stratigraphic studies (Catuneanu et al., 1998; Johnson et al., 2006; Campbell et al., 2016,Campbell et al., 2016). It provides basic depth changes in lithology that lead to variations in material properties (Figure 2C). For simplification, we have assumed that the formation thicknesses for the smaller setups S2 and S1 decrease linearly in proportion to each section's depth, using S3 as reference.
To construct the porosity profile (Figure 2C), we use data of a recent study that systematically reports the porosity variation of each successive formation in the Karoo (Baiyegunhi et al., 2014). We consider them as reference surface porosity values (ϕ0) for each formation in our depth‐dependent porosity equation (equa- tion (10)). Although porosity might have changed over time, for example, through processes like cementa- tion, this procedure enables us to respect the relative variations in porosity from one formation to the next. This porosity profile is then used in the simplified Kozeny‐Carman equation (equation (11)) to calcu- late a permeability‐depth profile. For comparison, we show our calculated porosity and permeability profiles
and the porosity/permeability range measured by Campbell, Lenhardt, et al. (2016) for the Ripon Formation (see blue bars, Figures 2C2 and C3).
The initial weight percent TOC profile (Figure 2C) is compiled from various sources (EIA, 2015; Branch et al., 2007; Faure & Cole, 1999). Although the Whitehill Formation has reported values as high as 15‐to 17‐wt.%
TOC (Branch et al., 2007; Faure & Cole, 1999) we chose a mean value of 4.5‐wt.% TOC as representative of the average TOC content of the formation at basin scale. Finally, the thermal conductivity and heat capacity of the reference lithostratigraphic profile (Figure 2C) is constructed from mixed end‐member values (Čzermák & Rybach, 1982) corresponding to the main rock type associated with each sedimentary formation (e.g., Catuneanu et al., 1998; Johnson et al., 2006).
5. Results
5.1. A Dynamic Porosity/Permeability Model
Our model calculations take into account the dynamic changes in porosity and permeability that evolve over time as the result of the thermomechanical processes and reactions described above. To demonstrate the impact of the sill geometry, dehydration, and hydraulic fracturing on the hydrothermalfluidflow, we have performedfive reference simulations in simplified setups (named S0 in Table 3; see supporting information S1 for the specificity of each setup). These simulations assume homogeneous material properties of the host‐ rock throughout the domain (i.e., constant density, thermal conductivity, heat capacity, thermal conductiv- ity, and TOC) and a gradual depth variation in porosity and permeability (see black curves in Figure 2C). In Figure 3, we compare the model evolution after 30 years forflat‐lying sills and saucer‐shaped sills with and without hydrofracturing. In addition, we show a saucer‐shaped sill with preexisting differential stress in the overburden and hydrofracturing (see Figure 3 and Table S2.1 in supporting information S2).
Two mechanisms induce changes in permeability: Host‐rock dehydration represents a mass transfer from the host‐rock to the fluid that leads to an irreversible increase in porosity and hence permeability.
Regions where this occurs are outlined by gray contours in Figure 3. Not only in the contact aureole but also in the ~400 °C hot hydrothermal plumes temperatures are sufficiently high to trigger the dehydration reac- tion (Figure 3, column 1 and column 2). The resulting pattern shows complete dehydration in the vicinity of the sill and ~50% dehydration along the pathways of rising thermal plumes (Figure 3).
The second mechanism affecting permeability is related to mechanical failure of the host‐rock in regions where the pore pressure exceeds the yield strength of the rock. In contrast to the host‐rock dehydration, this process induces a temporary permeability increase. This simulates the process of fracture opening at high Table 2
Summary of the 13 Setups That Are Relevant for the Karoo Basin
Stratigraphic
Group Host rock
Sill Setup 1 (S1) Setup 2 (S2) Setup 3 (S3)
Geometry Level
Depth (km)
TOC
(wt.%) Name
Depth (km)
TOC
(wt.%) Name
Depth (km)
TOC
(wt.%) Name
Stormberg Sandstone No sillsa — — — — — — — — — —
Beaufort Sandstone Saucer Level 3 (top) — — — 0.6 0.5 S2‐B3 1.2 0.5 S3‐B3
Level 2
(middle)
0.4 0.5 S1‐B2 1.0 0.5 S2‐B2 2.0 0.5 S3‐B2
Lever 1
(lower)
0.8 1.0 S1‐B1 1.7 1.0 S2‐B1 3.4 1.0 S3‐B1
Ecca Shale Flat sill Level 2 (top) — ‐ 2.4 2.8 S2‐E2 4.7 2.8 S3‐E2
Level 1
(lower)
1.0 4.5 S1‐E1 2.6 4.5 S2‐E1 5.1 4.5 S3‐E1
Dwyka Diamictite No sillsa — — — — — — — — — —
Note. This table supports Figure 2.B starting with the stratigraphy on the left, followed by sill geometry and depth levels. The depth of the sill levels is specific to each setup. Note that consistent withfield observations, the Stormberg Group do not host any major sills (e.g., Chevallier & Woodford, 1999). Each sill in our simulations are considered to have a thickness of 100 m, the most common thickness considered for the Karoo sills (e.g., Aarnes et al., 2010; Iyer et al., 2013).
TOC = total organic carbon.
aFew sills may be found across the Karoo Basin in the Stormberg Group and Dwyka Group; however, they are scarce and not taken into consideration in our quantitative estimates (e.g., Chevallier & Woodford, 1999).
porefluid pressures and closing again after pore pressure has dropped. Regions where hydrofracturing occurs are outlined by white contours in Figure 3. As discussed above, saucer‐shaped sills emplaced in sandstone lithology cause a deformation of the overburden. The reference simulation S0‐3 (Figure 3E) assumes an associated preexisting differential stress above the edges of the saucer (Figure 3E4). The prestressed rock facilitates hydrofracturing because the pore pressure required for failure is lower. A vertically elongated hydrofractured region extends above the rising thermal plume toward the surface (Figure 3E). As a result, the thermal plume propagates faster toward the surface and forms a narrower upflow zone (see Figure 3E1 and supporting information Figure B3).
Table 3
Report of Maximum Venting Temperature and Surface Degassing as well as Integrated Thermogenic Methane Gas Mobilization, Surface Flux Emissions, and Stalled on the Way to the Surface (for Methane Only) at the End of the Hydrothermal Fluid Flow
Setup
Depth (km)
TOC (wt.%)
Maximum surface temperature
(°C) At year
Maximum methane degassing
flux (kg/year) At year
End of the hydrothermalfluid
flow (kyr)
S0‐1a 1.0 5.0 244 209 202,156 190 100
S0‐1b 1.0 5.0 136 606 85,730 427 100
S0‐2a 1.0 5.0 388 88 530,429 101 100
S0‐2b 1.0 5.0 302 145 455,463 85 100
S0‐3 1.0 5.0 309 303 414,961 69 100
S1‐B2 0.4 0.5 400 76 51,956 82 60
S1‐B1 0.8 1.0 173 506 23,561 325 80
S1‐E1 1.1 4.5 48 4,567 290 9,467 100
S2‐B3 0.6 0.5 388 106 40,243 39 160
S2‐B2 1.0 0.5 92 1,341 3,065 911 180
S2‐B1 1.7 1.0 31 10,025 0 33,875 200
S2‐E2 2.4 2.8 35 21,116 16 98,216 250
S2‐E1 2.6 4.5 29 56,636 12 101,344 250
S3‐B3 1.2 0.5 54 3,057 866 2,627 190
S3‐B2 2.0 0.5 36 17,509 0 100,064 220
S3‐B1 3.4 1.0 46 56,251 1 55,351 250
S3‐E2 4.7 2.8 15 18,146 0 14,246 250
S3‐E1 5.1 4.5 11 8,394 0 3,151 250
Percentages Are Normalized to Mobilized Values Obtained in Each Setup
Setup
Depth (km)
TOC (wt.%)
Mass (ton) Percentage (%)
Mobilized Emitted Stalled Emitted
Stalled Total
H2O CH4 H2O CH4 CH4 H2O CH4 CH4 CH4
S0‐1a 1.0 5.0 132,083 369,832 1,637,313 213,447 106,275 8 58 29 86
S0‐1b 1.0 5.0 105,152 319,373 1,414,868 165,467 95,302 7 52 30 82
S0‐2a 1.0 5.0 133,756 359,194 1,690,051 225,887 91,026 8 63 25 88
S0‐2b 1.0 5.0 112,394 315,269 1,422,776 184,304 78,404 8 58 25 83
S0‐3 1.0 5.0 110,031 310,508 1,410,851 188,103 65,292 8 61 21 82
S1‐B2 0.4 0.5 83,239 24,898 446,992 6,505 5,179 19 26 21 47
S1‐B1 0.8 1.0 95,221 58,508 532,658 19,055 17,806 18 33 30 63
S1‐E1 1.0 4.5 98,340 77,169 505,853 5,533 61,818 19 7 80 87
S2‐B3 0.6 0.5 94,377 40,809 659,977 7,513 6,177 14 18 15 34
S2‐B2 1.0 0.5 100,163 59,149 568,207 8,450 14,518 18 14 25 39
S2‐B1 1.7 1.0 96,485 81,612 453,592 7 33,375 21 0 41 41
S2‐E2 2.4 2.8 115,481 162,072 931,329 814 120,871 12 1 75 75
S2‐E1 2.6 4.5 127,439 165,647 1,012,539 792 158,215 13 0 96 96
S3‐B3 1.2 0.5 104,266 43,329 604,562 5,036 16,402 17 12 38 49
S3‐B2 2.0 0.5 108,795 50,313 553,253 13 29,773 20 0 59 59
S3‐B1 3.4 1.0 124,915 85,754 601,591 17 56,327 21 0 66 66
S3‐E2 4.7 2.8 148,258 271,110 542,080 0 205,401 27 0 76 76
S3‐E1 5.1 4.5 141,491 337,789 586,944 0 290,396 24 0 86 86
Note. TOC = total organic carbon.