The fi nancial performance of the most valuable brands: A global empirical investigation
Gregor Dorfleitner∗, Felix R€oßle, Kathrin Lesser
University of Regensburg, Universit€atsstraße 31, 93053 Regensburg, Germany
∗Corresponding author.
E-mail address:gregor.dorfleitner@ur.de(G. Dorfleitner).
Abstract
We investigate thefinancial performance of the most valuable brands as provided by the publicly available Interbrand list on an annual basis. By applying standard multi-factor performance evaluation models, and the new five-factor model of Fama and French (2015), we observe that the most valuable brands outperform the market during the overall period from 2000 to June 2018 as well as during different market conditions. However, the extent of the outperformance is much larger during bear than during normal periods, suggesting that the most valuable brands tend to perform better during weak financial market periods. Moreover, wefind that the outperformance is driven by only a few industries, e.g., business services, technology and retail. Analyzing thefinancial performance of the most valuable brands provided by Forbes and BrandZ reveals similar results to those of Interbrand.
Keyword: Business
1. Introduction
According to Warren Buffett, chairman of Berkshire Hathaway and one of the most prominent investors, a formidable barrier such as a company’s being the low-cost producer or possessing a powerful world-wide brand is essential for sustained suc- cess. This article aims to analyze, whether an investment into stocks with a powerful
18 May 2018 Revised:
8 January 2019 Accepted:
25 March 2019 Cite as: Gregor Dorfleitner, Felix R€oßle, Kathrin Lesser.Thefinancial performance of the most valuable brands: A global empirical investigation.
Heliyon 5 (2019) e01433.
doi: 10.1016/j.heliyon.2019.
e01433
world-wide brand have an enduring“moat”that protects excellent returns on in- vested capital, as WarrenBuffett (2007)writes to his shareholders, and therefore helps to generate an outstanding performance.
Over the past few years, the value of a brand has become an important part offirm valuation. Amazon’s brand value, for instance, increased by 19% p.a. from 4.5 billion USD in 2000 to 100.7 billion USD in 2018 and Apple’s brand value even grew by 21% p.a. from 6.6 billion USD to 214.5 billion USD in the same period (Interbrand, 2000, 2018). Intangible assets, such as the value of the brand, do not have an obvious physical value, such as factories or equipment do, and their integra- tion into the balance sheet is limited. However, they can be very valuable for afirm and critical to its long-term success or failure. A strong brand can serve as a compet- itive advantage which helps to succeed in the marketplace, for example it allows firms to set higher prices for their products and services, it helps to reduce the impact from price competition vs. other companies, it lowers price sensitivity of products and reduces substitutability (see e.g., Blattberg et al., 1995; Kaul and Wittink, 1995; Mela et al., 1997; Srivastava et al., 1998; Murphy, 1990; Ailawadi et al., 2003;Mortanges and van Riel, 2003). Therefore, the brand value of afirm is one of the most valuable intangible assets it can possess. The brand value in this article is thefinancial value of the brand. We are following thefinancial driven definition of Feldwick (1996): the total value of a brand as a separable asset - when it is sold, or included on a balance sheet. In other words e the financial value of consumers buying products and services because of the brand name or are paying a higher price for products of this company.
Firms recognize brand building as important, but the management is often chal- lenged in proving its value for the company (see e.g.Doyle, 2000; Gummesson, 2002;Rust et al., 2004). As decisions are often based onfinancial terms, there has been rising interest among academics in understanding the value of a brand and its effect on shareholder value. Previous literature has often found a positive relation- ship between brand value and shareholder value (e.g.,Kerin and Sethuraman, 1998;
Chu and Keh, 2006;Barth et al., 1998;Stahl et al., 2012). In particular,Barth et al.
(1998)argue that brand value estimates are significantly positively related to prices and returns and only incremental to accounting variables. Theirfindings indicate that brand value estimates capture information that is relevant to investors. Moreover, Conchar et al. (2005)find support for a relationship between advertisement and pro- motional spending and the market value of companies. That means that marketing activities are expected to deliver cashflows and shareholder value. In their event study,Dutordoir et al. (2015) analyze approximately 500 brand value announce- ments based on Interbrand’s publicly available global lists. Their analysis covers the years 2001e2012 and they obverse significant abnormal stock returns regarding brand value announcement dates. The authors suggest that shareholders use the in- vestments to reduce cashflow vulnerability.
Literature on the performance of the most valuable brands is rare. As far as we know, there are only four papers which investigate valuable brands in terms offinancial performance.Madden et al. (2006)is thefirst study to analyze thefinancial perfor- mance of the most valuable U.S. brands based on the lists provided by Interbrand in more details. Theyfind that their U.S.-portfolio significantly outperforms the market during the period from 1993 to 2000. Moreover, they argue that valuable brands comprise large caps and growth stocks. In addition,Fehle et al. (2008)study a sam- ple of U.S.firms with strong brands as defined by Interbrand in a period from 1994 to 2006. With respect to theFama and French (1993)and Carhart (1997)four-factor model, theyfind that valuable companies have significant above-average returns.
Hsu et al. (2013)examine the relationship between brand value and performance of companies from 2001 to 2010 against a market benchmark. Thefinding ofHsu et al. (2013)indicates that the brand portfolio outperforms the S&P index in various periods and generates a significantly positive outperformance. Based on Interbrand, Johansson et al. (2012)analyze the top brands listed on the U.S. stock exchanges.
Theyfind that the most valuable brands did not outperform the market in a four months period during thefinancial crisis of 2008. However, they find lower betas of high brand stocks during this period.
Previous literature predominantly analyzes thefinancial performance of the most valuable U.S. equities (seeMadden et al., 2006;Fehle et al., 2008, or Johansson et al., 2012). However, in this study, we extend the perspective to the global market.
In particular, we analyze an internationally diversified sample, including all of the most valuable brands on the Interbrand lists. To investigate the financial perfor- mance of the most valuable global brands, we apply standard and new multi- factor performance measurement models. To compare our results with previous US-based evidence (e.g.Madden et al. (2006)), we use the state-of-the-artCarhart (1997)four-factor model that controls for size, value and momentum. However, we also take into consideration the latest trends in asset pricing, employing the five-factor model ofFama and French (2015)that incorporates additional explana- tory factors. Motivated byJohansson et al. (2012), we moreover intend to investigate thefinancial performance of the most valuable brands during different market states to examine whether there are differences between bear and normal periods. To the best of our knowledge, we are thefirst to investigate the most valuable brands in more detail. In particular, we conduct an industry-specific analysis to control for biases owed to thefinancial performance of the different industries the most valuable brand can be allocated to. Finally, we do not only consider the lists provided by In- terbrand, but we also examine the most valuable brands provided by Forbes and BrandZ to ensure the robustness of our results. We are thefirst to use more than one list of the most valuable brands.
Ourfindings suggest that the most valuable brands outperform the market during the overall period from 2000 to June 2018 as well as during different market conditions.
However, the extent of the outperformance is much larger during market turmoil than during normal periods, suggesting that the most valuable brands tend to perform better during bearish market conditions. Moreover, wefind that the outperformance is driven by only a few industries that are in particular business services, technology and retail. Analyzing thefinancial performance of the most valuable brands provided by Forbes and BrandZ reveals similar results to those of Interbrand. We suggest that the outperformance is due to the nature of the most valuable brands.
The structure of the paper is the following: The next chapter provides information on the data and methods used in the article, chapter 3 reports the results and chapter 4 presents a conclusion.
2. Methods
To analyze the performance of the most valuable brands around the world, we examine the lists that are provided by Interbrand on an annual basis. The publicly available Interbrand data are most often applied in literature when measuring the financial performance of a brand (see e.g., Haigh and Perrier, 1997; Madden et al., 2006). Interbrand, which publishes its list of the world’s most valuable brands online (seehttps://www.interbrand.com/ for further information) and earlier in the Financial Times and BusinessWeek, calculates the brand value covering an analysis of thefinancial performance of the branded products or services, of the role the brand plays in purchasing decisions, and of the brand’s competitive strength.
According to Interbrand, thefinancial analysis measures thefinancial return to inves- tors. During this process, Interbrand calculates how much of a company’s total sales falls under a particular brand. Then, Interbrand projectsfive years of sales and earn- ings tied to each brand’s products and services and calculates how much of these earnings is derived from the power of the brand (e.g. after operating costs, taxes).
The role of the brand is the portion of the purchase decision attributable to the brand.
Interbrand analyzes historical roles of brands and ranks the companies in an index.
The third factor in the brand value calculation process is the strength of the brand. It covers the ability of the brand to create loyalty, and, therefore, helps to create sus- tainable demand for the product or service in the future.
Each company on the list must generate at least a third of its earnings from outside its home country, be recognizable beyond its base of customers, and have publicly available marketing andfinancial data. Interbrand only ranks the strength of individ- ual brand names, not portfolios of brands (e.g. LVHM or Proctor and Gamble). The ranking also excludes airlines, as it is hard to separate the brands’impact on sales from factors such as routes and schedules. Pharmaceutical brands do not appear because consumers typically predominantly relate to the product. Due to the nature
of the list, we only look at global brands. Often also local brands can have a compet- itive advantage (Schuiling and Kapferer, 2004).
The global Interbrand list is published since 2000. In our analysis, we cover all 18 ver- sions of the lists from 2000 to 2018. To investigate whether branding creates share- holder value, we compare the financial performance of the brand-focused companies from the Interbrand list with that of the MSCI World which serves as mar- ket benchmark. To do so, we create a monthly value-weighted portfolio. Our portfolio is rebalanced annually to avoid a survivorship bias. Previous literature sometimes in- cludes all companies that appeared on the list at least once (e.g.Madden et al., 2006) and keeps them in the sample to the end. We also have performed this procedure and find similar results. However, as expected, this procedure leads to a degree of overes- timation of the results. All performance-based data are taken from Datastream.
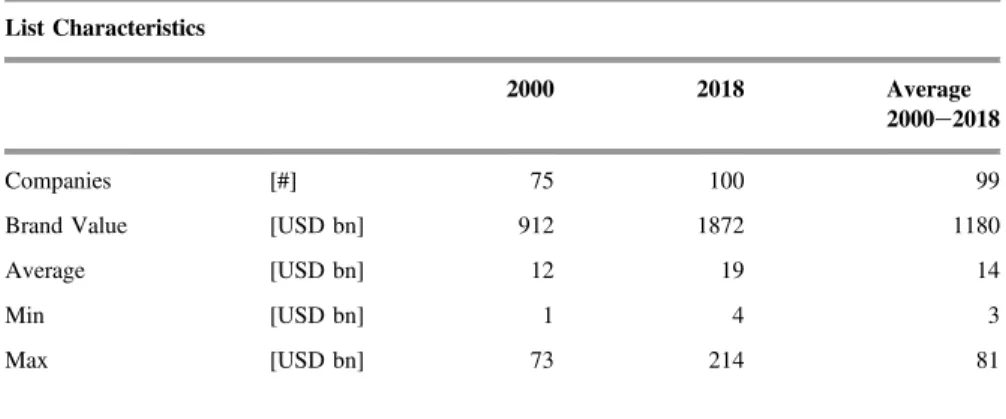
Table 1presents summary statistics for the characteristics of the 18 lists provided by Interbrand, including the number offirms, the total brand value as well as the average, minimum, and maximum brand value for thefirst list in 2000, the last list in 2018, and the average list.
Table 1provides some interesting information about the composition of the Interbrand lists. The number of includedfirms is on average 99. Thefirst list of the year 2000 only considered 75firms, while all following versions of the list contain 100 companies per year. The total brand value considerably increased from 912 billion USD in 2000 to 1.872 billion USD in 2018. On average, the total brand value is 1.180 billion USD.
Though thefirst list only contains 75 companies and therefore consequently has a smaller total brand value, the average total amount of brand value indicates that the brand value heavily increased within the past few years. The average brand value of a company is 14 billion USD. The average minimum brand value is 3 billion USD, whereas the average maximum brand value is 81 billion USD.
Table 1.Summary statistics.
List Characteristics
2000 2018 Average
2000e2018
Companies [#] 75 100 99
Brand Value [USD bn] 912 1872 1180
Average [USD bn] 12 19 14
Min [USD bn] 1 4 3
Max [USD bn] 73 214 81
This table presents the summary statistics, with the number of companies in the list, the sum, the average, the minimum and the maximum of the brand value of the companies. All brand values are in billion USD.
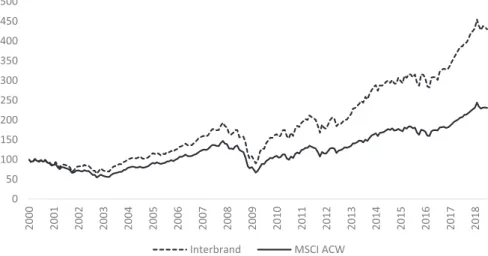
Fig. 1gives afirst impression to the performance of the most valuable brands. It pre- sents a 100 USD investment in the most valuable brands (dotted line) and the market (solid line) in the period from January 2000 to June 2018. Within thefirst nine years, the brands portfolio performs slightly better, but nevertheless relatively similarly to the market benchmark. However, from 2009 onwards, the most valuable brands outperform the market. At the end, the investment in the market had increased to approximately 250 USD, while the investment in the most valuable brands more than doubled, growing to approximately 250 USD in 2014 and approximately 450 in 2018. Thesefindings indicate that there could be differences between the valuable brands and the market in terms offinancial performance. In particular, the most valu- able brands list contains different industries that might drive the performance of the overall sample, e.g. automotive, energy, sporting goods, technology or retail. Thus, it appears helpful to further analyze this topic. In particular, we examine the following two hypotheses, which are formulated in a negative way:
Hypothesis 1:Irrespective of the market condition, the most valuable brands perform similar to the overall market.
Hypothesis 2:Irrespective of the market condition, all industry-specific subgroups of the most valuable brands perform similar to the market.
Abnormal returns may be model-specific. Therefore, we employ different multi- factor time series regression models to examine the financial performance of the most valuable brands. Our first model is the Carhart (1997) four-factor model.
The model is widely used infinancial literature (e.g.Lobe and Walksh€ausl, 2016;
Scheurle and Spremann, 2010) and allows us to compare our results with those of prior studies (e.g.,Hsu et al., 2013). Considering new developments in performance
0 50 100 150 200 250 300 350 400 450 500
2000 2001 2002 2003 2004 2005 2006 2007 2008 2009 2010 2011 2012 2013 2014 2015 2016 2017 2018
Interbrand MSCI ACW
Fig. 1.100 USD Investment in the Interbrand portfolio and the market benchmark. Thisfigure illustrates the development of a $100 investment in the Interbrand portfolio (dashed line) over the sample period from January 2000 through June 2018. For comparison, a similar investment in the market benchmark (solid line) is included.
measurement, we enhance our analysis by using thefive-factor model ofFama and French (2015), which is an extension of the Fama and French (1993) model by including the factors RMW and CMA. The three-factor model of Fama and French (1993)takes into consideration the factors size and value, the Fama and French (2015)model, on the other hand, additionally takes into account further fun- damentals of the underlying companies, e.g. information taken from balance sheets.
Using the approach ofNofsinger and Varma (2014), we analyze different time pe- riods. From January 2000 to the end of our analysis, June 2018, wefind two bear periods in the MSCI World Index. One is from March 2000 to October 2002 and the second is from October 2007 to March 2009.
This results into the following regressions:
RiRf¼DBaBþDNaNþbiMKTþsiSMBþhiHMLþwiWMLþei; ð1Þ
RiRf¼DBaBþDNaNþbiMKTþsiSMBþhiHMLþriRMWþciCMAþei: ð2Þ
Regression 1 characterizes theCarhart (1997)four-factor model. Regression 2 de- scribes theFama and French (2015)five-factor model. Riis the monthly return of the portfolio and Rfis the monthly risk-free rate, i.e. the U.S. t-bill rate. DN and DBare dummy variables.DNis one during the normal period andDBis one during the bear periods. The symbolarepresents the alpha. Alpha is a measure of the out- or underperformance. There is one alpha for the bear period (aB) and one for the normal period (aN). eiis the regression residual. MKT is calculated as the monthly return of the MSCI World Index minus the monthly risk-free rate Rf
. The factor SMB is the explanatory factor related to size and calculated as stocks with small market capital- ization minus stocks with high market capitalization. HML describes the different returns of stocks with high and low book to market values. WML is the last factor of theCarhart (1997)model and considers winner vs. loser stocks. The factors RMW and CMA are the new factors of theFama and French (2015)model. RMW is robust minus weak and CMA is conservative minus aggressive. They are calculated by sub- tracting the return of the weak operating profitability portfolios from the robust oper- ating profitability portfolios and by subtracting the return on the aggressive investment portfolio from the return of the conservative investment portfolio. We use the global factors from Kenneth French’s data library to explain our global stock returns. This is necessary, as the model factors are country-specific (see e.g.Fama and French (2012)andGriffin (2002)). To overcome autocorrelation and heteroske- dasticity we useNewey and West (1987)robust standard errors.
3. Results & discussion 3.1. General results
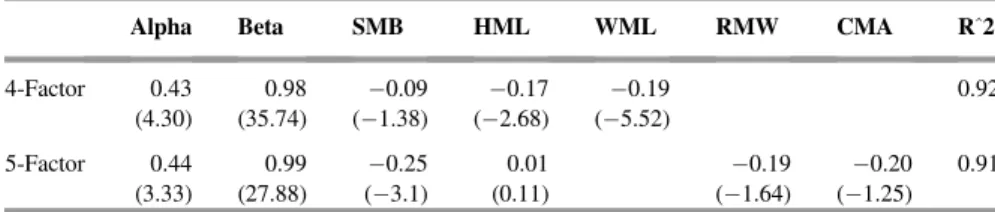
Table 2presents the result of theCarhart (1997)four-factor model and theFama and French (2015)five-factor model over the full sample period.
Our four-factor model results reveal that the most valuable brands outperform the market in the period from 2000 to June 2018. By controlling for size, value, and mo- mentum, wefind an alpha estimate of 0.43% per month that is significantly different from zero. Thisfinding is in line with previous literature that observes an outper- formance of valuable brands (e.g.,Madden et al., 2006;Hsu et al., 2013). Wefind that the most valuable brands are slightly less risky than the benchmark and, more- over, our internationalCarhart (1997)model results support the evidence of negative SMB and HML factor loading, characterizing a bias towards large caps and growth stocks (e.g.,Madden et al., 2006). Thefinding of large companies lies in the nature of the list, as the most valuable brands from Interbrand mainly consist of multibillion USD companies such as Apple and Toyota. The significant negative WML factor loading implies that valuable brands performed poorly within the past months.
TheFama and French (2015)five-factor model results confirm the statistically sig- nificant outperformance of the four-factor model.
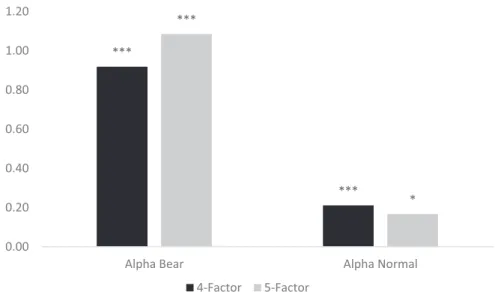
We separately investigate bear and normal periods.Fig. 2shows the alphas during the two market phases, using theCarhart (1997)four-factor model and theFama and French (2015)five-factor model.
Moving from the full period to bear and normal market periods reveals a changed picture. Wefind significant alphas in both periods, irrespective of the model. How- ever, bear alpha estimates are much larger than normal alpha estimates. With alpha estimates of more than 0.80% per month, wefind a very large outperformance. This finding indicates that the most valuable brands appear to do better during crisis mar- kets than in normal periods. Thisfinding is reasonable as the brand portfolio contains hugefirms from many different industries equipped with strong intangible assets that
Table 2. Financial performance and firm characteristics of the most valuable brands.
Alpha Beta SMB HML WML RMW CMA R^2
4-Factor 0.43 0.98 0.09 0.17 0.19 0.92
(4.30) (35.74) (1.38) (2.68) (5.52)
5-Factor 0.44 0.99 0.25 0.01 0.19 0.20 0.91
(3.33) (27.88) (3.1) (0.11) (1.64) (1.25)
This table presents alpha estimates and portfolio characteristics based on the factor sensitivities obtained from regressing the monthly excess returns of the value-weighted Interbrand portfolio on the explanatory factors of the four-factor andfive-factor model. Robust t-statistics derived fromNewey and West (1987) standard errors are reported in parentheses.
seem to be advantageous in steering afirm through bearish markets. However, our results do not confirm the U.S.-basedfindings ofJohansson et al. (2012), who found an underperformance during the financial crisis of 2008. Covering a longer bear period and not only a period of four months during the financial crisis in 2008, we provide new insights into the U.S.-basedfindings of Johansson et al. (2012).
Generally, our significantly positive alphas prove that the most valuable brand port- folio generates shareholder value.
In summary, the results in this subsection suggest a rejection ofHypothesis 1. Given the strong differences in the overall period as well as in bear and normal markets, we interpret ourfindings as convincing evidence that the most valuable brands differ from the market in terms offinancial performance. Ourfindings indicate that the na- ture of the most valuable brands, which is characterized by huge size, a well- respected name and predominantly non-cyclical demand, is beneficial to their performance.
3.2. Industry-speci fi c in fl uences
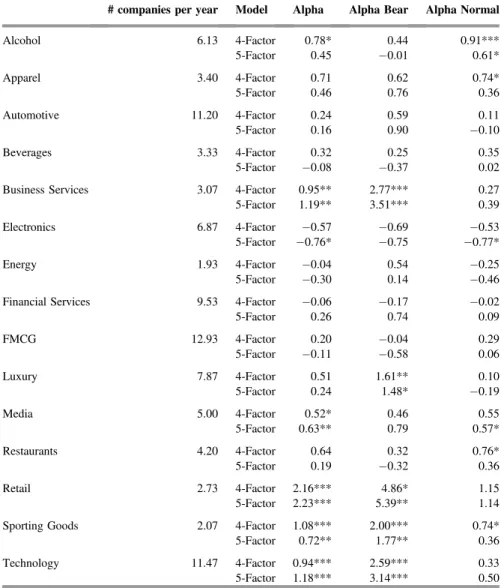
The most valuable brands can be allocated to a broad variety of industries. Therefore, we aim to analyze whether industry-specific biases during the overall period from 2000 to June 2018 as well as during bear and normal periods exist. To do so, we divide our sample into 15 different industries and build value-weighted, industry- specific portfolios that are rebalanced annually. The industry taxonomy is provided by Interbrand.Table 3reports the average number offirms included in each portfolio
***
***
***
* 0.00
0.20 0.40 0.60 0.80 1.00 1.20
Alpha Bear Alpha Normal
4-Factor 5-Factor
Fig. 2.Financial performance in bear and normal periods. Thisfigure presents monthly alpha estimates for the Interbrand portfolio using the four-factor and thefive-factor model over the bear markets, and normal markets. The asterisks give the statistical significance of the alpha estimates at the 1, 5 and 10%-level derived fromNewey and West (1987)robust standard errors.
and the alpha estimates of the different industries during the overall period, bear and normal periods, when applying the four-factor model and thefive-factor model.
Table 3reveals vast differences between the various industries in terms offinancial performance. With alpha estimates varying between 0.95% and 2.22% per month, the industriesbusiness services,retail, sporting goodsandtechnologyconsiderably outperform the market between 2000 and June 2018, when controlling for the model parameters size, value, momentum, profitability and investment. These four indus- tries are the industries that predominantly contribute to the outperformance of the valuable brands inTable 2. However, other industries, e.g., apparel, automotive, beverages, energy, FMCG and restaurants do not generate any significant alpha
Table 3.Sectorial differences in terms offinancial performance.
# companies per year Model Alpha Alpha Bear Alpha Normal
Alcohol 6.13 4-Factor 0.78* 0.44 0.91***
5-Factor 0.45 0.01 0.61*
Apparel 3.40 4-Factor 0.71 0.62 0.74*
5-Factor 0.46 0.76 0.36
Automotive 11.20 4-Factor 0.24 0.59 0.11
5-Factor 0.16 0.90 0.10
Beverages 3.33 4-Factor 0.32 0.25 0.35
5-Factor 0.08 0.37 0.02
Business Services 3.07 4-Factor 0.95** 2.77*** 0.27
5-Factor 1.19** 3.51*** 0.39
Electronics 6.87 4-Factor 0.57 0.69 0.53
5-Factor 0.76* 0.75 0.77*
Energy 1.93 4-Factor 0.04 0.54 0.25
5-Factor 0.30 0.14 0.46
Financial Services 9.53 4-Factor 0.06 0.17 0.02
5-Factor 0.26 0.74 0.09
FMCG 12.93 4-Factor 0.20 0.04 0.29
5-Factor 0.11 0.58 0.06
Luxury 7.87 4-Factor 0.51 1.61** 0.10
5-Factor 0.24 1.48* 0.19
Media 5.00 4-Factor 0.52* 0.46 0.55
5-Factor 0.63** 0.79 0.57*
Restaurants 4.20 4-Factor 0.64 0.32 0.76*
5-Factor 0.19 0.32 0.36
Retail 2.73 4-Factor 2.16*** 4.86* 1.15
5-Factor 2.23*** 5.39** 1.14
Sporting Goods 2.07 4-Factor 1.08*** 2.00*** 0.74*
5-Factor 0.72** 1.77** 0.36
Technology 11.47 4-Factor 0.94*** 2.59*** 0.33
5-Factor 1.18*** 3.14*** 0.50
This table presents alpha estimates for the full period, the bear period and the normal period on the factor sensitivities obtained from regressing the monthly excess returns of the value-weighted Interbrand port- folio on the explanatory factors of the four-factor model and thefive-factor model. *, ** and *** indicate robust t-statistics derived fromNewey and West (1987)standard errors on the 10%, 5% and 1% level.
estimates and therefore appear to perform similarly to the market. Analyzing the beta and the factor sensitivities of the industry portfolios (not tabulated), we do not observe significant differences between the portfolios with significant positive (average beta 0.98) or normal performance (0.91).
Moving to bear and normal alpha estimates reveals a similar picture. While some in- dustries achieve significant alpha estimates during bear periods, other industries do not generate any significant alpha estimates and therefore perform similarly to the market. Again, business services, retail, sporting goods and technology exhibit sig- nificant alpha estimates after controlling for size, value, momentum, profitability and investment. Their outperformance is exceptionally large with alpha estimates be- tween 1.77% and 5.39% per month. This indicates that the previously shown outper- formance of the brands portfolio can be explained by the performance of these four industries (seeFig. 2).
During normal periods, wefind fewer alpha estimates that are significantly different from zero. Moreover, we observe that the alcohol and media industry are the only industries that display significant alpha estimates for both the four-factor and the five-factor model, albeit the alpha estimates are only significant on the 10%-level.
Our results reveal that few industries drive thefinancial performance of the most valuable brands. The outperformance is owed in particular to thefinancial perfor- mance of the industriesbusiness services,retail, sporting goodsandtechnologydur- ing bear periods. We suggest that these industries in particular lead to an outperformance as their goods or services, respectively, are not cyclical and boosted by current societal trends, e.g. digitalization. As an example, business services (tech- nology) includefirms such as IBM and Xerox (Apple and Google), while retail con- tains Ebay or Amazon. This kind of companies contributes to the current trend towards digitalization, e-commerce and technological progress. Sporting goods include companies such as Adidas and Nike that represent a current trend towards healthy living and leisure activities. In addition, a vast number of people can afford the products of the previously mentionedfirms. Other explanations of the better per- formance might be investor sentiment of non-institutional investors. Our data show that the non-institutional investors hold higher shares in the US based companies of the Interbrand list than comparable companies.
In summary, given such strong differences between various industries, we also have to reject Hypothesis 2 and conclude that some industries perform better than others. Thisfinding sheds new light on previous studies, arguing that a port- folio of the most valuable brands outperforms the market (e.g., Madden et al., 2006). Moreover, thisfinding gives some indication that the selection process of Interbrand may not be the only reason for the goodfinancial performance of the valuable brands.
3.3. Robustness
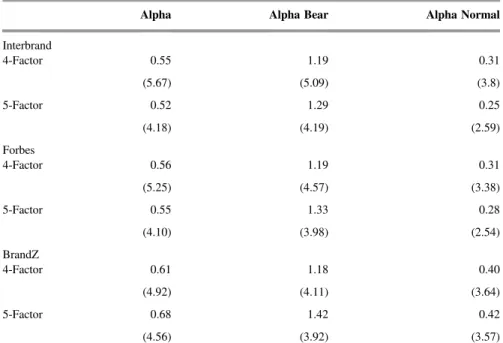
Previous literature either analyzes value-weighted portfolios (Madden et al., 2006) or equal-weighted portfolios (Hsu et al., 2013) of the most valuable brands. Our above results are based on value-weighted portfolios. However, we also analyze equal- weighted portfolios in this section to ensure the robustness of our results. Thus, we build an equal-weighted portfolio to measure thefinancial performance of the most valuable brands provided by Interbrand. Moreover, we compare the results obtained for the Interbrand lists with those of the lists provided by Forbes and BrandZ. To the best of our knowledge, Forbes and BrandZ are the only two other famous institutes that provide publically available valuable brands lists on a global basis. The method- ologies of the list providers are somewhat different. For instance, BrandZ conducts worldwide consumer research, while the others rely on a panel of experts. In addition, they start with a list of 10,000 different brands, whereas the latest Forbes list was built from a list with“more than 200 brands”. Forbes requires the brands to have a presence in the U.S., eliminating some big brands like state-owned China Mobile, which is included in the list provided by BrandZ. Despite the differences, the core of companies such as McDonalds, Coca Cola, Samsung, Toyota or Mercedes are the same in all three lists. In the 2018 list, the last list in our analysis, 51 brands are included in all three lists, 35 are in two of the three lists, and 77 brands are in just one of the three lists.
Table 4summarizes the alpha estimates for the three portfolios during the overall period from 2000 to June 2018, bear periods and normal periods.
Table 4.Performance of several brand value lists, equal-weighted.
Alpha Alpha Bear Alpha Normal
Interbrand
4-Factor 0.55 1.19 0.31
(5.67) (5.09) (3.8)
5-Factor 0.52 1.29 0.25
(4.18) (4.19) (2.59)
Forbes
4-Factor 0.56 1.19 0.31
(5.25) (4.57) (3.38)
5-Factor 0.55 1.33 0.28
(4.10) (3.98) (2.54)
BrandZ
4-Factor 0.61 1.18 0.40
(4.92) (4.11) (3.64)
5-Factor 0.68 1.42 0.42
(4.56) (3.92) (3.57)
This table presents alpha estimates for the full period, the bear and the normal periods obtained from regressing the monthly excess returns of the equal-weighted Interbrand, Forbes and BrandZ portfolio on the explanatory factors of the four-factor model and thefive-factor model. Robust t-statistics derived fromNewey and West (1987)standard errors are reported in parentheses.
All three portfolios significantly outperform the benchmark during the full period from 2000 to June 2018 with alpha estimates from 0.55% (Interbrand & Forbes) up to 0.68% (BrandZ) per month. This shows that the selection process of the brands is not the key driver for the performance, as the differences of Interbrand, Forbes and BrandZ do not impact the performance to a large extent. In addition, the most valu- able brands show the outperformance with respect to bothfinancial models (4-factor or 5-factor model). Moreover, we observe alpha estimates that are significantly distinguishable from zero in both bear and normal periods. However, wefind larger alpha estimates during market turmoil than during non-bearish periods. All in all, the results based on the lists provided by Forbes and BrandZ lead to similarfindings to those of Interbrand, indicating that there is no bias owed to the stock selection pro- cess of Interbrand.
4. Conclusion
Intangible assets are becoming more and more important in today’sfinancial envi- ronment. In particular, brand value can be considered as an important competitive advantage. In this study, we investigate thefinancial performance and underlying firm characteristics of the most valuable brands provided by Interbrand. We add to the literature by extending previous U.S.-based evidence to international markets (see p.ex.Madden et al., 2006orFehle et al., 2008). In particular, we are analyzing an internationally diversified portfolio of the most valuable brands. In addition, we separately investigate bear and normal periods to analyze whether there is a differ- ence in performance. Moreover, we are thefirst to investigate whether there is an effect of the industry-allocation of the most valuable brands. By applying the Carhart (1997)and theFama and French (2015)model, we consider the most recent developments in asset pricing.
We obverse that the most valuable brands outperform the market during the full period from 2000 to June 2018 as well as during bear and normal periods. However, the extent of the outperformance is much larger during market turmoil than during normal periods, indicating that valuable brands perform better during bear than dur- ing normal periods. Additionally, wefind that the outperformance is driven by few industries, e.g., business services, technology, sporting goods and retail. Further- more, we observe the fact that portfolios provided by Forbes and BrandZ display similar results to those of Interbrand. Generally, our results indicate that the most valuable brand portfolio generates shareholder value.
To conclude, we can state that ourfindings have a practical impact. Wefind that it is reasonable to allocate money to the most valuable brands as they generally show a tendency towards outperforming the market. Thus, we support Warren Buffet’s statement that the brand of companies matters. However, an investor should be
careful when solely investing in specific industries because performance varies considerably between different industries. Therefore, it appears to be more prudent to invest in the full sample of valuable brands than in specific industries.
Declarations
Author contribution statement
Gregor Dorfleitner, Felix R€oßle, Kathrin Lesser: Conceived and designed the exper- iments; Performed the experiments; Analyzed and interpreted the data; Contributed reagents, materials, analysis tools or data; Wrote the paper.
Funding statement
This research did not receive any specific grant from funding agencies in the public, commercial, or not-for-profit sectors.
Competing interest statement
The authors declare no conflict of interest.
Additional information
No additional information is available for this paper.
References
Ailawadi, K.L., Lehmann, D.R., Neslin, S.A., 2003. Revenue premium as an outcome measure of brand equity. J. Mark. 67, 1e17.
Barth, M.E., Clement, M.B., Foster, G., Kasznik, R., 1998. Brand values and cap- ital market valuation. Rev. Account. Stud. 3, 41e68.
Blattberg, R.C., Briesch, R., Fox, E.J., 1995. How promotions work. Market. Sci.
14, G122eG132.
Buffet, W., 2007. To the Shareholders of Berkshire Hathaway. http://www.
berkshirehathaway.com/letters/2007ltr.pdf.
Carhart, M.M., 1997. On persistence in mutual fund performance. J. Financ. 52, 57e82.
Chu, S., Keh, H.T., 2006. Brand value creation: analysis of the Interbrand-Business Week brand value rankings. Market. Lett. 17, 323e331.
Conchar, M.P., Crask, M.R., Zinkhan, G.M., 2005. Market valuation models of the effect of advertising and promotional spending: a review and meta-analysis. J.
Acad. Mark. Sci. 33, 445e460.
Doyle, P., 2000. Value-based marketing. J. Strateg. Mark. 8, 299e311.
Dutordoir, M., Verbeeten, F.H.M., Beijer, D. de, 2015. Stock price reactions to brand value announcements: magnitude and moderators. Int. J. Res. Mark. 32, 34e47.
Fama, E.F., French, K.R., 1993. Common risk factors in the returns on stocks and bonds. J. Financ. Econ. 33, 3e56.
Fama, E.F., French, K.R., 2012. Size, value, and momentum in international stock returns. J. Financ. Econ. 105, 457e472.
Fama, E.F., French, K.R., 2015. Afive-factor asset pricing model. J. Financ. Econ.
116, 1e22.
Fehle, F., Fournier, S.M., Madden, T.J., Shrider, D.G., 2008. Brand value and asset pricing. Q. J. Finance Account. 3e26.
Feldwick, P., 1996. Do we really need‘brand equity’? J. Brand Manag. 9e28.
Griffin, J.M., 2002. Are the Fama and French factors global or country specific?
Rev. Financ. Stud. 15, 783e803.
Gummesson, E., 2002. Relationship marketing in the new economy. J. Relatsh.
Mark. 1, 37e57.
Haigh, D., Perrier, R., 1997. Valuation of Trademarks and Brand Names. Brand Valuation, 3rd ed. Premier Books, pp. 35e42.
Hsu, F.J., Wang, T.Y., Chen, M.Y., 2013. The impact of brand value onfinancial performance. Adv. Manag. Appl. Econ. 3, 129e141.
Interbrand, 2000. Annual Lists of Most Valuable Brands accessible online at.www.
interbrand.com/best-brands/best-global-brands/2000/ranking/.
Interbrand, 2018. Annual Lists of Most Valuable Brands accessible online at.www.
interbrand.com/best-brands/best-global-brands/2018/ranking/.
Johansson, J.K., Dimofte, C.V., Mazvancheryl, S.K., 2012. The performance of global brands in the 2008 financial crisis: a test of two brand value measures.
Int. J. Res. Mark. 29, 235e245.
Kaul, A., Wittink, D.R., 1995. Empirical generalizations about the impact of adver- tising on price sensitivity and price. Market. Sci. 14, G151eG160.
Kerin, R.A., Sethuraman, R., 1998. Exploring the brand value-shareholder value nexus for consumer goods companies. J. Acad. Mark. Sci. 26, 260e273.
Lobe, S., Walksh€ausl, C., 2016. Vice versus virtue investing around the world. Rev.
Manag. Sci. 10, 303e344.
Madden, T.J., Fehle, F., Fournier, S., 2006. Brands matter: an empirical demonstra- tion of the creation of shareholder value through branding. J. Acad. Mark. Sci. 34, 224e235.
Mela, C.F., Gupta, S., Lehmann, D.R., 1997. The long-term impact of promotion and advertising on consumer brand choice. J. Mark. Res. 248e261.
Mortanges, C. de, van Riel, A., 2003. Brand equity and shareholder value. Eur.
Manag. J. 21, 521e527.
Murphy, J., 1990. Assessing the value of brands. Long. Range Plan. 23, 23e29.
Newey, W.K., West, K.D., 1987. A simple, positive semi-definite, heteroskedastic- ity and autocorrelation consistent covariance matrix. Econometrica 55, 703e708.
Nofsinger, J., Varma, A., 2014. Socially responsible funds and market crises. J.
Bank. Financ. 48, 180e193.
Rust, R.T., Ambler, T., Carpenter, G.S., Kumar, V., Srivastava, R.K., 2004.
Measuring marketing productivity: current knowledge and future directions. J.
Mark. 68, 76e89.
Scheurle, P., Spremann, K., 2010. Size, book-to-market, and momentum during the business cycle. Rev. Manag. Sci. 4, 201e215.
Schuiling, I., Kapferer, J.-N., 2004. Executive insights: real differences between local and international brands: strategic implications for international marketers.
J. Int. Mark. 12, 97e112.
Srivastava, R.K., Shervani, T.A., Fahey, L., 1998. Market-based assets and share- holder value: a framework for analysis. J. Mark. 2e18.
Stahl, F., Heitmann, M., Lehmann, D.R., Neslin, S.A., 2012. The impact of brand equity on customer acquisition, retention, and profit margin. J. Mark. 76, 44e63.