De fi cient Zone
C. R. Selden1 , M. R. Mulholland1 , P. W. Bernhardt1 , B. Widner1,2 , A. Macías‐Tapia3,1, Q. Ji4,5 , and A. Jayakumar3
1Department of Ocean, Earth & Atmospheric Science, Old Dominion University, Norfolk, VA, USA,2Now at Department of Marine Chemistry and Geochemistry, Woods Hole Oceanographic Institution, Woods Hole, MA, USA,3Institute of Oceanological Research, Autonomous University of Baja California, Ensenada, Mexico,4Department of Geosciences, Princeton University, Princeton, NJ, USA,5Now at Helmholtz Center for Ocean Research Kiel, Kiel, Germany
Abstract
The Eastern Tropical North Pacific Ocean hosts one of the world's largest oceanic oxygen deficient zones (ODZs). Hot spots for reactive nitrogen (Nr) removal processes, ODZs generate conditions proposed to promote Nrinputs via dinitrogen (N2)fixation. In this study, we quantified N2fixation rates by15N tracer bioassay across oxygen, nutrient, and light gradients within and adjacent to the ODZ. Within subeuphotic oxygen‐deplete waters, N2fixation was largely undetectable; however, addition of dissolved organic carbon stimulated N2fixation in suboxic (<20μmol/kg O2) waters, suggesting that diazotroph communities are likely energy limited or carbon limited and able tofix N2despite high ambient
concentrations of dissolved inorganic nitrogen. Elevated rates (>9 nmol N·L−1·day−1) were also observed in suboxic waters near volcanic islands where N2fixation was quantifiable to 3,000 m. Within the overlying euphotic waters, N2fixation rates were highest near the continent, exceeding 500μmol N·m−2·day−1at one third of inshore stations. Thesefindings support the expansion of the known range of diazotrophs to deep, cold, and dissolved inorganic nitrogen‐replete waters. Additionally, this work bolsters calls for the reconsideration of ocean margins as important sources of Nr. Despite high rates at some inshore stations, regional N2fixation appears insufficient to compensate for Nrloss locally as observed previously in the Eastern Tropical South Pacific ODZ.
Plain Language Summary
Nitrogen is an essential component of life's building blocks. Lack of nitrogen can limit growth of phytoplankton, the photosynthetic microbes at the base of most oceanic food webs. Phytoplankton in the surface ocean facilitate the removal of carbon dioxide, a strong greenhouse gas, from the atmosphere by converting it to organic forms that can aggregate and sink. Therefore, understanding the factors that control the ocean's nitrogen reservoir is important to predicting Earth's future climate. Previous research has suggested that nitrogen inputs and losses may occur in close spatial proximity because nitrogen loss processes result in a nitrogen deficit, which is thought to favor dinitrogen (N2)fixation—the microbe‐mediated conversion of unreactive N2gas to a bioavailable form. Here, we measured rates of N2fixation in an important region of nitrogen loss. We found that rates of N2fixation in the region were low, suggesting that nitrogen input and removal processes do not occur in close spatial proximity here. Nevertheless, high rates of N2fixation were observed near shore and volcanic islands, suggesting that N2fixation can occur here but was restricted. This study contributes to our understanding of N2fixation in a globally important region likely to change as Earth warms.1. Introduction
One of the major sources of reactive N (Nr) to the global ocean is dinitrogen (N2) fixation (Gruber &
Galloway, 2008), the assimilation of N2 gas into biomass. Despite the abundance of N2 in marine sys- tems, only selected prokaryotic“N2fixers”(diazotrophs) have the genetic capacity to mediate its intra- cellular reduction to ammonia, which can then be assimilated via common metabolic pathways (Berges
& Mulholland, 2008). Where present, these organisms can increase the Nr pool and consequently stimulate primary production in N‐limited ocean regions, thereby enhancing atmospheric drawdown of carbon dioxide (CO2) and, potentially, export of this carbon (C) through the biological pump (e.g., Karl et al., 2012). Understanding the factors regulating Nr inputs and losses is essential to predicting
©2019. The Authors.
This is an open access article under the terms of the Creative Commons Attribution License, which permits use, distribution and reproduction in any medium, provided the original work is properly cited.
Key Points:
• Dark, oxygen‐deplete waters in the region harbor N2fixers, but their activity is patchy and limited by organic carbon
• N2fixation rates were high in inshore euphotic waters, suggesting that coastal zones harbor more N2
fixation than previously thought
• N2fixation occurs in the region, but rates appear too low to compensate for reactive N losses on a local scale
Supporting Information:
•Supporting Information S1
•Table S1
Correspondence to:
C. R. Selden, cseld001@odu.edu
Citation:
Selden, C. R., Mulholland, M. R., Bernhardt, P. W., Widner, B., Macías‐ Tapia, A., Ji, Q., & Jayakumar, A.
(2019). Dinitrogenfixation across physico‐chemical gradients of the Eastern Tropical North Pacific oxygen deficient zone.Global Biogeochemical Cycles,33 https://doi.org/
10.1029/2019GB006242
Received 5 APR 2019 Accepted 2 SEP 2019
Accepted article online 4 SEP 2019 Published online 13 SEP 2019
, 1187–1202.
how oceanic Nrinventories vary under changing climatic conditions and affect the ocean's capacity to take up CO2.
Historically, N2fixation has been ascribed primarily tofilamentous cyanobacteria that thrive in nutrient‐ deplete tropical and subtropical waters where warm temperatures and low dissolved inorganic N (DIN) con- centrations are thought to promote diazotrophy (Carpenter & Capone, 2008; Flores & Herrero, 2005;
Mulholland et al., 2001). Recent work has challenged this paradigm, expanding the range of N2fixation to include cooler (Blais et al., 2012; Harding et al., 2018; Moisander et al., 2010; Sipler et al., 2017), aphotic (Benavides et al., 2015, 2016; Bonnet et al., 2013; Rahav et al., 2013, 2015), and mesotrophic (Knapp, 2012;
see also Bentzon‐Tilia et al., 2015; Bonnet et al., 2013; Farnelid et al., 2013; Grosse et al., 2010;
Mulholland et al., 2012; Rees et al., 2009; Sohm et al., 2011) waters. Concomitantly, appreciation has grown for the importance of diverse and broadly distributed diazotrophic clades, including eukaryote symbionts (e.g., Martinez‐Perez et al., 2016; Moisander et al., 2010) and noncyanobacterial diazotrophs (Bombar et al., 2016; Moisander et al., 2017, and references therein), to the global N cycle. The sensitivities and phy- siological ranges of these groups likely differ from those of long‐cultured and well‐studied cyanobacterial diazotrophs likeTrichodesmium, complicating our understanding of the environmental factors that regulate the magnitude and distribution of N2fixation rates (NFR) in the ocean.
Based on early studies of freshwater and tropical cyanobacterial diazotrophs, it was determined that signif- icant concentrations (i.e., ≥1μM) of ambient DIN should preclude N2 fixation, an energetically costly means of acquiring N (Falkowski, 1983; Knapp, 2012); yet, recent work suggest that this paradigm must be revisited (Knapp, 2012; see also Bentzon‐Tilia et al., 2015; Bonnet et al., 2013; Farnelid et al., 2013;
Grosse et al., 2010; Mulholland et al., 2012, 2019; Rees et al., 2009; Sohm et al., 2011). There are a variety of reasons organisms mayfix N2despite its energetic costs. Certain organisms, including some eukaryote symbionts, lack the genetic ability to reduce nitrate (NO3−; Caputo et al., 2018); investing in NO3−assim- ilation machinery may be unfavorable for diazotrophs already growing on N2(Karl et al., 2002), and some diazotrophs may use N2fixation as a mechanism for regulating intracellular state (Bombar et al., 2016), potentially decoupling its activity from N demand satiety. One energetic complication is that nitrogenase, the enzyme that mediates N2fixation, is permanently inhibited by O2(Postgate, 1998), and oxygenic diazo- trophs as well as those inhabiting oxic environments must invest in O2avoidance strategies to minimize nitrogenase turnover (Vitousek et al., 2002). Diazotrophs in anoxic environments could evade this cost, potentially making N2fixation more favorable (Großkopf & LaRoche, 2012). Active N2fixation has now been observed in low‐O2waters despite ambient DIN concentrations in excess of 1 μM (Bonnet et al., 2013; Dekaezemacker et al., 2013; Farnelid et al., 2013; Fernandez et al., 2011; Hamersley et al., 2011;
Jayakumar et al., 2017; Loescher et al., 2014), as well as in ammonium (NH4+)‐rich anoxic sediments (e.g., Andersson et al., 2014; McGlathery et al., 1998).
There are three major O2‐deplete regions of the pelagic ocean—in the Eastern Tropical North Pacific (ETNP), Eastern Tropical South Pacific (ETSP), and Arabian Sea (DeVries et al., 2012). The O2minimum zones (OMZs), that is, the low‐O2depth horizon, and O2deficient zones (ODZs), where O2is undetectable using common sensors, are predominantly below the euphotic zone (Paulmier & Ruiz‐Pino, 2008). The majority of N2 fixation within such waters is consequently mediated by noncyanobacterial diazotrophs (Chang et al., 2019; Jayakumar et al., 2012, 2017), some portion of which are presumably heterotrophic.
Heterotrophic diazotrophs can become organic C‐limited, particularly in deep waters, and organic C avail- ability may therefore constrain their NFR (Bombar et al., 2016). Indeed, dissolved organic C additions has enhanced NFR in both mesopelagic (Benavides et al., 2015; Bonnet et al., 2013; Rahav et al., 2013) and epi- pelagic waters (Loescher et al., 2014; Rahav et al., 2015).
Pelagic ODZs account for roughly one third of Nrloss from the ocean (DeVries et al., 2012). Significant Nr
deficits are observed in these regions relative to the concentrations of other dissolved constituents including phosphate (soluble reactive phosphate, SRP) and iron (Fe), an essential cofactor in the nitrogenase enzyme (Dixon & Kahn, 2004). As such, these waters are hypothesized to favor diazotrophic activity once advected into the euphotic zone, where the remaining DIN is rapidly depleted, by limiting the growth of competitors who cannotfix N2(Deutsch et al., 2007; Monteiro et al., 2011). In so doing, these geochemical signals (e.g., low DIN:SRP) are believed to play a critical role in the feedback mechanism between N2fixation and Nr
losses regulating the ocean's Nrinventory (Weber & Deutsch, 2014); however, Fe limitation of N2fixation
may spatially decouple Nrinputs from losses (Weber & Deutsch, 2014), as hypothesized for the South Pacific basin (Bonnet et al., 2017; Dekaezemacker et al., 2013; Knapp et al., 2016, 2018; Weber & Deutsch, 2014).
The North Pacific receives higher aeolian Fe inputs than the South Pacific Ocean (Jickells et al., 2005), but N2 fixation measurements in the ETNP ODZ region remain sparse despite local observations of diazotrophs (Jayakumar et al., 2017; White et al., 2013).
This study leveraged naturally occurring light, nutrient, and O2gradients in the ETNP to characterize N2
fixation by mixed diazotroph communities with respect to these variables. The influence of dissolved organic C availability on N2fixation below the euphotic zone was investigated by amending whole water incubations with either glucose or a mixed amino acid solution. By furthering understanding of the physico‐chemical factors regulating diazotroph activity, this study contributes to our evolving view of N2fixation in the marine environment and the feedback mechanisms maintaining the ocean's Nrinventory.
2. Materials and Methods
We measured NFR, nutrient concentrations, and hydrographic characteristics within and adjacent to the ETNP ODZ aboard the National Oceanic and Atmospheric Administration vessel Ronald H. Brown in April 2016, during an El Niño–Southern Oscillation (ENSO) event (Climate Prediction Center, 2019). The cruise track extended southeast along the Mexican coastline from the Rosa Seamount (25°N, 115°W) off the Baja peninsula to 15°N and 99°W, proximal to the Guerrero‐Oaxaca border, then offshore in a northwes- terly direction to 18°N and 113°W (Figure 1a).“Inshore”was defined here as being within 200 km of the coastline; however, all stations were beyond the shelf break and were at least 2,000 m deep. Our sampling strategy was optimized for high‐resolution data collection along vertical gradients of light, dissolved nutri- ents, and O2.
2.1. Hydrographic and Nutrient Measurements
Vertical profiles of temperature, salinity, O2, and chlorophyllafluorescence were obtained at 16 stations using a Sea‐Bird SBE 11plus CTD, equipped with a model 43 dissolved oxygen sensor (detection limit ~3 μmol/kg O2), a LI‐COR Biospherical Photosynthetically Available Radiation (PAR) Sensor, and a Seapoint Chlorophyll Fluorometer. These instruments were mounted to a sampling rosette holding twenty‐four 12‐L Niskin bottles from which water samples were collected at selected depths to measure chlorophylla and dissolved nutrient concentrations. Water for N2fixation incubations in the euphotic zone and below the ODZ was also collected from Niskin bottles (see below). Chlorophyllaconcentrations were determined via the nonacidification method (Welschmeyer, 1994). NO3−plus nitrite (NO2−) and SRP concentrations were measured onboard using an Astoria‐Pacific nutrient autoanalyzer following standard colorimetric methods (Parsons et al., 1984) and according to the manufacturer's specifications. A Biosciences Ultrospec 2100prospectrophotometer was used for NO2−analysis (Parsons et al., 1984), and NO3−concentrations were calculated by difference. NH4+ concentrations were determined fluorometrically using the Figure 1.Bathymetry overlain by station numbers (a) and dissolved O2(μmol/kg) and nitrite (NO2−,μM) concentrations, collected using the Sea‐Bird CTD and Pump Profiling System respectively, along an isopycnal surfaceσθ= 26.25 (b, c), illustrating the extent of the study region and oxygen deficient zone. Oxygen deficiency was defined by O2concentrations below detection (3μmol/kg) and NO2−concentrations exceeding 0.5μM.
orthophthaldialdehyde method (Holmes et al., 1999). DIN was calculated as the sum of NO3−+NO2−and NH4+concentration. Further details of these analyses are available in the supporting information Text S1.
In addition to discrete measurements, a Pump Profiling System, developed and built by the Monterey Bay Aquarium and Research Institute (Sakamoto et al., 1990), was used to generate near‐continuous nutrient profiles in real time to approximately 350 m and to collect low‐oxygen water. This system was composed of a cable, hose, and a small rosette to which a submersible water pump, a Sea‐Bird SBE 19 SeaCAT CTD, WETStar Fluorometer, Sea Tech Beam Transmissometer, and a LI‐COR Biospherical PAR Sensor were mounted. The Pump Profiling System was deployed to a maximum depth of 400 m. Water was pumped directly from depth to the laboratory to generate in situ nutrient profiles and to an on‐deck station where samples from the O2minimum depth horizon were collected for incubation experiments (see below). In the laboratory, thisflow ranfirst through an MBARI‐modified Durafet pH sensor before being shunted to an Alpkem Astoria‐Pacific Rapid Flow Analysis System which determined concentrations of NO3−plus NO2−, NO2−, and NH4+
at a rate of one measurement per second. NO3−and NO2−measurements were made following manufacturer's instructions (Sakamoto et al., 1990). The orthophthaldialdehyde method (Holmes et al., 1999) was adapted for the Rapid Flow Analysis System and used to determine in situ NH4+concentrations. A Fast Repetition Rate Fluorometer collected chlorophyllafluorescence profiles at a rate of one sample per 30 s.
2.2. N2Fixation Incubation Experiments
Whole water was collected from the Niskin bottles or pumped from depth anoxically using the Pump Profiling System for N2fixation incubation experiments carried out above, below or within the OMZ, respec- tively (Table 1). We define the OMZ as the region of the water column in which the lowest O2concentrations were observed at a site. This is distinct from the ODZ, operationally defined by O2concentrations below the limit of detection (LOD) of the Seabird O2sensor (3μmol/kg) and NO2−concentrations exceeding 0.5μM which has been deemed indicative of functionally anoxic conditions (Thamdrup et al., 2012).
NFR measurements were made using a modified version of the traditional15N2bubble method (Montoya et al., 1996). In the traditional15N2bubble method,15N2gas is injected into afilled sample bottle and15N enrichment of the particulate N (PN) pool is measured following an incubation period. The assimilation rate of the15N tracer into biomass (i.e., NFR) can then be calculated using a mixing model as shown below (equa- tion (1); Montoya et al., 1996). N2gas is, however, slow to equilibrate, causing source pool enrichment (i.e., dissolved N2enrichment) to change over the course of the incubation which may result in an underestima- tion of NFR (Böttjer et al., 2017; Großkopf et al., 2012; Mohr et al., 2010). To address this issue, the dissolu- tion of highly enriched 15N2 gas (~99%, Cambridge Isotopes, Tewksbury, MA) was hastened following injection by slowly inverting sample bottles on a large seesaw for 15 min. The seesaw consisted of aflat panel affixed to a central axis with baskets on either side in which incubation bottles were secured laterally. In this configuration, the15N2gas bubble traveled the full length of each bottle as the panel was gently rocked.
Cambridge Isotope15N2gas was selected because, while significant15N‐NH4+and‐NO3−concentrations have been observed in other brand stocks, these contaminants have only been reported from Cambridge Isotope stocks at tracer‐level concentrations (Dabundo et al., 2014). The remaining gas bubble was then Table 1
Summary of N2Fixation Rate Measurement Incubation Protocols Above (EUPH), Within (OMZ), and Below (DEEP) the Oxygen Minimum Layer (Typically
~150–400 m)
Depth horizon Bottle type Collection protocol Incubation conditions Duration
EUPH Clear PETG bottles (1 L) Collected in shaded 10‐L carboys from Niskin bottles
Incubated in appropriately shaded on‐deck tanks with continuously flowing surface seawater
~24 hr
OMZ Amber glass bottles (4 L) Collected anoxically and directly from depth using pump
Incubated in the dark in a walk‐in cold van at ~12 °C
~24 hr DEEP Amber glass bottles (4 L) Collected in shaded 10‐L
carboys from Niskin bottles
Incubated in the dark in either ~12 °C cold van or 4 °C walk‐in refrigerator
~48 hr
Note. Note that not all“OMZ”samples exhibit suboxia (<20μmol/kg). See Text S1 for a detailed description of sample handling. OMZ = O2minimum zone.
removed using a syringe prior to the incubation period, and15N enrichment of the N2pool was measured directly (see below).15N2uptake experiments were carried out in triplicate. A detailed description of sample collection and incubation procedures is available in the supporting information Text S1.
Euphotic samples were incubated on‐deck in tanks equipped with neutral density screens to approximate light levels at the depth of sample collection, which was determined using the PAR sensor mounted to the CTD rosette. Continuouslyflowing surface seawater maintained near‐ambient surface temperatures in the deck incubators. Subeuphotic waters (below the 0.1% light level; Table 2) were incubated in the dark, in either a ~12 °C cold van or a 4 °C walk‐in refrigerator, depending on the temperature at the depth of sample collection. Due to a cold van malfunction, incubations from within the OMZ at Stations 8, 9, and 10 were carried out in a darkened room retrofitted with air conditioners, capable of maintaining temperatures at
~16 °C. While warmer temperatures may increase metabolic activity (Price & Sowers, 2004), the effect of this slight increase in temperature on N2fixation was likely minimal as rates from the affected bottles were largely undetectable (Table S2). For samples above and within the OMZ or ODZ, uptake experiments were 24 hr. Water samples collected below the OMZ or ODZ, where biomass is lower and cooler temperatures reduce metabolic rates (Price & Sowers, 2004), were incubated for 48 hr. Incubations were terminated by filtration of the sample onto precombusted (450 °C for 2 hr) Whatman GF‐75filters (nominal pore size of 0.3μm). Immediately prior tofiltration, an aliquot of each sample to measure15N2enrichment in each bottle was transferred to a helium‐flushed exetainer using a gas‐tight syringe and preserved by adding 50μl of a helium‐flushed zinc chloride or mercuric chloride solution (50% w/v ZnCl2 and HgCl2, Thermo Fisher Scientific, Waltham, MA).
To establish the initial isotopic composition and concentration of PN in water samples, water from each depth sampled was collected separately. Triplicate samples werefiltered at the time of collection in a desig- nated laboratory space isolated from where experiments using15N tracer were being conducted to avoid iso- tope contamination. Filters for both initial andfinal PN analysis were placed in sterile microcentrifuge tubes and frozen until analysis at Old Dominion University. Filters were dried for 48 hr at 50 °C then pelletized in tin discs. PN and C concentrations and isotopic enrichment were measured using a Europa 20‐20 isotope ratio mass spectrometer (IRMS) equipped with an automated N and C analyzer. Isotopic enrichment of dis- solved N2 was measured using a Europa 20‐22 continuous flow IRMS, as described in Jayakumar et al. (2017).
2.3. NFR Calculations and Error Analysis Volumetric NFR were calculated using equation (1):
NFR¼APNf−APN0
AN2−APN0
×½PN
Δt (1)
whereAPN0,APNf,AN2, and [PN] represent the average initial andfinal PN isotopic composition, isotopic composition of the N2pool, and PN concentration of three replicate samples. The standard deviation of these replicates was propagated to calculate NFR error following Montoya et al. (1996) and Gradoville et al. (2017).
The incubation time is denoted asΔt, and the uncertainty of this value was estimated based on the average time required tofilter the given volume of seawater relative to the length of the incubation. A sensitivity ana- lysis of the relative contributions of each measurement to total error is presented in Table S1. See supporting information Text S1 for further details on rate and error calculations.
A change in the atom percent enrichment of the PN pool was considered detectable if it exceeded 3 times the standard deviation of eight 12.5‐μg N replicate standards which were run daily (Ripp, 1996). A LOD was cal- culated for each volumetric rate by substituting this value forAPNf−APN0. A limit of quantification was simi- larly calculated by taking 10 times the standard deviation of the replicate standards (Ripp, 1996). The average LOD for PN mass, calculated based on blanks (3σ,n= 4), among all IRMS runs for this study was 0.83μg N.
This value, however, should not be confused with the minimum mass deemed acceptable for determination of isotope ratios. The accuracy of enrichment measurements decreases with decreasing mass (Sharp, 2017), and so a lower limit of acceptable mass was established per instrument run based on the linearity of the atom percent measured during each standard run; on average this was 3.0μg N for this study. The mass of stan- dards ranged from 1.17 to 100μg N.
Areal (depth‐integrated) rates were calculated for the euphotic zone (defined as the region extending from the surface to the 0.1% light level; Table 2) by averaging volumetric rates measured for the surface mixed layer, from the bottom of the surface mixed layer to the 1% light level, and from the 1% to 0.1% light level, then depth integrating over each layer and summing the respective contributions. If the volumetric rate at a given depth was below the LOD, then it was assigned a value of 0 nmol N·L−1·day−1for the purpose of calculating the areal rate. If the calculated NFR was above the LOD but below the limit of quantification (i.e., it was detectable but not quantifiable), then the LOD was used in the areal rate calculation. The error associated with both nondetectable and nonquantifiable rates was propagated along with that of all quanti- fiable rates. NFR were not depth integrated in subeuphotic waters because quantifiable rates were sparse and accurate estimation of subeuphotic areal NFR consequently untenable. Areal NFR from the euphotic zone were compared between inshore (1 to 9) and offshore (10 to 16) stations using a two‐tailed Mann‐ WhitneyUtest.
2.4. Carbon Addition Bioassays
Carbon addition bioassays were carried out at Stations 6, 9, 12, 15, and 16 at depths within and below the core ODZ to determine whether the supply of organic C limited NFR. For these experiments, samples were collected as described above. Once sealed, but prior to15N2 additions, one set of triplicate bottles was amended with glucose (Cambridge Isotopes, Tewksbury, MA) and another with a mixture of 20 amino acids (Cambridge Isotopes, Tewksbury, MA), resulting in afinal addition of 40‐μmol organic C/L to both sets of incubations. This addition approximately doubled the availability of dissolved organic C (Hansell &
Carlson, 1998; Loh & Bauer, 2000), although much of the ambient dissolved organic C pool is thought to be very old and likely refractory (Druffel et al., 1992), thereby augmenting the significance of these C amend- ments to microbial communities present. Unamended triplicate incubations served as controls.
Experimental treatments were compared to controls using a Wilcoxon signed‐rank test. Where N2fixation was not detected or quantified, the lower limit of these values, zero or the LOD respectively, was used in sta- tistical calculations. This approach increases our ability to detect significant differences (lower Type II error risk) but increases the probability of a false positive (higher Type I error risk).
3. Results and Discussion
3.1. Regional Hydrography
Surface waters of the ETNP are characterized by high productivity, a strong pycnocline that prevents local ventilation of deep waters, and a thermal front where the cool California Current meets the eastern Pacific warm pool (Fiedler & Talley, 2006). Our study area crossed this frontal region. Alongshore surface waters were cool to the north (<25 °C at Stations 1 to 4) and warmer south of the Gulf of California (Table 2 and Figure 2a). Surface waters at Stations 9 to 13 exceeded 27.5 °C, characteristic of the eastern Pacific warm pool (Fiedler & Talley, 2006), and salinity was low, below 34 (Table 2 and Figure 2b), suggestive of Tropical Surface Waters (T> 25,S< 34; Fiedler & Talley, 2006).
These waters typically exhibit little seasonal and ENSO variability in sea surface temperature and salinity;
however, ENSO events are associated with a local deepening of the thermocline (Fiedler & Talley, 2006).
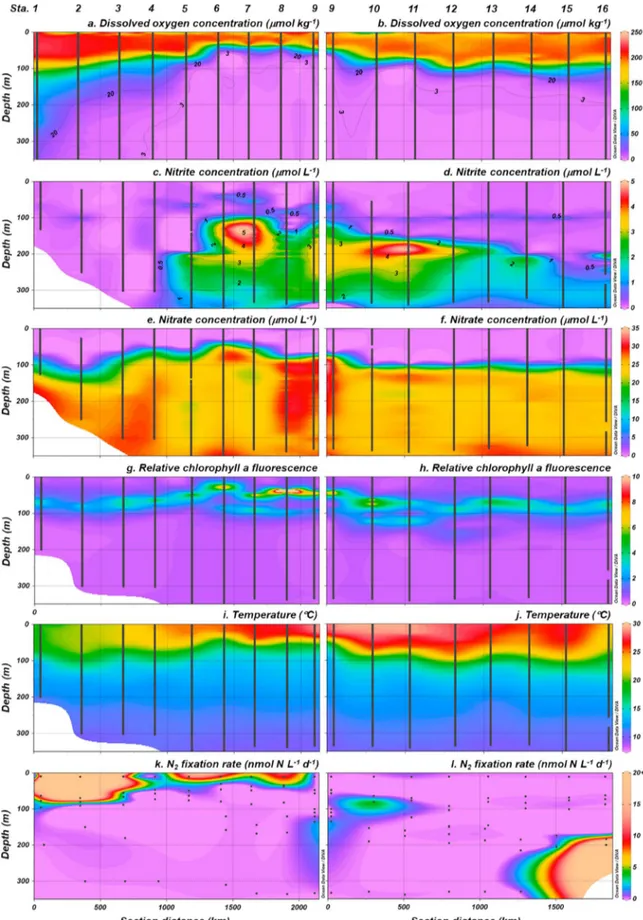
In the present study, the thermocline shoaled and strengthened alongshore to the southeast (Figures 3i and 3j), following regional trends observed previously (Fiedler & Talley, 2006). The nitracline and primary chlorophyllafluorescence maximum also shoaled to the southeast, accompanied by an increase in chloro- phyllafluorescence (Figures 3e–3h). A secondary chlorophyll afluorescence maximum was evident at Stations 5 to 13, where the core ODZ was thickest and NO2−concentrations highest.
O2‐deficient waters, defined as those in which O2concentrations were below detection by the Seabird O2
sensor (<3μmol/kg) and NO2−concentrations were above 0.5μM (Thamdrup et al., 2012), were observed at all offshore stations (10 to 16) and inshore Stations 5 to 9 along the west coast of Mexico (Figures 1b and 1c). The thickness of the ODZ increased toward the southeastern most station, expanding from 200 to 400 m at northerly Stations 15, 16, and 5, to a thickness of 100 to 600 m at Station 9. Stations 1 to 4 were north of the ODZ but exhibited suboxic (<20μmol/kg O2) conditions below the euphotic zone (Figures 3a–3d). The OMZ, the low‐O2depth horizon present throughout the region, was characterized by slightly higher salinity (~34.7–34.8) and warmer temperatures (10–16 °C) relative to underlying waters (S≈24.6–34.5,T≤10°C)
and higher salinity (Table S2) than the California Current water intruding from the north (Fiedler & Talley, 2006). DIN:SRP ratios remained within a narrow range (8.5 to 12) from below the thermocline to approximately 400 m then gradually increased, stabilizing near 14 after 1,000 m. In the North Pacific Ocean, DIN:SRP ratios are typically ~14.1, averaging 14.6 below 1,000 m (Tyrrell & Law, 1997).
3.2. N2Fixation in the Euphotic Zone
NFR were relatively high in the warm, sunlit, oxic waters (Figures 3k and 3l), where NO3−and SRP concen- trations were low (Figures 3e, 3f, S1a, and S1b) and DIN:SRP was consistently below 3 (Figures S1c and S1d), suggestive of Nrlimitation. N2fixation was detected in euphotic waters at 10 of the 16 stations, in 17 of 62 samples collected (Table S2). Most of these samples came from Stations 1 to 8 where surface salinity and con- centrations of chlorophyllaand SRP were comparatively high (Figures 2b, 2c, S1a, and S1b). NFR were high- est and extended deeper into the water column where the thermocline was weakest, constricting toward the southeast as the underlying ODZ shoaled (Figures 3a, 3b, 3k, and 3l and Table S2). Depth‐integrated eupho- tic NFR among inshore stations (1 to 9) were significantly greater than at offshore stations (10 to 16; Mann WhitneyU,n1= 7,n2= 9,U= 93,p= 0.003), ranging from below detection to 6,230 ± 5,500μmol N·m
−2·day−1(Table 2) with a median value among all measurable areal rates of 176μmol N·m−2·day−1. Recent work has focused on the potential for enhanced N2fixation along productive continental margins, particularly those in which low DIN:SRP waters are upwelled (e.g., Bonnet et al., 2013; Chang et al., 2019;
Dekaezemacker et al., 2013; Deutsch et al., 2007; Fernandez et al., 2011; Jayakumar et al., 2017; Knapp Figure 2.(a) Surface temperature (°C), (b) salinity, and (c) chlorophyllaconcentration (μg/L) overlain by black dots sized to represent N2fixation rates depth inte- grated throughout the euphotic zone (see Table 2 for values). White dots depict locations where N2fixation was undetectable throughout the euphotic zone.
Figure 3.Hydrography (a–j) and N2fixation rates (k, l) in upper 350 m of inshore (left column) and offshore (right column) transects. Black lines and dots represent continuous or near‐continuous profiles collected from the Pump Profiling System and discrete sampling points, respectively.
et al., 2016; Loescher et al., 2014; Sohm et al., 2011; White et al., 2013). Comparison of these systems to Nr‐ deplete ocean gyres, where the bulk of global N2 fixation has historically been ascribed, is, however, complicated by methodological biases—chiefly, the potential underestimation of the classic15N2bubble method due to the slow dissolution of15N2(Böttjer et al., 2017; Großkopf et al., 2012; Mohr et al., 2010), as well as underestimation or overestimation of N2fixation when measured indirectly via the acetylene reduction assay (Mulholland et al., 2004). Luo et al. (2012) calculated an arithmetic mean areal NFR for North Pacific (0°N to 55°N) euphotic zone of 120 ± 22μmol N·m−2·day−1based on studies applying these methods primarily in the basin's interior. Böttjer et al. (2017) accounted for the approximately twofold underestimation of the 15N2 bubble method in time series data from station ALOHA (North Pacific subtropical gyre) and calculated an average rate of 230 ± 136μmol N·m−2·day−1. These values are in relatively good agreement if a correction factor of 2 (Böttjer et al., 2017; Großkopf et al., 2012) is also applied to Luo and colleague's basin‐wide estimate.
Of the 10 stations where N2fixation was detected in surface waters for this study, areal rates exceeded the station ALOHA mean (Böttjer et al., 2017) atfive—all located near the coastline (Table 2). If, however, we account for the error inherent to the areal rates presented in this study and variation from the mean at sta- tion ALOHA, only rates at Stations 1, 2, and 5 clearly exceed mean N2fixation at station ALOHA, and only at Stations 1 and 2 does N2fixation exceed the maximum rate at ALOHA where NFR range from 21 to 676μmol N·m−2·day−1(Böttjer et al., 2017). Nevertheless, the observed distribution of euphotic zone N2fixation in this study and the elevation of these rates above the regional average suggest that conditions in the cooler, saltier, more productive water mass near the continent favored the growth and activity of local diazotroph communities relative to those in the central North Pacific basin. Thisfinding supports the observation of Jayakumar et al. (2017) that euphotic, inshore NFR in the ETNP ODZ region exceeded those offshore.
Euphotic NFR reported here (with a median value of 176μmol N·m−2·day−1) were also high relative to waters overlying the ETSP ODZ, where Bonnet et al. (2013) and Fernandez et al. (2011) estimate average areal rates of 43 ± 6 and 48 ± 68μmol N·m−2·day−1, respectively, using the classic15N2bubble method.
These values are in relatively good agreement with other incubation‐based estimates from the ETSP eupho- tic zone (Dekaezemacker et al., 2013; Knapp et al., 2016) and are comparable to those observed in the central South Pacific gyre (94 ± 61μmol N·m−2·day−1; Halm et al., 2012), indicating that surface waters of the ETSP ODZ do not support elevated NFR as predicted by Deutsch et al. (2007). Despite these low regional means, Loescher et al. (2014) observed N2fixation to exceed 800μmol N·m−2·day−1at one coastal sulfidic station in the ETSP, suggesting that sulfidic events may sporadically enhance rates. Nevertheless, N2 fixation is thought to be only a minor contributor of Nrto export production in the ETSP (Chang et al., 2019; Knapp et al., 2016).
Table 2
Surface Hydrographic Characteristics and Depth‐Integrated N2Fixation Rates Within the Euphotic Zone
Station Latitude (°N) Longitude (°W)
Surface
temperature (°C) Surface salinity
Euphotic zone depth (m)
Areal euphotic N2fixation rate (μmol N·m−2·day−1)
1 25.791 −115.261 19.5 34.4 99 814 (396)
2 24.041 −112.891 21.0 34.6 114 6,226 (5,493)
3 22.608 −110.202 21.9 34.6 88 102 (30)
4 21.292 −108.242 24.3 34.5 107 14 (17)
5 19.985 −106.313 25.2 34.6 81 588 (108)
6 18.688 −104.416 25.3 34.4 65 250 (66)
7 17.500 −102.700 26.6 34.3 89 99 (29)
8 16.250 −100.845 27.0 34.2 69 257 (95)
9 15.000 −98.999 28.7 33.7 74 Not detected
10 15.469 −101.502 29.2 33.6 94 85 (41)
11 15.901 −103.799 29.1 33.6 110 7 (21)
12 16.315 −106.091 28.0 33.5 107 Not detected
13 16.778 −108.398 27.7 33.9 108 Not detected
14 17.204 −110.712 25.9 34.1 111 Not detected
15 17.625 −113.001 27.0 33.7 117 Not detected
16 19.508 −111.895 24.0 34.6 118 Not detected
Note. Rate measurement propagated error, calculated as described in section 2, is given in parentheses.
N2fixation may be greater in ETNP surface waters relative to those of the ETSP because the North Pacific receives higher aeolian Fe inputs (Jickells et al., 2005). Indeed, Fe amendments have been observed to increase NFR in ETSP surface waters (Dekaezemacker et al., 2013). It must be noted, however, that the pre- sent study occurred during an ENSO event, which has been associated with enhanced NFR in the ETSP (Dekaezemacker et al., 2013). Further work is therefore necessary to elucidate whether this event affected N2fixation in the ETNP and consequently whether these regional differences are truly significant.
High rates of N2fixation—on par with those observed here at Stations 1, 2, and 5 (Table 2)—have also been observed along other ocean margins (e.g., Carpenter et al., 1999; Mulholland et al., 2012, 2014; Rees et al., 2009; Shiozaki et al., 2015; Wen et al., 2017) including areas characterized by low concentrations of DIN rela- tive to SRP and other essential elements (e.g., Fe, silicon for diatom‐diazotroph symbioses) resulting from riverine inputs (Grosse et al., 2010; Subramaniam et al., 2008) and advection of ODZ‐generated Nr‐deplete waters into marginal seas (White et al., 2013). In the Amazon River plume and Gulf of California, the latter of which receives Nr‐deplete waters from the ETNP ODZ via the California Undercurrent, areal NFR as high as ~8,000μmol N·m−2·day−1(Subramaniam et al., 2008) and ~900μmol N·m−2·day−1(White et al., 2013) have been reported, respectively. Along the Southern New England shelf, NFR reached 4,106μmol N·m
−2·day−1in Fall (Mulholland et al., 2019). In euphotic waters of the Benguela Upwelling System, another eastern boundary upwelling system predicted by Deutsch et al. (2007) to support elevated N2fixation, rates were far lower but increased inshore (Sohm et al., 2011) as observed in this study. Thesefindings, along with the present study, suggest that diazotroph activity is heightened along ocean margins, particularly where Nr
is drawn down relative to SRP and other nutrients as occurs in the ETNP (Table 2).
Proximity to the continent likely offers advantages to some diazotrophic groups relative to others, depending on the physical and chemical properties of the water column, their metabolic requirements, and genetic cap- abilities. Enhanced availability of organic C in productive inshore waters may provide energy to hetero- trophic diazotrophs and low‐oxygen/anoxic microzones for noncyanobacterial diazotrophsfixing N2 in fully oxic waters (Bombar et al., 2016), such as those observed in the ETNP and ETSP ODZs (Chang et al., 2019; Jayakumar et al., 2017). Indeed, sinking particles have been identified as loci of both cyanobacterial and noncyanobacterial diazotrophs in the North Pacific subtropical gyre (Farnelid et al., 2019).
Additionally, Fe can be delivered to the ocean from the continents via aeolian transport and riverine inputs (Hunter & Boyd, 2007), the latter of which may also serve as a source of Fe‐binding ligands (e.g., Bundy et al., 2015; Laglera & van den Berg, 2009) that maintain dissolved Fe in solution (Rue & Bruland, 1995; van den Berg, 1995).
3.3. Subeuphotic N2Fixation and Carbon Limitation
Within OMZ waters, NFR were detected at 3 of the 16 stations (Stations 9, 15, and 16), within 5 of the 39 samples collected at this depth horizon—all of which were from suboxic (<20μmol/kg O2) waters (Table S2). Within the OMZ at Stations 9 and 15, the highest volumetric rates were 1.55 ± 0.41 nmol N·m−2·day
−1(Station 9 at 135 m,n= 3) and 1.01 ± 1.34 nmol N·m−2·day−1(Station 15 at 174 m,n= 3), respectively.
Of the four stations (6, 9, 12, and 16) where NFR were measured in samples collected below the ODZ (≥500 m), rates were only detected at Stations 9 and 16 and were lower than measurable rates within the ODZ at these sites (Figure 4). O2concentrations at these stations remained low, below 150μmol/kg, even in deep waters (Table S2). At Station 9, a NFR of 0.87 ± 0.99 nmol N·m−2·day−1(n= 3) was measured at 1,000 m;
N2fixation was detectable but not quantifiable at 2,000 m. Rates at station 16 exceeded those measured else- where by about an order of magnitude (9.88 ± 3.85 nmol N·m−2·day−1at 184 m and 35.9 ± 12.0 nmol N·m
−2·day−1at 200 m,n= 3), peaking at the top of the ODZ but remaining quantifiable to 3,000 m (0.36 ± 0.15 nmol N·m−2·day−1,n= 3; Figure 4).
If low‐O2conditions within the water column favor N2fixation, then one would expect NFR to be commen- surately higher within and around the ODZ than in other oceanic environments. Both within and below the OMZ at all sites, however, NFR appeared patchy. Of the 51 subeuphotic samples collected, N2fixation was only detected in 10 (Table S2), and 5 of these were from one station, 16, located near the inner Revillagigedo Islands. NFR previously reported in oxygenated, aphotic marine waters are typically on the order of 1 nmol N·L−1·day−1or lower (Moisander et al., 2017, and references therein). This rate is comparable with measure- ments presented here from within and below the ETNP OMZ including in ODZ waters, except for at station
16 (Table S2 and Figure 4), suggesting that suboxic/anoxic conditions alone do not result in elevated subeuphotic N2fixation in this region. This appraisal is consistent with work from Jayakumar et al. (2017) who previously observed few low rates (<1 nmol N·L−1·day−1) of N2fixation within the upper ETNP ODZ.
The patchy distribution of subeuphotic N2fixation presented here contrasts with some observations from the ETSP ODZ. In the ETSP, Bonnet et al. (2013) reported that low (<1 nmol N·L−1·day−1) but persistent rates below the euphotic zone account for ~90% of total N2fixation. Similarly, Fernandez et al. (2011) estimated that the ODZ contributed about 5 times as much newlyfixed N as oxic, euphotic waters. More recent work from Chang et al. (2019), which applied the same15N2bubble removal method as this study, diverges from these accounts. Chang et al. (2019) found no detectable NFR below the euphotic zone. This stark difference may be partially the result of methodological disparities, including the erroneous assumption in earlier ODZ work (e.g., Fernandez et al., 2011) that atom percent15N of the initial PN pool is equivalent to atmospheric values, which may inflate reported rate measurements (Chang et al., 2019; Voss et al., 2001). Whether the subeuphotic environment contributes significantly to total regional Nrinputs also depends upon the manner in which detection limits are calculated given that even very small rates may be substantive when depth inte- grated through a deep water column. Regardless, NFR measurements in subeuphotic ETSP waters are lar- gely within the range of those observed elsewhere in the ocean's interior (≤1 nmol N·L−1·day−1; Moisander et al., 2017, and references therein) and generally appear less patchy than those reported here from the ETNP.
Though NFR were undetectable throughout most of the ETNP OMZ, dissolved organic C additions of either glucose or dissolved free amino acids (DFAA) stimulated N2 fixation within all OMZ waters surveyed, including within the ODZ at Stations 6 and 12 where NFR were otherwise undetectable (Figure 5a). This finding indicates that the ETNP OMZ hosts populations of diazotrophs capable offixing N2 in suboxic and anoxic waters, despite significant concentrations of ambient DIN. Additions largely failed to stimulate N2fixation below the OMZ (Figure 5b). As energy‐rich molecules, DFAA and glucose may enter both Figure 4.Profiles of N2fixation at stations 6 (inshore), 9 (southerly), and 16 (northerly, offshore). Black stars, open circles, andfilled circles represent rates that were below detection, detectable but nonquantifiable, and quantifiable. For rate measurements below detection, the limit of detection was plotted; for nonquantifiable rates, the limit of quantification was plotted. Error bars for quantifiable rates represent the propagated error. The shaded region represents where core oxygen deficient zone conditions (O2concentrations below detection and >0.5‐μM NO2−) occurred. A deep profile of N2 fixation rates was also produced at station 12 (offshore); however, no N2fixation was detected at this site (Table S2).
catabolic and anabolic pathways. Consequently, ourfindings could indicate that diazotrophic activity within the OMZ is limited by either energy or assimilable C.
DFAA additions stimulated NFR atfive of seven sampling locations within the OMZ, although this lacked statistical significance when compared across all sites (Wilcoxon signed rank,n1=n2= 7,p= 0.44), poten- tially due to the small sample size. Conversely, DFAA additions inhibited while glucose additions stimulated rates at certain depths at Station 16 (Figure 5). Within the ETSP ODZ, Bonnet et al. (2013) found that DFAA additions stimulated N2fixation in all ODZ waters surveyed while mixed carbohydrate or glucose additions only stimulated N2fixation at one third of the stations surveyed. DFAA additions also enhanced N2fixation in the Red Sea (Rahav et al., 2013, 2015) and mesopelagic waters of the southwest Pacific Ocean (Benavides Figure 5.Results of carbon addition bioassay experiments within (a) and below (b) the O2minimum zone. Nitrogen fixation rates (NFR) marked with an open circle were detectable but not quantifiable. Stars indicate rates that were below the detection limit. For quantifiable rates, error bars express the propagated error. For DNQ rates, error bars express the limit of quantification calculated for that sample. Where no N2fixation was detected, the error bar marks the limit of detection. Neither additions of glucose nor dissolved free amino acids (DFAA) increased rates within (n1=n2= 7) or below (n1=n2= 8) the O2minimum zone significantly when compared across all sites (Wilcoxon signed rank,p> 0.05).
ODZ = oxygen deficient zone.
et al., 2015). These observations are perhaps surprising given that DFAA offer a source of N as well as C for heterotrophs and might thus be expected to suppress NFR. If, however, DFAA were used in catabolic rather than anabolic (assimilatory) processes, organic N might be excreted in the form of a waste product. We hypothesize that site‐specific differences in microbial response to DFAA and glucose additions are due to population‐specific substrate preferences, variability in energy/C limitation, or both. Regarding the response of diazotrophic communities below the OMZ, lower temperatures can slow bacterial metabolic rates (Price &
Sowers, 2004) and decrease affinity for organic substrates (Nedwell, 1999). The response of any diazotrophs present in deep waters may consequently have been dampened within the timeframe of incubations, or there are no diazotrophs present and active at this depth.
Ourfindings suggest that diazotrophs inhabit the ETNP region andfix N2 at elevated rates in euphotic waters near the coast but are largely inactive in OMZ and ODZ waters, as well as in the water column below, likely due to energy or C limitation at the OMZ depth horizon. In subeuphotic waters, detectable NFR were mostly on par with previous reports from oxygenated aphotic ocean waters (Moisander et al., 2017, and refer- ences therein). High NFR were, however, observed within suboxic waters at one station, 16, located near vol- canic islands, suggesting that noncyanobacterial diazotrophs may thrive in DIN‐replete waters given the right conditions. Here, NFR were highest in suboxic waters and decreased below the ODZ (Figure 4) follow- ing increased O2concentrations (Table S2) and decreased provision of organic C given that particulate C fluxes decrease with depth (Martin et al., 1987). High‐carbon/low‐oxygen conditions have previously been associated with increased activity of noncyanobacterial diazotrophs (Severin et al., 2015), and further inves- tigation into how these factors may affect the range and magnitude of noncyanobacterial N2 fixation is warranted.
4. Conclusions
Here, we present the most extensive data set to date of N2fixation above, within, and below the ETNP ODZ.
Our observation of high rates (>500μmol N·m−2·day−1) at inshore stations supports the growing body of evi- dence that ocean margins contribute a greater amount of newly fixed N than previously thought (Mulholland et al., 2019; Tang et al., 2019). We hypothesize that continental inputs, inshore upwelling, or both alleviate growth limitation by an essential factor and play a key role in shaping the distribution of dia- zotrophs in Nr‐deplete waters regionally. Furthermore, we speculate that diazotrophs residing near the coast (this study) and in marginal seas (White et al., 2013) where Nr‐deplete waters upwell are important to basin‐ scale compensation of Nrdeficits generated in the ETNP ODZ and merit further investigation.
This study also demonstrates that subeuphotic, suboxic waters in the region harbor diazotrophs capable of fixing N2despite high (>20μmol N·L−1·day−1) ambient DIN concentrations, but their activity is highly pat- chy and appears C limited. While it is known that ambient DIN does not necessarily preclude N2fixation (Knapp, 2012), the observation of relatively high NFR (>9 nmol N·L−1·day−1) in DIN‐replete deep waters challenges the prevailing hypothesis that N cycle homeostasis is maintained, in part, by the occurrence of N2fixation where Nris drawn down (Deutsch et al., 2007; Weber & Deutsch, 2014). Further work is needed to elucidate the response of diverse diazotrophic communities to DIN. Despite observation of patchy but high rates within and around the ETNP ODZ, N2fixation throughout the region appears too low to compen- sate for local Nrlosses. Thisfinding adds to the mounting evidence that Nrinputs and losses are spatially decoupled (Bonnet et al., 2013, 2017; Knapp et al., 2016, 2018; Weber & Deutsch, 2014). By elucidating the distribution of N2fixation across physico‐chemical gradients in an undersampled but biogeochemically important region, this study contributes to our evolving understanding of the factors that regulate marine N2fixation and the ocean's Nrinventory.
References
Andersson, B., Sundbäck, K., Hellman, M., Hallin, S., & Alsterberg, C. (2014). Nitrogenfixation in shallow‐water sediments: Spatial dis- tribution and controlling factors.Limnology and Oceanography,59(6), 1932–1944. https://doi.org/10.4319/lo.2014.59.6.1932 Benavides, M., Bonnet, S., Hernández, N., Martínez‐Pérez, A. M., Nieto‐Cid, M., Álvarez‐Salgado, X. A., et al. (2016). Basin‐wide N2fixation
in the deep waters of the Mediterranean Sea.Global Biogeochemical Cycles,30, 952–961. http://doi.org/10.1002/2015GB005326 Benavides, M., Moisander, P. H., Berthelot, H., Dittmar, T., Grosso, O., & Bonnet, S. (2015). Mesopelagic N2fixation related to organic
matter composition in the Solomon and Bismarck Seas (Southwest Pacific).PLoS ONE,10(12), e0143775. https://doi.org/10.1371/
journal.pone.0143775 Acknowledgments
We gratefully acknowledge the efforts of the captain and crew of the NOAA vesselRonald H.Brownand the scientists who participated in the collection and analysis of the data presented here, particularly Shannon Cofield, Wei Yan, Nicole Travis, and Matt Forbes. We thank the Monterey Bay Aquatic Research Institute for the use of their pump profiling system and Margeurite Blum for her expertise in its use. Finally, we thank Bess Ward for the use of her facilities at Princeton University. This work was supported by the National Science Foundation Division of Ocean Sciences (NSF‐OCE) Grant OCE‐1356056 to M. R. M. and A.
J. Data will be made available at the website (https://www.bco‐dmo.org/
project/472492). The authors declare no conflicts of interest.