1.3 Million Years
María H. Toyos1,2 , Frank Lamy3 , Carina B. Lange2,4,5,6 , Lester Lembke‐Jene3 , Mariem Saavedra‐Pellitero7,8 , Oliver Esper3, and Helge W. Arz9
1Programa de Postgrado en Oceanografía, Departamento de Oceanografía, Facultad de Ciencias Naturales y Oceanográficas, Universidad de Concepción, Concepción, Chile,2Centro de Investigación Dinámica de Ecosistemas Marinos de Altas Latitudes, Universidad Austral de Chile, Valdivia, Chile,3Alfred‐Wegener‐Institut, Helmholtz‐Zentrum für Polar und Meeresforschung, Bremerhaven, Germany,4Centro Oceanográfico COPAS Sur‐Austral, Universidad de Concepción, Concepción, Chile,5Departamento de Oceanografía, Universidad de Concepción, Concepción, Chile,
6Scripps Institution of Oceanography, La Jolla, CA, USA,7Geowissenschaften, Universität Bremen, Bremen, Germany,
8Now at School of Geography, Earth and Environmental Sciences, University of Birmingham, Birmingham, UK,9Leibniz‐ Institut für Ostseeforschung Warnemünde, Rostock, Germany
Abstract
The Antarctic Circumpolar Current (ACC) is the world's largest current system connecting all three major basins of the global ocean. Our knowledge of glacial‐interglacial changes in ACC dynamics in the southeast Pacific is not well constrained and presently only based on reconstructions covering the last glacial cycle. Here we use a combination of mean sortable silt grain size of the terrigenous sediment fraction (10–63μm, SS) and X‐rayfluorescence scanner‐derived Zr/Rb ratios asflow strength proxies to examine ACC variations at the Pacific entrance to the Drake Passage (DP) in the vicinity of the Subantarctic Front. Our results indicate that at the DP entrance, ACC strength varied by ~6–16% on glacial‐interglacial time scales, yielding higher current speeds during interglacial times and reduced current speeds during glacials. We provide evidence that previous observations of a reduction in DP throughflow during the last glacial period are part of a consistent pattern extending for at least the last 1.3 Ma. The orbital‐scale cyclicity follows well‐known global climate changes from prevailing ca.41‐kyr cycles in the early part of the record (1.3 Ma to 850 ka; marine isotope stage 21) across the mid‐Pleistocene transition into the middle and late Pleistocene 100‐kyr world. A comparison to a bottom waterflow record from the deep western boundary current off New Zealand (Ocean Drilling Program Site 1123) reveals anti‐phased changes between the two sites. The enhanced supply of deep water along the DP and into the Atlantic Ocean during interglacials corresponds to a weakenedflow of the SW Pacific deep western boundary current.
1. Introduction
The Antarctic Circumpolar Current (ACC) is the main oceanographic feature of the Southern Ocean,flow- ing clockwise around Antarctica and connecting the Atlantic, Pacific, and Indian Ocean basins. It is the world's largest and strongest current system driven by strong southern westerly winds (SWW), buoyancy for- cing, and large‐scale changes in thermohaline circulation (Rintoul et al., 2018). The ACCflow is constrained by bathymetric boundaries (Gordon et al., 1978), with the Drake Passage (DP) being the region of narrowest and shallowest constriction of itsflow path (e.g., Meredith et al., 2011). Three major oceanographic fronts have been described within the ACC, traditionally termed the Subantarctic Front (SAF), the Polar Front (PF), and the Southern ACC Front (SACCF; Orsi et al., 1995). The southern limit of Upper Circumpolar Deep Water (UCDW) marks the southern boundary of the ACC (Orsi et al., 1995). The location of these fronts is not stationary and changes on seasonal and interannual (e.g., Freeman & Lovenduski, 2016;
Gille, 2014) to orbital time scales (e.g., Gersonde et al., 2003, 2005; Kemp et al., 2010). Frontal positions were likely displaced northward during the Last Glacial Maximun (LGM; Gersonde et al., 2005; Kohfeld et al., 2013) and, more generally, in glacial intervals (Howard & Prell, 1992). At the DP, the position of the SAF is crucial, because it controls the volume of Antarctic Intermediate Water (AAIW) and Circumpolar Deep Water (CDW) transported from the Indo‐Pacific into the Atlantic via the“cold water route,”and as
©2020. American Geophysical Union.
All Rights Reserved.
Key Points:
• The strength of ACCflow in the SE Pacific varied strongly on glacial‐interglacial time scales
• Over the past 1.3 Ma, our results show a consistent pattern of stronger (weaker)flow during interglacials (glacials)
• The sortable silt record largely follows orbital‐scale cyclicity, changing from ca. 41‐kyr cycles into a 100‐kyr world after the MPT
Supporting Information:
• Supporting Information S1
Correspondence to:
M. H. Toyos, mtoyos@udec.cl
Citation:
Toyos, M. H., Lamy, F., Lange, C. B., Lembke‐Jene, L., Saavedra‐Pellitero, M., Esper, O., & Arz, H. W. (2020).
Antarctic circumpolar current dynamics at the Pacific entrance to the Drake Passage over the past 1.3 million years.Paleoceanography and Paleoclimatology,35, e2019PA003773.
https://doi.org/10.1029/2019PA003773
Received 23 SEP 2019 Accepted 3 JUN 2020
Accepted article online 11 JUN 2020
such, has implications for the southern‐sourced Atlantic deep return flow in the global Meridional Overturning Circulation (MOC; Gordon, 1986).
There is substantial disagreement about ACCflow speed changes in response to glacial and interglacial cli- mates during the Quaternary. Recent studies reconstructing ACC flow speed focused on the DP area (Lamy et al., 2015; Roberts et al., 2017) and the downstream Scotia Sea (McCave et al., 2014). For the last gla- cial cycle, Lamy et al. (2015) reconstructed DP throughflow based on sediment records from the Chilean mar- gin at the entrance to the DP and the southernmost Argentinean continental slope located directly at the northern margin of the DP and found a significant glacial decrease in DP throughflow. On the Atlantic side south of the Falkland/Malvinas Islands, immediately downstream of the subantarctic DP, Roberts et al. (2017) reported a similar reduction in current speed. Thesefindings are consistent with generally reduced current velocities of the ACC during the last glacial and concomitant reduction in interbasin exchange in the Southern Ocean, most likely regulated by variations in the SWWfield over the Subantarctic Zone and changes in Antarctic sea ice extent (Lamy et al., 2015). In contrast, sediment records from the Scotia Sea (McCave et al., 2014) suggest minor ACC speed variations between the LGM and the Holocene near the PF and a small decrease southward, most likely due to increased sea ice cover. Density reconstructions across the ACC south of Australia based on benthic foraminifera demostrate a moderate overall increase of the ACC flow during the LGM (Lynch‐Stieglitz et al., 2016). Likewise, a 1.2‐Ma‐long sediment record of grain sizes in the sortable silt fraction from the subantarctic southwest Pacific indicates intensification of the deep western boundary current (DWBC) east of New Zealand during glacial periods (Hall et al., 2001). Finally, in the Indian sector of the Southern Ocean, a magnetic grain size record suggests that the ACC was weak during warm stages and strong during glacial epochs throughout the past ~500 kyr (Mazaud et al., 2010).
Between 1.25 and 0.7 Ma, Earth's climate underwent a fundamental change when the dominant periodicity of orbital‐scale climate cycles changed from primarily 41 to 100 kyr (e.g., Clark et al., 2006; Elderfield et al., 2012; Maslin & Brierley, 2015). This period is known as the mid‐Pleistocene transition (MPT). In the Southern Ocean, the MPT is linked to a variety of important atmosphere‐ocean changes leading to an equa- torward extension of polar surface water masses (Martínez‐Garcia et al., 2011), an increase in stratification and reduced upwelling during glacial times (Hasenfratz et al., 2019), and enhanced nutrient export to the eastern equatorial Pacific potentially caused by a northward migration of fronts (Robinson et al., 2019).
Together, these changes are thought to contribute to the increasing amplitudes of glacial to interglacial CO2concentrations (Chalk et al., 2017) with lower atmospheric CO2concentrations during glacial times (Hasenfratz et al., 2019).
Little is known about changes in the dynamics of the subantarctic ACC and its interplay with SWWfluctua- tions across multiple glacial/interglacial cycles including the MPT with its widespread change in orbital cyclicity (Clark et al., 2006) and the Mid‐Brunhes Event (MBE). The MBE took place at marine isotope stage (MIS) 12/11 and is characterized by an increase in the glacial/interglacial amplitudes and warmer intergla- cials thereafter, as well as changes in insolation, CO2concentrations, and carbon storage in the ocean (e.g., Bouttes et al., 2018; Yin & Berger, 2012). Atmosphere‐ocean changes in the subantarctic ACC region likely affected the global MOC as well as the exchange of heat, salt, and nutrients zonally across the Southern Hemisphere and meridionally between high and low latitudes. Reconstructions of past ACC dynamics may thus provide important baseline data on the physical configuration of a region critical for understand- ing orbital‐scale atmospheric CO2fluctuations and the storage of CO2in the deep ocean.
In this study, we reconstruct changes in the intensity of ACCflow in the subantarctic SE Pacific over the past 1.3 Myr, based on grain size analyses and X‐rayfluorescence (XRF) scanner data from a sediment core located near the SAF at the DP entrance (Figure 1). We provide evidence that the previously observed pattern of a glacial reduction of the ACC upstream and downstream of the DP throughflow extends to glacial intervals across the past 1.3 Ma. A comparison with variations of deep Pacific inflow in the SW Pacific basin (Hall et al., 2001) reveals contrasting flow pattern in the core of the ACC and the deep boundary current in the SW Pacific.
2. Study Area
The DP is located between South America and Antarctica; it is 850 km wide and represents the major geo- graphical constriction for the transport of the ACC into the Atlantic. The exact timing of the opening of this
oceanic gateway is still discussed controversially; it occurred during the Eocene to Oligocene (between ~45 and ~22 Ma). The opening resulted from the breakup of the continental connection between South America and the Antarctic Peninsula along thefinal steps of Gondwana separation (e.g., Barker & Burrell, 1977;
Eagles & Jokat, 2014; Livermore et al., 2005). The opening of the DP together with the Tasmanian gateway allowed the extensive exchange of water between the main ocean basins and the development of the ACC at
~24 Ma (Pfuhl & McCave, 2005), which contributed to the thermal isolation of Antarctica (Barker, 2001).
In the DP, the main tectonic and morphological feature is the Shackleton Fracture Zone (an intra‐oceanic Figure 1.(a) Map of the Drake Passage area showing the location of core PS97/093‐2 (yellow star) and core sites studied by Lamy et al. (2015), McCave et al. (2014), and Roberts et al. (2017) (blue points). White lines mark ACC modern fronts (Orsi et al., 1995). SAF, Subantarctic Front; PF, Polar Front;
SACCF, Southern Antarctic Circumpolar Current Front; SB, southern boundary of the ACC. Black dashed lines a–a′and b–b′are two hydrographic transects shown in (b) and (c). SFZ, Shackleton Fracture Zone; HFZ, Hero Fracture Zone. (b) Salinity section across the Drake Passage with the projected core position (data from Gouretski & Koltermann, 2004). LCDW, Lower Circumpolar Deep Water; UCDW, Upper Circumpolar Deep Water; AAIW, Antarctic Intermediate Water; SAMW, Sub‐Antarctic Mode Water. (c) Geostrophicflow velocities through the Drake Passage from Renault et al. (2011) with the projected core position; positive velocities are eastward, and negative velocities are westward.
ridge in the center that separates the Scotia Plate to the east and the Antarctic Plate to the west). The West Scotia ridge also intersects with the Shackleton Fracture Zone to the east and with the Phoenix‐Antarctic ridge to the west; the latter borders in the south with the Hero Fracture Zone. The spreading of the Phoenix‐Antarctic Ridge ended at ca. 3.6 to 2.6 Ma, when the Phoenix Plate became part of the Antarctic Plate (Bohoyo et al., 2019). Core PS97/093‐2 is located in the oceanic domain of the Antarctic Plate, north of the Phoenix‐Antarctic ridge ~80 km SW of the southern end of the Chile Trench (Figure 1a).
The oceanographic boundaries of the ACC are defined by zonal variations in water mass properties of the Southern Ocean. The three major fronts associated with the ACC, namely, the SAF, PF and SACCF, are clo- sely spaced in the DP (Figure 1a). The bulk of the geostrophic transport of the ACC is associated with the SAF and PF, where strong surface and bottom velocities have been observed (e.g., Renault et al., 2011) (Figure 1c). Site PS97/093 is bathed in Lower Circumpolar Deep Water (LCDW), which is characterized by a salinity maximum (34.70–34.75 psu) (Gordon, 1975; Orsi et al., 1995). It consists of a mixture of North Atlantic Deep Water that enters the Southern Ocean through the Atlantic and is transported east around the Antarctic continent, while mixing with waters from the Indian and Pacific Oceans and dense waters from Antarctica (e.g., Carter et al., 2008). The UCDW is located at a depth range of ~1,400 to 2,500 m, above the LCDW. It is characterized by an oxygen minimum and high nutrient concentrations.
At depths shallower than 1,400 m, AAIW, identified by a salinity minimum, and the low‐density Sub‐ Antarctic Mode Water occur (Figure 1b). The export of fresh and cold UCDW, AAIW, and Sub‐Antarctic Mode Water via the cold water route strongly influences the upper limb of Atlantic MOC, together with the“warm water route”(inflow of the warm and salty water masses though the Agulhas Current System into the South Atlantic; Gordon, 1986). Below the depth of AAIW, the deep water masses tend to return equator- ward as a relatively strong and narrow DWBC. In the Atlantic Ocean, the DWBC is located on the continen- tal margin off South America below the southward moving North Atlantic Deep Water, and the inflow consists of a mixture of Weddell Sea Bottom Water and CDW from the DP.
3. Material and Methods
Piston core PS97/093‐2 (57°29.94′S; 70°16.48′W; 16.45 m in length) was recovered in 2016 on board R/V Polarsternduring expedition PS97“Paleo Drake”(Lamy, 2016). The coring site is located approximately 40 km NW of the SAF, within the mainflow of the ACC at the Pacific entrance to the DP, at 3,781‐m water depth and is bathed in LCDW (Figure 1).
3.1. Bulk Sediment Parameter and Geochemistry
The archive half of core PS97/093‐2 was measured with an AVAATECH XRF Core Scanner at the Alfred‐
Wegener‐Institut (AWI, Bremerhaven) for high‐resolution element intensities of Ca, Fe, Zr, Rb, Ti, and K at 0.5 cm resolution. Total carbon (TC) and total nitrogen were quantified using a CNS analyzer (Elementar Varia EL III) at AWI using 100 mg of freeze‐dried and homogenized sediments. Total organic car- bon (TOC) contents were determined with a carbon‐sulfur determinator (CS‐2000, ELTRA) after the removal of inorganic carbon (total inorganic carbon) by adding 37% (vol/vol) hydrochloric acid. Calcium carbonate content (CaCO3) was calculated employing the standard equation CaCO3 [wt.%] = (TC [wt.%]−TOC [wt.%]) * 8.333. A high‐resolution CaCO3record was obtained calibrating the Ca intensities with the bulk sediment CaCO3measurements (r2= 0.92).
3.2. Grain Size Analysis
A total of 144 samples distributed along the entire sediment core were taken for grain size analysis.
The separation of the 63‐to 150‐μmfine‐sand fraction was carried out by wet sieving, whereas the silt (2–63μm) and clay fractions (<2μm) were separated by application of Stokes' law settling using Atterberg tubes. This procedure was repeated 12 to 20 times to get an almost complete separation of the two fractions.
In order to get the terrigenous silt fraction, organic matter was removed with 35% (vol/vol) H2O2. To dissolve the carbonates, sediment samples were placed in a 500‐ml beaker with 150 ml of 25% (vol/vol) acetic acid (this procedure was repeated two times). Rinsing was done until the pH of the solution reached the pH of deionized water (~6.5). Opal leaching was carried out adding 250 ml of 20% NaOH and heated to 85–90 °C for 60 min. Rinsing was repeated after this leaching step for at least four times, until the pH of
the sample reached the pH of deionized water again. Before the samples in the Sedigraph device were intro- duced, sodium polyphosphate was added to avoid coagulation of particles.
A detailed grain size analysis with 2 to 8 g of the silt fraction was performed with a Micrometric Sedigraph 5010 at AWI. The Sedigraph measures the particle size distribution using the sedimentation method and pro- vides a high‐resolution grain size distribution in steps of 0.1φ. The instrumental precision of the Sedigraph for pure standard analysis ranges from ±0.3% to ±1.9% (Bianchi et al., 1999). The way of measuring grain size distribution by the Sedigraph devices is closely related to the transport and depositional processes and estimations of current intensity (McCave & Hall, 2006). The coarse fraction of silt (size spectrum between 10 and 63μm) is referred to as sortable silt (SS) because of its noncohesive behavior. SS is considered as a proxy for estimating relative changes in the near‐bottom flow speed in deep‐sea sediments (McCave et al., 1995).
We repeated measurements of 10 samples for two to three times in order to measure the instrumental error of the Sedigraph 5100 for our sediment samples, and 10 of the analyses were replicated in the two different devices available at AWI (Unit 1 and Unit 2). For the SS parameter, the average error within the same device is ±0.18 and ±0.13μm regarding the two devices. A high‐resolution SS record was obtained using the linear equation describing the relationship between XRF core scanner‐derived Zr/Rb, smoothed with a 5‐point moving average, and the sortable silt data obtained with the Sedigraph (see section 5.1 for more details).
3.3. Biostratigraphic Time Markers
Smear slides were prepared by mounting small portions of bulk sediment on glass slides following standard International Ocean Discovery Program procedures. Thirty‐six slides were examined for calcareous nanno- fossils, and 18 for siliceous microfossils (Tables S1 and S2). Calcareous nannofossils were observed with a Leica DMRM polarized light (LM) microscope (at the University of Bremen, Germany) and a Nikon Eclipse 80i (at the University of Salamanca, Spain) at 1,000X magnification. Calcareous nannofossils were classified following the compilations of Raffiet al. (2006) and Anthonissen and Ogg (2012). Bio‐event ages were assigned based on the occurrence (or absence) of calcareous nannofossil biostratigraphical markers in selected samples from core sections of the archive half (Tables 1 and S1). Additional age markers for sediment core PS97/093‐2 were obtained from diatom biostratigraphy (Tables 1 and S2). Qualitative analysis of diatom assemblages was conducted on discrete sediment samples. Diatom counting and identification was performed with a Zeiss microscope at 1,000X magnification and followed the methods of Schrader and Gersonde (1978). The taxonomy of diatom species followed Hasle and Syvertsen (1997) and Zielinski and Gersonde (1997). The biostratigraphic zonations and diatom occurrence ranges suggested by Zielinski and Gersonde (2002) were applied.
3.4. Stratigraphic Tuning and Spectral Analyses
We used the AnalySeries software (Paillard et al., 1996) for stratigraphicfine‐tuning and spectral analyses to derive the relative power of the major cycles in the Milankovitch band. Linear trends were removed and values normalized. The frequency scale was resampled from 0 to 0.1 with a step of 0.0002. We used a Bartlett window, and the bandwidth is ~0.005.
4. Age Model
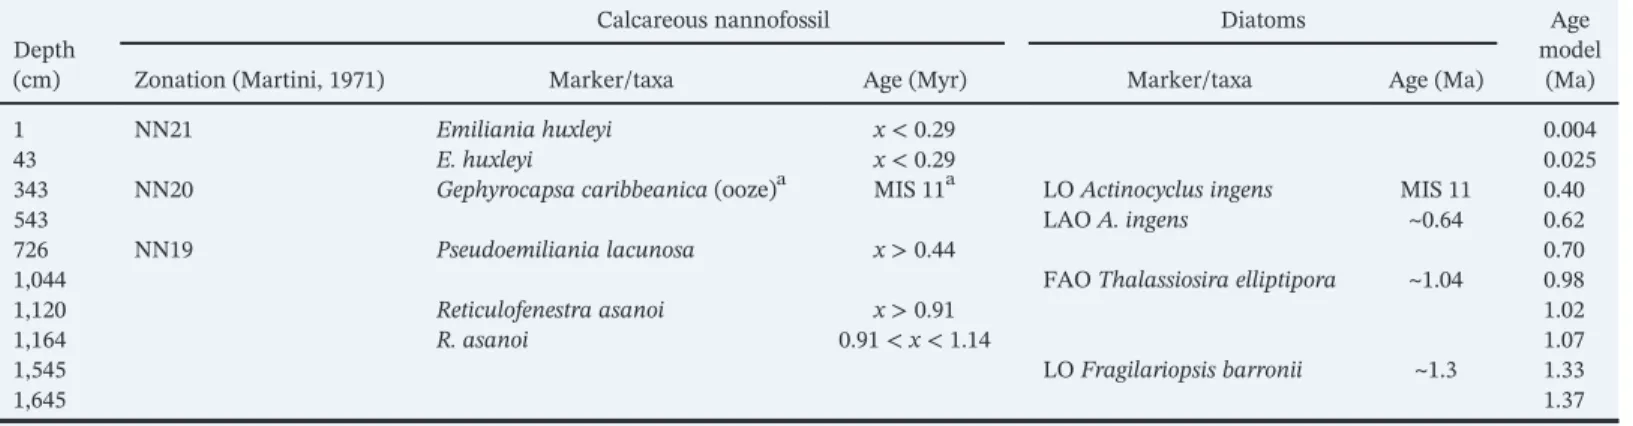
A two‐step approach was used to establish the age model for core PS97/093‐2. First, a preliminary age was derived based on onboard physical property data and biostratigraphic time markers from calcareous nanno- fossils and diatoms (Table 1 and Figure 2). Second, the high‐resolution XRF scanner‐derived records of Fe and Ca counts and the measured CaCO3contents were used tofine‐tune the PS97/093‐2 record within the age ranges of the biostratigraphic dates to the benthicδ18O stack (Lisiecki & Raymo, 2005, LR04 hereafter).
Although the presence of nannofossils is discontinuous and preservation varies strongly, Zones NN21 through NN19 are recognized based on thefirst occurrence ofEmiliania huxleyiat 0.29 Ma (between 143 and 43 cm) and the last occurrence (LO) of Pseudoemiliania lacunosa at 0.44 Ma (between 726 and 643 cm). Additionally, an ooze ofGephyrocapsa caribbeanicawas recorded at 343 cm. This characteristic ooze has been previously observed at other locations in the Pacific sector of the Southern Ocean (Gersonde, 2011; Saavedra‐Pellitero, Baumann, Ullermann, et al., 2017, Saavedra‐Pellitero, Baumann,
Lamy, et al., 2017), suggesting MIS 11 for this acme. Although several of the studied samples are devoid of calcareous nannofossils, the LO ofReticulofenestra asanoiat 0.91 Ma (between 1,120‐and 894‐cm depth in core) and thefirst common occurrence of R. asanoiat 1.14 Ma (between 1,230 and 1,164 cm) provide Table 1
Summary of Biostratigraphic Markers of Calcareous Nannofossils and Diatoms Used to Build the Preliminary Age Model of Core PS97/093‐2
Depth (cm)
Calcareous nannofossil Diatoms Age
model (Ma)
Zonation (Martini, 1971) Marker/taxa Age (Myr) Marker/taxa Age (Ma)
1 NN21 Emiliania huxleyi x< 0.29 0.004
43 E. huxleyi x< 0.29 0.025
343 NN20 Gephyrocapsa caribbeanica(ooze)a MIS 11a LOActinocyclus ingens MIS 11 0.40
543 LAOA. ingens ~0.64 0.62
726 NN19 Pseudoemiliania lacunosa x> 0.44 0.70
1,044 FAOThalassiosira elliptipora ~1.04 0.98
1,120 Reticulofenestra asanoi x> 0.91 1.02
1,164 R. asanoi 0.91 <x< 1.14 1.07
1,545 LOFragilariopsis barronii ~1.3 1.33
1,645 1.37
Note. FAO =first abundance occurrence; LAO, last abundance occurrence; LO, last occurrence.
aNote that the monospecific assemblage ofGephyrocapsa caribbeanicais not a formal calibrated datum. However, this ooze can be tied to MIS 11 based on pre- vious research (Gersonde, 2011; Saavedra‐Pellitero, Baumann, Ullermann, et al., 2017, Saavedra‐Pellitero, Baumann, Lamy, et al., 2017).
Figure 2.Age model for core PS97/093‐2. From top to bottom: LR04 benthicδ18O stack (Lisiecki & Raymo, 2005), numbers indicate marine isotope stages; XRF Fe scanner counts (blue); CaCO3content (orange) and XRF Ca scanner counts (black); age control points based on biostratigraphic markers (purple asterisks), sedimentation rate (brown), and tie points (red).
good age control for the Pleistocene sequence. Furthermore, the absence of Gephyrocapsa spp. large (>5.5μm) andHelicosphaera selliisuggests an age younger than 1.24 Ma at 1,461‐cm depth in core.
Within the stratigraphic range of this study, the LO of the diatom speciesFragilariopsis barroniiat about 1,545‐cm depth in core constrains the transition from theActinocyclus ingensZone A toA. ingensZone B at ca. 1.3 Ma. Afirst abundance occurrence ofThalassiosira elliptiporaat 1,144 cm points to the transition fromA. ingensZone B toA. ingensZone C. The top ofA. ingensZone C is constrained by the last abundance occurrence ofA. ingensat 543 cm. The LO ofA. ingensat 343 cm marks the transition from MIS 12 to MIS 11.
XRF Fe counts show clear orbital‐scale variability along most of the record (Figure 2). We tuned the PS97/093‐2 Fe content to the LR04 benthicδ18O stack (Lisiecki & Raymo, 2005) assuming low Fe contents during interglacials and high contents during glacials. The Fe content is generally representative for the sili- ciclastic fraction of the sediment. This fraction is most likely controlled by a combination of factors including dilution with biogenic material (primarily CaCO3; Figure 2) and thus preservation and/or biological produc- tion, together with varying eolian and/or glaciogenic sediment input from South America, in addition to winnowing by the ACC. We additionally used XRF‐derived Ca and CaCO3percentages for afiner‐tuning with the LR04 benthicδ18O stack as a reference curve only in the intervals where Ca and CaCO3(%) are pre- sent (Figure 2). Thus, the resulting age model has 34 tie points that consist of a combination of indicators for glacial/interglacials and biostratigraphic points (Table S3).
5. Results and Discussion
Core PS97/093‐2 consists of hemipelagic sediments and comprises distinct lithological changes (Lamy, 2016) reoccurring on orbital time scales. Interglacial sediments are primarily composed of whitish gray to white calcareous oozes (nannofossil ooze or foraminifera‐nannofossil ooze) with only minor concentrations of dia- toms. CaCO3contents above 40% occur during MIS 1 and MIS 5, approximately 70% during MIS 11, and 20–40% during most interglacials before MIS 17. Glacial and transitional sediments are weakly bioturbated, dark clayey silt with rare biogenic components and intercalated diatomaceousfine‐grained clayey silts. Some intervals are moderately bioturbated and more greenish gray in color and characterized as diatomaceous silt.
Sedimentation rates are 1.3 cm/kyr on average and range from approximately 0.5 to 3.5 cm/kyr (Figure 2).
Higher sedimentation rates occur during MIS 1–5, MIS 15–19, and MIS 37–43. Lower sedimentation rates characterize the intervals MIS 6–10 and MIS 14.
5.1. Sortable Silt, Zr/Rb Records, and Flow Speed Reconstruction
The key assumption of the SS proxy for estimating relative changes in the near‐bottomflow speed in deep‐sea sediments is that the sediment is primarily controlled by current sorting during deposition (McCave et al., 1995); coarser mean size reflects strongerflow through selective deposition (McCave & Hall, 2006).
The sources of potential uncertainties regarding the applicability of the SS proxy are ice rafted debris depos- its,fine tails of turbidity deposits, or local sediment movement and redeposition caused by changes in mud waves (McCave et al., 1995). A way to test if the sediments are current sorted consists of plotting SS against the percentage of the 10‐to 63‐μm fraction (SS%; McCave & Hall, 2006) (Figure 3). Under a current‐sorted regime, a positive correlation exists between SS and SS%, whereas unsorted sediments show no correlation.
Sortable silt values of core PS97/093‐2 display a significant positive correlation (r2= 0.78,P≪0.001,n= 148) (Figure 3a).
In order to increase the temporal resolution of our sortable silt record, we established the relationship between measured SS values with the XRF‐based Zr/Rb record (Figure 4). Changes in Zr/Rb ratios have been previously interpreted as a proxy for grain size variations (Dypvik & Harris, 2001), though mainly in lake sediments. Zr is enriched in heavy minerals (especially in zircon) (Fralick & Kronberg, 1997) and is asso- ciated with the coarser tail in grain size distributions of silty‐clayey siliciclastic sediments. Rb is associated with clay andfine silt because Rb occurs in clay minerals (Fralick & Kronberg, 1997; Taylor, 1965). Our SS data and Zr/Rb ratios show a significant positive linear correlation (Figure 3b; r2= 0.50,P≪0.001, n= 148), supporting the assumption that Zr/Rb ratios are strongly related to current strength in our deep‐sea record as well. Consequently, we transformed the XRF core scanner‐derived Zr/Rb data into SS using a linear regression (Figure 4).
Some values fall outside the general linear trend (Figure 3b). These occur particularly during the CaCO3‐rich interglacials MIS 1, MIS 5, and MIS 11, characterized by very high Zr/Rb values that are not accompanied by equally high maxima in the SS data. When the data of these three intervals (n= 30) are removed, the correla- tion between SS and Zr/Rb increases significantly (Figure 3c;r2= 0.70,P≪0.001,n= 118). When we com- pare Holocene, MIS 5, and MIS 11 to other interglacials in our record, we do not observe any significant difference in the silt distributions (Figure 3d). Therefore, we suggest that the Zr/Rb record is affected by noncurrent‐related factors during these intervals. One possibility is the occurrence of K‐feldspars. Though Rb is usually more common in clay minerals andfine silt than in medium to coarse silts, this element has the ability to act as a substitute for K in K‐feldspars, which are usually associated with the coarse silt and sand fractions (Kylander et al., 2011). To rule out this possibility, we followed Kylander et al. (2011) and examined the relationship to Ti, which is representative offine size fractions, with Rb and K. We found sig- nificant positive correlations using all data points (n= 3,254) (Figure S1), suggesting that coarser grain sizes are not important hosts for Rb and K. Finally, it is conceivable that the high Zr/Rb values during these peak interglacials reflect strong currents at our site and thus enhancement of the ACC during the interglacials because there could be a shift to coarser grain sizes that might result in a relative increase offine sand, which is excluded from the definition of sortable silt. This might result in a possible limitation of the SS as a bottom current indicator. The highfine‐sand contents in intervals with extremely high current strength as measured in Lamy et al. (2015) at the Chilean continental margin would generally support this interpretation.
To get the best adjustment to the SS‐Zr/Rb recalculation, as afirst step, we looked for the bestfit regions, establishing MIS 14 as the most suitable crop mark at the expense of MBE, which shows slightly worse sta- tistical parameters (r2= 0.717,P≪0.001,n= 92 for samples older than MBE andr2= 0.648,P≪0.001, Figure 3.(a) Linear regression between SS (μm) mean and SS percentage of PS97/093‐2 samples. Linear relations between Zr/Rb and SS (μm) of PS97/093‐2 samples. (b) All measured samples. (c) All samples with the exception of those that belong to the Holocene, MIS 5, and MIS 11. (d) Silt distribution of the Holocene, MIS 5, MIS 11, and selected interglacials (MIS 13, MIS 19, MIS 29, and MIS 39).
n= 23 for samples younger than MBE). Therefore, for the SS‐Zr/Rb recalculation, two linear regressions were used, one for the samples older than MIS 14 (Zr/Rb = 0.21 SS–2.39;r2= 0.720,P≪0.001,n= 85, and a second one for samples younger than MIS 14, excluding the Holocene, MIS 5, and MIS 11, where Figure 4.Multiproxy reconstruction of ACC current strengthfluctuation at the PS97/093‐2 site. (a) LR04 benthicδ18O stack (Lisiecki & Raymo, 2005). (b) XRF scannerfive‐point smoothed Zr/Rb variations. (c) Measured sortable silt (SSÞ results. (d) High‐resolution SS record based on XRF 5‐point smoothed Zr/Rb transformation (black line) compared with measured SS record (pink line) (see text for details). (e, f) Linear regressions between XRF Zr/Rb and SS used to obtain high‐resolution SS record. (g) Core PS97/093‐2 scalarflow speedfluctuations (cm/s) based on McCave et al. (2017) (blue) and Wu et al. (2019) (gray) equations. Gray bars indicate interglacial stages. Cyan bar indicates MIS 14.
the direct high‐resolution SS measurements obtained with the Sedigraph were used (Zr/Rb = 0.15 SS–1.09;
r2= 0.651,P≪0.001,n= 30) (Figure 4(e), (f)).
Based on the positive and significant correlation between SS data and Zr/Rb ratios, we calculated ACCflow speed on the transformed XRF core scanner‐derived Zr/Rb data into SS. Using the calibration of SS for the Scotia‐Weddell Sea region (SS = 0.59U + 12.23, McCave et al., 2017), the calculated current speed values of core PS97/093‐2 vary from 15 to 28 cm/s, with a Holocene average of approximately 22 cm/s (Figure 4g).
These values are rather high for a 3,800‐m‐deep current when compared to modern deep observations of ACCflow speeds of 10 to 20 cm/s in the vicinity of the SAF in the DP (Donohue et al., 2016; Renault et al., 2011). This difference between the estimated and measured modern values could be due to a deficit of coarser silt at the deeper sites of the calibration line, leading to afiner mean size for the same speed (McCave et al., 2017). However, this difference is smaller when using the most recent calibration of Wu et al. (2019; SS = 0.86U + 14.49), yielding values ranging from 8 to 17 cm/s, with a Holocene average of 12 cm/s (Figure 4g). Although the Wu et al. (2019) calibration might be biased by the fact that surface sedi- ment data (multicore samples) and bottom current data are not from exactly the same locations; the data were retrieved directly within the DP and thus close to our site. The McCave et al. (2017) calibration, on the other hand, uses records from the Scotia Sea downstream of the DP and at or south of the PF.
5.2. LGM to Holocene Changes in the DP Throughflow
Between the LGM (19–27 ka, sensu lato: Clark et al., 2009) and the Holocene, SS ranges from a minimum value of 21.4μm at ~26 ka to a maximum of 26.2μm in the uppermost part of the core (~4 kyr ago). The increase between the LGM mean value (23.1μm) and the Holocene mean value (25.5μm) is approximately 10%. A much larger LGM/Holocene difference is observed in all cores located in the northern part of the DP:
core MD07‐3128 at 1,032‐m water depth shows approximately 40% difference, core MR0806‐PC09 at 684‐m water depth with approximately 20% (Lamy et al., 2015), and core GC528 at 598 m indicates approximately 50% difference (Roberts et al., 2017) (Figure 5). We suggest that these strong increases compared to our core PS97/093‐2 might be related to (i) shallower depths of continental margin cores and stronger currents and/or (ii) a reestablishment of the SAF by general southward frontal movement between the LGM and the Holocene, as suggested by Roberts et al. (2017).
Furthermore, when comparing our LGM/Holocene SS record to other deep cores retrieved along a transect in the Scotia Sea (2,000‐to 4,323‐m water depth; McCave et al., 2014), we notice that the SS proxy for ACC throughflow is overall larger and more variable at the Pacific DP entrance (core PS97/093‐2, LGM mean 23.1μm and Holocene mean 25.5μm) than in the Scotia Sea (17.1 and 17.4μm, respectively). This difference could be explained by the latitudinal distribution of the core locations; all Scotia Sea cores stem from south of the PF (cf. Orsi et al., 1995), whereas core PS97/093‐2 is located in the Subantarctic Zone close to the SAF, where one half of the total modern DP throughflow transport occurs (Koenig et al., 2016; Well & Roether, 2003). Earlier reconstructions of bottom current speeds also based on the SS proxy show a 7–10% speed increase for the Holocene at core sites located in the vicinity of the PF and SACCF (McCave et al., 2014), whereas cores between these two oceanographic fronts show a slight increase for the LGM (2–5%;
Figure 5). With the exception of McCave's southernmost core, sites that were covered by the LGM summer sea ice extent (Collins et al., 2012) show a 1–5% Holocene increase in current strength (Figure 5).
Our record is consistent with the reduced current velocities of the ACC during the last glacial on the Chilean margin at the entrance of the DP (Lamy et al., 2015). Proxy reconstructions of the SWW belt in the southern Chilean margin show a decrease of the westerly winds during colder intervals (Kohfeld et al., 2013; Lamy et al., 2010). Therefore, our observed glacial reduction could be associated with a weakening and equator- ward shift of the SWW belt consistent with oceanographic observations and models that show that the strength of the ACC is related to the position and intensity of the SWW belt (Völker & Köhler, 2013).
In summary, the cores located at the Chilean‐Argentinian margin and in the vicinity of the SAF in the DP area show higherflow speeds during the Holocene than during the LGM in terms of absolute values and regardless of water depth, corroborating thefinding that more than one half of total DP transport takes place in the Subantarctic Zone. The higher Holoceneflow speeds are suggested to respond to changes in the strength of the subantarctic ACCflow (Roberts et al., 2017). The LGM‐Holocene change is greater in shal- lower cores but is still significant in deep cores that are near the ACC fronts.
5.3. Glacial‐Interglacial Changes in ACC Flow Strength
In contrast to the other available records from the DP region that only cover the last glacial and the Holocene, core PS97/093‐2 provides a longer, orbital‐scale perspective on the current dynamics that occur at the entrance of the DP gateway. Despite the importance of the ACC for the global climate system, its tem- poral variations are still largely unknown during glacial‐interglacial cycles in the Pleistocene. Apart from our study, only two other records extend beyond ~500 ka, one in the Indian sector (Mazaud et al., 2010) and a second record from the SW Pacific (Hall et al., 2001).
At the location of core PS97/093‐2, the mean SS is 25.3μm during interglacials and 23.9μm during glacials (Figure 4), indicating an overall mean average glacial/interglacial variability of 6% over the last ca. 1.3 Myr.
This difference is not very large, amounting to about 2 cm/s on the McCave et al. (2017) calibration. Because this value underestimates the major shifts during glacial terminations, we considered the difference between the SS minimum value of each preceding glacial and the maximum of the following interglacial (Lisiecki &
Raymo, 2005), resulting in a mean interglacial increase of approximately 16%.
The consistent pattern of higher bottom water current speeds during interglacials contrasts with the 500‐ka‐ long ACC record from the subantarctic Indian Southern Ocean sector that is based on variations in size and abundance of magnetic grains and suggests an intensified ACC during glacials (Mazaud et al., 2010).
However, caution in the interpretation of this record is advised since, in addition to current strengthfluctua- tions, variations in magnetic properties could also reflect changes in bacterial production, ice‐rafted debris input, and the source of the magnetic minerals (Channell et al., 2016). Stronger glacial near‐bottomflow speeds (inferred from elevated SSÞ attributed to enhanced ACC influence have also been reported for the southern Agulhas Plateau (core MD02‐2589 0–170 ka; Molyneux et al., 2007) and the western slope of the Agulhas Bank off South Africa (core MD96‐2080 0–350 ka; Martínez‐Méndez et al., 2008). On a longer time scale, SS data from ODP Site 1123 in the southwest Pacific indicate that the DWBC east of New Zealand intensified during glacials over the past 1.2 Ma (Hall et al., 2001). If we accept that (i) the changes in the abundance of magnetic grains studied by Mazaud et al. (2010) reflect current strengthfluctuations and, (ii) at ODP 1123, DWBC current strengthfluctuations would reflect strength fluctuations connected to Figure 5.Drake Passage throughflow change (in %) between the Holocene and the LGM. Yellow (blue) arrows denote Holocene increase (decrease) at PS97/093‐2, MD07‐3128 and MR0806‐PC09 (Lamy et al., 2015), GC528
(Roberts et al., 2017), and Scotia Sea core sites from McCave et al. (2014). White lines mark ACC modern fronts (Orsi et al., 1995): SAF, PF, SACCF, and SB as in Figure 1.
ACC changes (Carter & McCave, 1997), then both studies would support the traditional view of a faster ACC flow during glacials due to a general glacial intensification of atmospheric ocean circulation (Gersonde et al., 2005; Lynch‐Stieglitz et al., 2016; Toggweiler et al., 2006). Nevertheless, the interpretation of the DWBC is complex and most likely controlled by a combination of factors (see section 5.6)
Core PS97/093‐2 data show that this general intensification of the subantarctic ACC does not extend to the SE Pacific and the DP where current strength is overall enhanced during interglacials. We suggest that in the DP, the northward shift of fronts and particularly of the SAF (Roberts et al., 2017) accompanied by an expan- sion of sea ice during glacial times likely decreased the DP throughflow of ACC, thus weakening the cold water route into the Atlantic. This shortfall in the supply of deep water to the Atlantic basin through the DP during glacial times might be compensated by a strong recirculation within the South Pacific causing a stronger South Pacific Gyre (Lamy et al., 2015). Concomitantly, the recirculation in the South Atlantic/Indian Ocean sectors may have weakened through a reduced Agulhas leakage along the warm water route (Beal et al., 2011).
5.4. Marine Isotope Stage 11
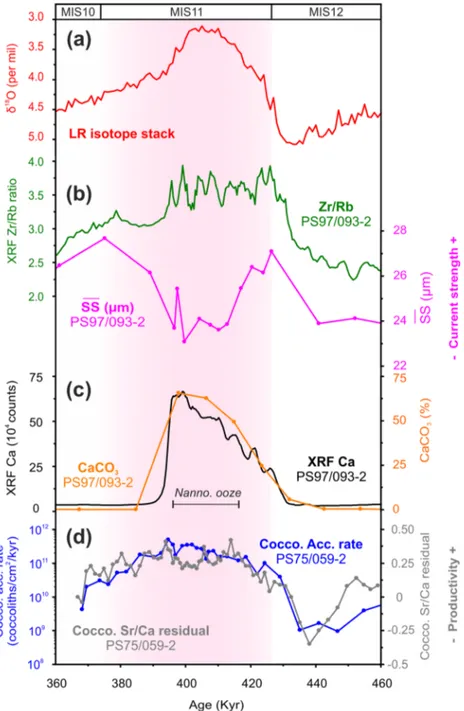
MIS 11 was an outstanding interglacial period in the Earth's Pleistocene climate history that was character- ized by longer and warmer interglacial conditions, 6–13 m higher sea level than that during the Holocene, and an unusual increase in carbonate production at high southern latitudes (e.g., Barker et al., 2006;
Droxler et al., 1999; Hearty et al., 1999; Hodell et al., 2000; Raymo & Mitrovica, 2012).
Unlike for most interglacials in core PS97/093‐2, where a consistent pattern of higher ACC strength emerges, the SS values during the peak MIS 11 show a different behavior (Figure 6). We observe an initial rise in SS during the MIS 12–11 transition (Termination V) followed by a decrease in the SS that continues until the MIS 11–10 transition, where there is a short increase again. The most likely explanation is that the high Zr/Rb values during MIS 11 reflect extraordinarily strong currents at the PS97/93 site and thus additional enhancement of the ACC during this warmest interglacial as discussed in section 5.1.
The timing of the low SS coincides with a 20‐cm‐thick nannofossil ooze in the core (Lamy, 2016) and matches the increase in coccolith accumulation rates during this time interval observed in the western and eastern flanks of the southern East Pacific Rise (Saavedra‐Pellitero, Baumann, Lamy, et al., 2017) (Figure 6). This increase was associated with a very high production of coccolithophores in the water column triggered by a poleward retreat of the Southern Ocean fronts and associated variations in the nutrient regime and higher than modern sea surface temperatures. Assuming that for MIS 11 the measurements obtained with the Sedigraph are indeed reflecting reduced current strength, an alternative explanation could be a response to an exceptional southward movement of the ACC fronts during this extreme warm interval leading to an increased distance of core PS97/093‐2 to the SAF and a respectiveflow speed reduction. Another alterna- tive explanation could be that the opening of a marine seaway between the Amundsen and the Weddell Sea caused by a significant ice loss of the West Antarctic ice sheet (Vaughan et al., 2011) possibly deviated part of the ACCflow into the Weddell Sea, reducing ACC throughflow in the DP area. Whether such a mechanism can be invoked for the exceptionally warm MIS 11 needs to be explored in future work.
5.5. Long‐Term Modulation of Orbital‐Scale ACC Variations Over the Past 1.3 Ma
Beyond glacial‐interglacial ACC variations, our 1.3‐Ma record allows to address the response and role of changes in the subantarctic ACC during major periods of global climate reorganizations when large atmosphere‐ocean‐ice and carbon cycle changes took place. Such is the case for the MPT (shift in ice‐volume cyclicity from the 41‐to 100‐kyr world) and the MBE (major climatic transition ca. 430 ka ago with amplified 100‐kyr cycles and warmer interglacials thereafter; Bouttes et al., 2018; Clark et al., 2006;
Holden et al., 2011).
Our SS record indicates that major shifts in amplitudes and pattern of ~41‐and ~100‐kyr cycles took place over both the MPT and the MBE (Figure 7). Overall, across the complete ~1.3‐Ma record, wefind a strong spectral coherence to the global benthic oxygen isotope stack in the ~41‐kyr band (Figures 7a and 7b).
These cycles dominate from 1.3 Ma to ~850 ka (MIS 21) and continued their influence thereafter (Figures 7c and 7d); this result largely agrees with that by Bajo et al. (2020), who found a strong influence of the obliquity on glacial terminations after the MPT. After MIS 21, the spectral power in the ~100‐kyr
band becomes stronger across the MPT, and after a few subdued cycles during MIS 12–14, ~100‐kyr cycles reappear after the MBE (Figures 7c–7e). There are two intervals (MIS 6–8 and MIS 12–14) during which the amplitudes of our SS record diminished strongly and show no correspondence with either the amplitudes in the LR04 stack (Figure 7b) or in Antarctic ice core records (Jouzel et al., 2007). The distinctly reduced sedimentation rates during these times (0.2–0.9 cm/kyr for MIS 6–8 and 0.5–0.9 cm/kyr for MIS 12–14; Figure 2) might be an indication of pronounced winnowing and subsequent bioturbation that could have reduced the glacial‐interglacial amplitudes in our record.
Figure 6.Marine isotope stage 11. (a) Evolution of the global ice volume (Lisiecki & Raymo, 2005). (b) Estimated changes in ACC strength based on the XRF Zr/Rb ratio and the SS record of core PS97/093‐2. (c) CaCO3content (orange) and XRF Ca scanner counts (black). (d) Coccolithophore paleoproductivity proxies of sediment core PS75/059‐2 (Saavedra‐Pellitero, Baumann, Ullermann, et al., 2017): Coccolith accumulation rate (blue; note log scale) and Coccolith Sr/Ca residuals using theGephyrocapsa oceanicacorrection (gray).
Neodymium isotopes have been used as a paleo‐ocean circulation proxy across the MPT in the South Atlantic (Farmer et al., 2019; Pena & Goldstein, 2014). Both studies hypothesize that the rise of the 100‐kyr ice age cycles was facilitated by enhanced deep‐ocean carbon storage associated with a weakened Atlantic MOC. Between MIS 25 and 21 (~950 to 860 ka), Pena and Goldstein (2014) documented a major dis- ruption of the MOC that seems to match with a reduced ACC strength at the entrance of the DP (seen as a strong diminution in the amplitude of the cycles in PS97/093‐2; Figure 7b). In our record, MIS 21 (ca. 850 ka) marks the emergence of thefirst high‐amplitude 100‐kyr glacial cycle. Pena and Goldstein (2014) also stated that the vigor of the Atlantic MOC pre‐and post‐MPT has remained similar during interglacials. However, based on the PS97/093‐2 record (Figure 7b), interglacials younger than 850 ka are characterized by some- what higher values compared to interglacials before the MPT. We suggest that higher interglacial SS values after the MPT could reflect a change in the southward position of the Southern Ocean fronts that may be associated with a stronger drawdown of nutrients and atmospheric CO2in the Southern Ocean (Robinson et al., 2019). The interglacial increase in values coincides with the observed rise in deep‐oceanδ13C values in the Southern Ocean, indicating an increase in the variability of deep water circulation that included well‐ventilated interglacials and poorly ventilated glacials (Venz & Hodell, 2002). Both changes were in uni- son with the amplified strength of the 100‐kyr cycle in ice volume change. In summary, the SS PS97/093‐2 Figure 7.Spectral analysis and comparison between the SS record of core PS97/093‐2 (green) and LR04 benthicδ18O stack (Lisiecki & Raymo, 2005) (red).
(a) Cross‐spectral analysis of high‐resolution SS record based on XRF Zr/Rb transformation of core PS97/093‐2 and the Lisiecki and Raymo stack. Coherency indicates the correlation between the pair of variables as a function of frequency; nonzero coherence is higher than 0.38 (red dashed line). Phase refers to the relationship of the pair of variables with the same frequency. If the phase is 180°, the two signals are out of phase with each other. (b) Evolution of the global ice volume during the last ~1.3 Ma (red); numbers indicate marine isotope stages (Lisiecki & Raymo, 2005), and estimated changes in ACC strength (green) are based on the SS record of PS97/093‐2. Vertical gray bars mark Lisiecki and Raymo interglacial stages. MBE, mid‐Brunhes event; MPT, mid‐Pleistocene transition.
B‐Tukey tests of the SS PS97/093‐2 record divided into three different time intervals: (c) the entire record, (d) from MIS 21 to the Holocene, and (e) from 1.3 Ma to MIS 21.
record reflects the documented major disruption in the MOC during the MPT (Pena & Goldstein, 2014). The higher SS values after the MPT could be caused by a change in the southward position of the Southern Ocean fronts and/or an increase in the variability of deep water circulation.
5.6. Comparing Deep Water Dynamics Across the South Pacific
The well‐dated high‐resolution sortable silt record from ODP Site 1123 documenting changes in strength of the DWBC off New Zealand back to ~1.2 Ma uniquely allows us to compare deep‐ocean circulation changes across the Pacific Southern Ocean.
Both the ACC and the DWBC are major components of the global MOC. The DWBC is constituted of CDW, similar to ACC water masses. As the ACC approaches the Pacific sector from the Indian Ocean, it passes around and through gaps in Macquarie Ridge and thenflows northeast along and around the eastern edge of the Campbell Plateau. In this region, the DWBC overlaps with the ACC and is strongly reinforced by the ACC, especially in the vicinity of the SAF that carries a mean transport of 90 Sv in this region (McCave et al., 2008). Thus, a strong coupling and positive reinforcement of the ACC and the DWBC occurs here.
At ~45°S, the ACC and the DWBC separate and the ACC diverges eastward into the open South Pacific (along the SAF). The DWBC continues toflow northward at depths between ~5,000 and ~2,000 m, across the Bounty Fan, around the eastern end of the Chatham Rise through the Valerie Passage, northwestward across the eastern boundary of the Hikurangi Plateau, andfinally northward toward the equator along the Tonga‐Kermadec Ridge (Carter et al., 2004; Leg 181 synthesis, McCave et al., 2008). Based on this mod- ern oceanographic setting, a mechanistic link between the main ACC and the DWBC is conceivable as the ACC presently reinforces the DWBC, suggesting the current strength in both systems could vary in parallel.
However, the direct comparison of our record to the sortable silt data set at ODP Site 1123 (Hall et al., 2001) at orbital time scales indicates the opposite, i.e., a glacial weakening of the ACC at our SE Pacific site and a strengthening of the DWBC off New Zealand (Figure 8). Furthermore, if we divide our record into three similar intervals of differing inferred meanflow speeds as done by Hall et al. (2001), wefind that relatively high (low) meanflows in the SW Pacific are correlated with relatively low (high) meanflows in the SE Pacific (Figure 8a).
B‐Tukey's test of the records of core PS97/093‐2 (this work) and Site ODP1123 (Hall et al., 2001) show high coherence and a phase close to 180° at the 41‐kyr frequency band (Figure 8b), providing evidence that cur- rent strengthfluctuations are out of phase between the eastern (core PS97/093‐2) and western (ODP1123) Pacific. However, at the 100‐kyr frequency, the spectral power of the PS97/093‐2 record is distributed in two small peaks (at ~110‐and 85‐kyr frequencies, respectively) that lead to an absence of a coherent peak at the 100‐kyr frequency in the PS97/093‐2 record (Figure 8b). This might be originated either by (i) the lack of a 100‐kyr peak during the“41‐kyr world”from 1.3 Ma to 850 ka (Figure 7d) or by (ii) a change in the spa- cing of the interglacial peak value during the last 800 kyr that could cause a shift in the 100‐kyr power band from ~110‐to 85‐kyr frequencies (Past Interglacial Working Group of PAGES, 2016). Therefore, we did not carry out the comparison at the 100‐kyr frequency between the PS97/093‐2 and ODP1123 records.
We suggest three different possible scenarios that could explain the disparity between both sides of the Pacific: (i) If we assume that our eastern record is representative for the Pacific ACC, following Hall et al. (2001) and the Leg 181 synthesis (Carter et al., 2004), the carbon isotope and sortable silt data at Site 1123 are consistent with greater DWBC flow, and therefore enhanced formation of AABW and greater Pacific ventilation, as a persistent feature of glacial periods over the past 1.2 Myr. In contrast, at the same time, the supply of deep water along the DP and into the Atlantic Ocean (via the CDW) was reduced during glacials. We speculate that these opposite changes in deep waterflow across the South Pacific reflect a separation of deep water masses and enhanced recirculation in the deep Pacific. Such enhanced glacial recir- culation coinciding with reduced DP transport is consistent with earlierfindings of stronger glacial recircu- lation of Subantarctic Surface Water into the South Pacific Gyre (Lamy et al., 2015) during the LGM.
Together with the glacial occurrence of the ~2,000‐m bathyal front in the Pacific (Herguera et al., 1992, 2010;
Keigwin & Lehman, 2015), this separation could have contributed to the isolation and aging of deep Pacific water masses, fostering enhanced glacial carbon storage (Ronge et al., 2016; Skinner et al., 2010). (ii) ACC changes in the SW Pacific are opposite to those recorded at our site at the entrance of the DP. This might indicate that the signal in the SW Pacific could be imported from the Indian sector were evidence for enhanced glacial ACC strength had been presented (Mazaud et al., 2010). This would imply an enhanced
southern Pacific gyre recirculation but would impose questions about a shortage in the Atlantic water budget. (iii) Our record indicates that glacial northward shifts of the SAF in the SE Pacific (though potentially restricted by the DP) are coupled with changes in the southern westerlies, and it would be plausible that the SAF likewise moved northward in the SW Pacific. This might move the strong reinforcement of the DWBC by the ACC presently occurring at ~45°S northward, i.e., closer to ODP Site 1123, where stronger bottom currents are recorded (Hall et al., 2001). Off New Zealand, the Campbell Plateau and Chatham Rise limited the shift of the SAF and particularlyfixed the Subtropical Front at the Chatham Rise, thus enhancing oceanographic gradients in this area. Further east in the SW Pacific basin, both fronts might have been located further to the north (Bostock et al., 2013). From this point of view, a glacial northward displacement of the SAF could have both increased bottom waterflow at ODP Site 1123 and reduced bottom waterflow at site PS97/093.
6. Conclusions
We present a new high‐resolution ACC strength record from the Subantarctic Zone of the Pacific entrance to the DP covering the last 1.3 Ma. An excellent correlation between measured SS data and XRF scanner‐derived Zr/Rb ratios in core PS97/093‐2 demonstrates that in this area the latter are a reliable bot- tom currentflow strength proxy. Our reconstruction shows consistently higher ACC speeds during intergla- cial times over the entire middle–late Pleistocene record.
Whereas shallower sites of the Chilean and Argentinian continental margins show a substantial 20–40% gla- cial reduction in ACC strength that was associated with a weakening of the cold water route, our data point to a smaller, but still significant (approximately 6% overall and 16% when considering major shifts), reduc- tion in deep circulation during glacial times.
Our estimated ACC strengthfluctuations upstream of the DP largely follow orbital‐scale variations of cli- mate and ice volume as expressed in the LR04 stack (Lisiecki & Raymo, 2005). The SS record of core PS97/093‐2 shows a dominance of the ~41‐kyr cycles from 1.3 Ma to ca. 850 ka (MIS 21), followed by an increase of the spectral power of ~100‐kyr cycles thereafter (from MIS 21 to the Holocene).
We hypothesize that the observed variations in strength are linked to the northward shift of Southern Ocean frontal systems during glacial times, potentially locating our site south of the strongest ACCflow in the vici- nity of the SAF. Therefore, our record most likely records both limited local northward shifts and changes in Figure 8.(a) Reconstructed changes in current strength during the past 1.3 Myr: at PS97/093 (green) and ODP 1123 (purple) sites. Vertical gray bars mark Lisiecki and Raymo interglacial stages. Numbers indicate some of the marine isotope stages (Lisiecki & Raymo, 2005). Horizontal dashed lines mark the mean SS values for the periods used by Hall et al. (2001) and the ones chosen for the core PS97/093‐2 record (MIS 1 to MIS 11, MIS 12 to MIS 21, MIS 22 to MIS 35 and MIS 1 to MIS 14, MIS 14 to MIS 21, MIS 22 to MIS 43, respectively). (b) Cross‐spectral analyses of SS results of core PS97/093‐2 (this study) and ODP1123 (Hall et al., 2001).
general ACCflow in the vicinity of the SAF. Together with an expected glacially extended sea ice zone and the geographic constriction of the DP, the reduced subantarctic ACCflow likely contributed to a glacial weakening of the total DP throughflow. This somewhat diminished inflow of CDW into the Atlantic through the DP could have affected the strength of the global MOC at time scales before the last glacial.
When comparing the SS record of our site PS97/093 (SE Pacific) with the one at ODP Site 1123 (SW Pacific), we found that a clear opposite trend is evident: The weakened supply of deep water along the DP and into the Atlantic Ocean during glacials corresponds to an enhancedflow of the SW Pacific DWBC. This might indi- cate that the signal in the SW Pacific could be imported from the Indian sector or that a northward migration of the SAF during glacials increased the bottom waterflow at ODP site 1123 and, at the same time, reduced bottom waterflow at site PS97/093.
Data Availability Statement
All data are available in PANGAEA repository: doi.pangaea.de/10.1594/PANGAEA.905998; doi.pangaea.
de/10.1594/PANGAEA.905996; doi.pangaea.de/10.1594/PANGAEA.905994.
References
Anthonissen, D. E., & Ogg, J. G. (2012). Cenozoic and Cretaceous biochronology of planktonic foraminifera and calcareous nannofossils. In F. M. Gradstein, J. G. Ogg, M. D. Schmitz, & G. M. Ogg (Eds.),The Geologic Time Scale 2012(Vol. 1, pp. 1083–1127). Oxford: Elsevier.
https://doi.org/10.1016/b978-0-444-59425-9.15003-6
Bajo, P., Drysdale, R. N., Woodhead, J. D., Hellstrom, J. C., Hodell, D., Ferretti, P., et al. (2020). Persistent influence of obliquity on ice age terminations since the middle Pleistocene transition.Science,367(6483), 1235–1239. https://doi.org/10.1126/science.aaw1114 Barker, P. F. (2001). Scotia Sea regional tectonic evolution: Implications for mantleflow and palaeocirculation.Earth‐Science Reviews,55,
1–39. https://doi.org/10.1016/S0012-8252(01)00055-1
Barker, P. F., & Burrell, J. (1977). The opening of Drake Passage.Marine Geology,25, 15–34.
Barker, S., Archer, D., Booth, L., Elderfield, H., Henderiks, J., & Rickaby, R. E. M. (2006). Globally increased pelagic carbonate production during the Mid‐Brunhes dissolution interval and the CO2paradox of MIS 11.Quaternary Science Reviews,25(23–24), 3278–3293. https://
doi.org/10.1016/j.quascirev.2006.07.018
Beal, L. M., De Ruijter, W. P. M., Biastoch, A., Zahn, R., & SCOR/WCRP/IAPSO Working Group 136 (2011). On the role of the Agulhas system in ocean circulation and climate.Nature,472(7344), 429–436. https://doi.org/10.1038/nature09983
Bianchi, G. G., Hall, I. R., McCave, I. N., & Joseph, L. (1999). Measurement of the sortable silt current speed proxy using the Sedigraph 5100 and Coulter Multisizer Ile: Precision and accuracy.Sedimentology,46, 1001–1014. https://doi.org/10.1046/j.1365-3091.1999.00256.x Bohoyo, F., Larter, R. D., Galindo‐Zaldívar, J., Leat, P. T., Maldonado, A., Tate, A. J., et al. (2019). Morphological and geological features of
Drake Passage, Antarctica, from a new digital bathymetric model.Journal of Maps,15(2), 49–59. https://doi.org/10.1080/
17445647.2018.1543618
Bostock, H. C., Barrows, T. T., Carter, L., Chase, Z., Cortese, G., Dunbar, G. B., et al. (2013). A review of the Australian‐New Zealand sector of the Southern Ocean over the last 30ka (Aus‐INTIMATE project).Quaternary Science Reviews,74, 35–57. https://doi.org/10.1016/
j.quascirev.2012.07.018
Bouttes, N., Swingedouw, D., Roche, D. M., Sanchez‐Goni, M. F., & Crosta, X. (2018). Response of the carbon cycle in an intermediate complexity model to the different climate configurations of the last nine interglacials.Climate of the Past,14(2), 239–253. https://doi.org/
10.5194/cp-14-239-2018
Carter, L., & McCave, I. N. (1997). The sedimentary regime beneath the deep western boundary current inflow to the southwest Pacific Ocean.Journal of Sedimentary Research, Section B: Stratigraphy and Global Studies,67(6), 1005–1017. https://doi.org/10.1306/d42686b2- 2b26-11d7-8648000102c1865d
Carter, L., McCave, I. N., & Williams, M. J. M. (2008). Chapter 4 Circulation and water masses of the Southern Ocean: A review. In F. Florindo, & M. Siegert (Eds.),Developments in Earth and Environmental Sciences(Vol. 8, pp. 85–114). Amsterdam: Elsevier B.V.
https://doi.org/10.1016/S1571-9197(08)00004-9
Carter, R. M., McCave, I. N., & Carter, L. (2004). Leg 181 synthesis: Fronts,flows, drifts, volcanoes, and the evolution of the southwestern gateway to the Pacific Ocean, eastern New Zealand. In C. Richter (Ed.),Proc. ODP, Sci. Results(Vol. 181, pp. 1–111). College Station, TX:
ocean drilling program. https://doi.org/10.2973/odp.proc.sr.181.210.2004
Chalk, T. B., Hain, M. P., Foster, G. L., Rohling, E. J., Sexton, P. F., Badger, M. P. S., et al. (2017). Causes of ice age intensification across the mid‐Pleistocene transition.Proceedings of the National Academy of Sciences,114(50), 13,114–13,119. https://doi.org/10.1073/
pnas.1702143114
Channell, J. E. T., Harrison, R. J., Lascu, I., McCave, I. N., Hibbert, F. D., & Austin, W. E. (2016). Magnetic record of deglaciation using FORC‐PCA, sortable‐silt grain size, and magnetic excursion at 26 ka, from the Rockall Trough (NE Atlantic).Geochemistry, Geophysics, Geosystems,17, 4517–4533. https://doi.org/10.1002/2015GC006171
Clark, P. U., Archer, D., Pollard, D., Blum, J. D., Rial, J. A., Brovkin, V., et al. (2006). The middle Pleistocene transition: Characteristics, mechanisms, and implications for long‐term changes in atmospheric pCO2.Quaternary Science Reviews,25(23–24), 3150–3184. https://
doi.org/10.1016/j.quascirev.2006.07.008
Clark, P. U., Dyke, A. S., Shakun, J. D., Carlson, A. E., Clark, J., Wohlfarth, B., et al. (2009). The Last Glacial Maximum.Science,325(5941), 710–714. https://doi.org/10.1126/science.1172873
Collins, L. G., Pike, J., Allen, C. S., & Hodgson, D. A. (2012). High‐resolution reconstruction of southwest Atlantic sea‐ice and its role in the carbon cycle during marine isotope stages 3 and 2.Paleoceanography,27, PA3217. https://doi.org/10.1029/2011PA002264
Donohue, K. A., Tracey, K. L., Watts, D. R., Chidichimo, M. P., & Chereskin, T. K. (2016). Mean Antarctic Circumpolar Current transport measured in Drake Passage.Geophysical Research Letters,43, 11,760–11,767. https://doi.org/10.1002/2016GL070319
Acknowledgments This work was funded by AWI Helmholtz‐Zentrum für Polar‐und Meeresforschung. Additional support was provided by the Chilean oceanographic centers
FONDAP‐IDEAL (project 1500003) and COPAS Sur‐Austral (project AFB170006 to C. B. L. and M. H. T.) and the Deutsche Forschungsgemeinschaft (DFG project BA 1648/30‐1 to M. S‐P).
M. H. T. acknowledges support from scholarship CONICYT‐PCHA/
Doctorado Nacional/2016‐21160454.
We thank Dr. David Wilson and two anonymous reviewers for their comments and suggestions that helped improve the revised version of this manuscript. We wish to thank the captain, crew, and scientific party of R/VPolarsternfor a successful PS97 cruise. We acknowledge S. Wiebe, R. Fröhlking, and V. Schumacher for technical support at AWI. We also thank M. Wengler, L. Dumm, S. Wu, and G. Kuhn for fruitful discussions during the development of this work.