From us the customer gets all of the services in a plant lifecycle: from engineering to erection of turnkey plants as well as the construction of single lots and also the full range of an After Sales Service.
Over 1.600 reference plants worldwide and more than 150 years of company history stand testament to this
expertise.
Energy from Waste Flue Gas Cleaning After Sales Service
Steinmüller Babcock Environment GmbH Fabrikstraße 1 · 51643 Gummersbach / Germany Phone: +49 (0) 2261 85-0 · Fax: +49 (0) 2261 85-3309
info@steinmueller-babcock.com · www.steinmueller-babcock.com
WE MAKE THE WORLD A CLEANER PLACE
Waste Incineration
Optimization of Plant Operation by Means of Technical Service
Michael Mück
1. Situation of Waste-to-Energy plants in Europe and worldwide ... 178
2. Status of the plants ... 179
3. Involved partners ... 180
4. Education, tools and structure ... 181
5. Steps for improvement ... 182
6. Customer satisfaction and expectations ... 184
7. Examples of realised projects and partnerships with plant operators ... 184
7.1. Example I: A plant in Italy (3 x 113.3 MWth) ... 184
7.2. Example II: A plant in Northern Germany (2 x 22 MWth) ... 189
7.3. Example III: A plant in Eastern Germany (1 x 114 MWth) ... 190
7.4. Example IV: A plant in Western Germany (1 x 76.4 MWth) ... 192
7.5. Example V: A plant in Western Germany (1 x 35 MWth, 3 x 40 MWth, 2 x 45 MWth) ... 194
7.6. Example VI: A plant in the Netherlands (2 x 60 MWth) ... 194
7.7. Example VII: A plant in Finland (1 x 53 MWth, 1 x 36 MW) ... 196
7.8. Example VIII: A plant in Western Germany (1 x 33 MWth, 1x 18 MWth, 1 x 6 MWth, 1 x 3,5 MWth) ... 196
7.9. Example IX: A plant in Western Germany (2 x 27 MW, 1 x 36 MW) ... 197
7.10. Example X: A plant in Western Germany (90 MWth) ... 198
8. Summary and outlook ... 199
9. Literature ... 199
Waste Incineration
1. Situation of Waste-to-Energy plants in Europe and worldwide
The worldwide Waste-to-Energy-Market is still on a high level was a keynote mentioned by EUWID in an article from 23.11.2016 [4]. And it is still in this way. In 2015 and 2016 128 plants started their operation, mainly in Asia. At the end of 2015 worldwide 2150 units are in operation with a capacity of 300,000,000 t/year.
Since 2010 the additional capacity increased about 12,000,000 t/year, only in China.
Other parts of the world, for example Europa, added only a capacity of about 2,000,000 to 3,000,000 t/year. In the boom-years between 2008 and 2010 it was more than 4,000,000 t/year. But after a silent period the market in Europe started to create some new projects in the last years and now starts to come back to life slowly.
The focus of this article is not as much on new plants, it is rather giving a look to the possibilities of optimization and development of existing plants.
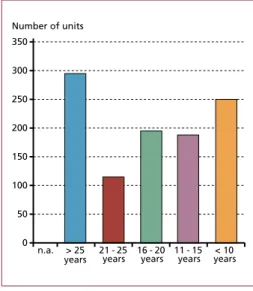
Please remember: 2150 plants are in operation and the average age is between 18 and 26 years, which is as well shown in the following diagram (Figure 1).
Figure 1: Average age of plants in Asia, Cen- tral Europe and North America
Sources:
ecoprog GmbH: Market Study Waste to Energy 2016/2017 International Solid Waste Association: ISWA Report 2015 International Solid Waste Association: Waste-to-Energy State-of-the-Art-Report Statistics 6th Edition; Revision November 2013
More than 300 units are in an age older than 25 years.
Europe Asia
2 4 6 8 10 12 14 16 18 20 22 24 26 28 30 Age years
North America
0 n.a. > 25
years 21 - 25 16 - 20 11 - 15 < 10 350
300 250 200 150 100 50
Number of units
0
years years years years
Figure 2: Number of units related to the age of the plant in Central Europe
Sources:
ecoprog GmbH: Market Study Waste to Energy 2016/2017 International Solid Waste Association: ISWA Report 2015 International Solid Waste Association: Waste-to-Energy State-of-the-Art-Report Statistics 6th Edition; Revision November 2013
The average age is country-specific and depends, inter alia, on political and envi- ronmental decisions.
Waste Incineration Figure 3: Average age of the boilers in Central Europe
Sources:
ecoprog GmbH: Market Study Waste to Energy 2016/2017 International Solid Waste Association: ISWA Report 2015
International Solid Waste Association: Waste-to-Energy State-of-the-Art-Report Statistics 6th Edition; Revision November 2013
Like in every industry, changes are taking place, environmental directives are tightened, the waste quality and amount changes, as well as the challenges are changing. The result:
most of the plants are not operated in the way they are designed for.
2. Status of the plants
Usually when a plant is built, it fulfils the current environmental requirements. It cor- responds to the state of technology at that time with improved and latest technologies.
But we should not forget: high price pressure and the marked situation lead to the fact, that new built plants are created under a high economical pressure and the given environmental and economic framework conditions [1, 6].
After the first years of operation the existing experience and change in boundary conditions cause more or less continues modification of the most plants [2, 9, 10, 11].
In our industry, it is like Rudolf von Bennigsen-Foerder, a German top manager and chairman of Veba AG stated: Stagnation means regression.
Following this statement, it has to be the goal of every plant operator to create a mecha- nism of continues development, optimization and modernization. But unfortunately, plant staff usually suffer as well under economical pressure, so that often the time is just
2 4 6 8 10 12 14 16 18 20 22 24 26
United Kingdom
Spai n
Germany Norway Switzerland
Italy Austri
a
Sweden Belgium Netherlands
Franc e
Denmar k 28
30
0
Average age of boiler years
Waste Incineration
calculated to operate the plant and to do small repair works. Large evaluation of the processes and the development of ideas are often not possible in the necessary depth.
But not only the time for developing single components is missing, there is as well a leck of experience e.g. from other plants. Of course, single solutions can be discussed with suppliers or individual solutions can be created like e.g. in the case of cladding in the radiation passes. But is this the right solution for an overall view to the plant?
3. Involved partners
Let us have a rough look to the benefits of each party involved in the optimization process of a plant:
The main players are:
• Operational personal of the plant: Operators as well as maintenance staff have a very detailed knowledge about the behaviour of the plant. They know the bottle necks and specific themes like waste supplier, development of specific values, fouling behaviour and corrosion risk [10, 12].
• Supplier/Producer: Supplier and producer have a detailed knowledge about the sin- gle components, its fabrication and the background of different applications [6].
• Specialists: Often specialists are used to evaluate specific topics like corrosion be- haviour, emission values, residence time, etc. [5, 6, 13].
• Maintenance companies: For revision and repair work maintenance companies are specialized in realizing the work in short time to reduce outage time.
Solution
Plant operator
• Detailed knowledge about the plant
Spezialists
• Specific knowledge and tools in detailed questions
Plant Supplier
• Specific knowledge about core componets
• Experiance
• Tools
Figure 4:
Synergy model for optimized revamping project
Waste Incineration
• Plant engineering company: Based on the specific knowledge of the core components of a plant they are also familiar with ancillary facilities, planning, engineering, layout, procurement assembly works and commissioning. They have mostly gain a lot of experience about realised plants and solutions [11].
In addition to the shown main players there are some more possible participants like consultants, central staff offices and others.
An optimized synergy model depending on the project could create a connection bet- ween the players and enhancing the strength of all to realise best synergies and success.
4. Education, tools and structure
Well educated employees and a long-term experience is the right approach to realize successful optimization projects. The view to the whole picture and to look behind the plate is the next requirement, a partner should fulfil. The willingness and strength to develop new ideas and solutions are the next essential prerequisite to reach the goal.
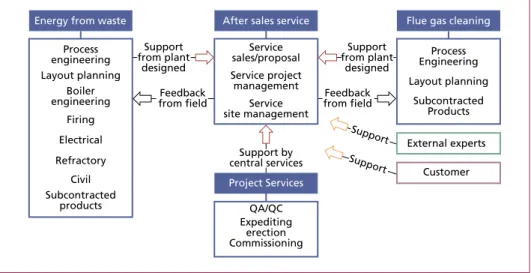
To create a high efficient service project, it is important to have a slim structure. Due to the wide range of different projects a large number of experts is needed. A possible solution is a core team responsible to organize and lead the project. Whenever necessary the different experts support the project. As well external specialists and local companies can be included in the team, to work out the best solutions for and with the customer.
Energy from waste Process engineering
Support from plant
designed
Support by central services
Support from plant
designed Feedback
from field Feedback
from field Boiler
engineering Layout planning
Firing Electrical Refractory
Civil Subcontracted
products
After sales service Flue gas cleaning Process Engineering Layout planning
Subcontracted Products External experts
Customer Project Services
QA/QC Expediting
erection Commissioning
Service sales/proposal Service project management
Service site management
Suppor t Suppor t
Figure 5: Synergy effects by basic structure of service activities
Source: Mück, M.: Umbau von Abfallverbrennungsanlagen -Beispiele aus der jüngsten Vergangenheit- In: Thomé-Kozmiensky, K.J.; Beckmann, M. (Hrsg.): Energie aus Abfall Band 11. Neuruppin: TK Verlag Karl Thomé-Kozmiensky, 2014, S.17-53
The benefit of this structure like shown in the figure above, is the feedback and ex- perience from the plants for developing better solutions and the implementation of continues development.
Waste Incineration
But not only process engineering and design work is necessary, the evaluation of the current situation as well as possible reasons for optimization are a second important basis for developing solutions. The following tools are the second part of evaluation the basis and checking the success of optimisation steps:
• Analysis of process data,
• Temperature measurement in flue gas path,
• Thermal recalculation,
• Laser scan and layout planning,
• CFD analysis,
• Anchor load measurement,
• Analysis of vibrations and bearings,
• Thermographic analysis,
• Endoscopy analysis.
Figure 6:
Necessary tools for optimized service projects
5. Steps for improvement
To realise a successful project, it is basically important to do the right steps at the right time.
Make sure that you follow the guidance and find answers:
• What are the needs, what is the status?
• What is the goal, the necessaries, the costs and the benefit?
• Develop a concept and evaluate the costs and the benefit
• In which way can you manage the interplay of experiences, goals and tools?
Waste Incineration
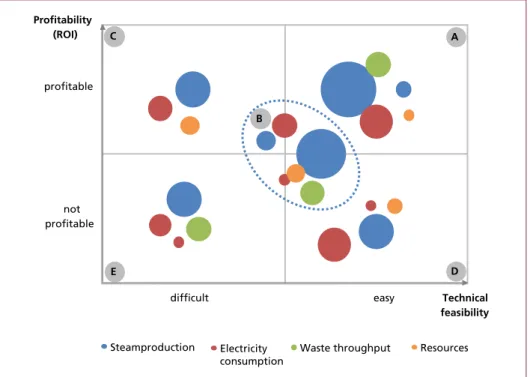
Figure 7: Priority model to evaluate realistic and profitable optimization projects
In a practical way, this means to start a project in the first step with a basic analysis of the current plant situation. The mentioned synergy effects become an important mea- ning. All involved partners can bring in their experience and knowledge to develop ideas and solutions. Based on this analysis optimization concepts are created and a cost and time frame evaluation takes place, as well a analysis of the return of invest. Now a priority list of projects can be created.
Profitability (ROI)
profitable
not profitable
difficult easy Technical
feasibility C A
E D
B
Steamproduction Electricity consumption
Waste throughput Resources
Benefit related to start of project Energy consumption related to start of project Benefit / Energy consumption
Time
Analysis
generationIdea
Evaluation Implementation
Sustainability
Figure 8: Life cycle model for optimized revamping projects
Waste Incineration
Figure 7 shows a priority model to evaluate the most realistic and profitable projects (A, B, C).
After pointing out the projects the second step is a detailed engineering. The goal is to specify the scope in such a particularly way, that material and components can be ordered. Dismantling and erection is the next step, commissioning finalizes the project.
To find optimized results the life cycle model shows the main idea for optimized re- vamping projects. After the first commissioning, the optimization takes place as long as a continues result is reached.
6. Customer satisfaction and expectations
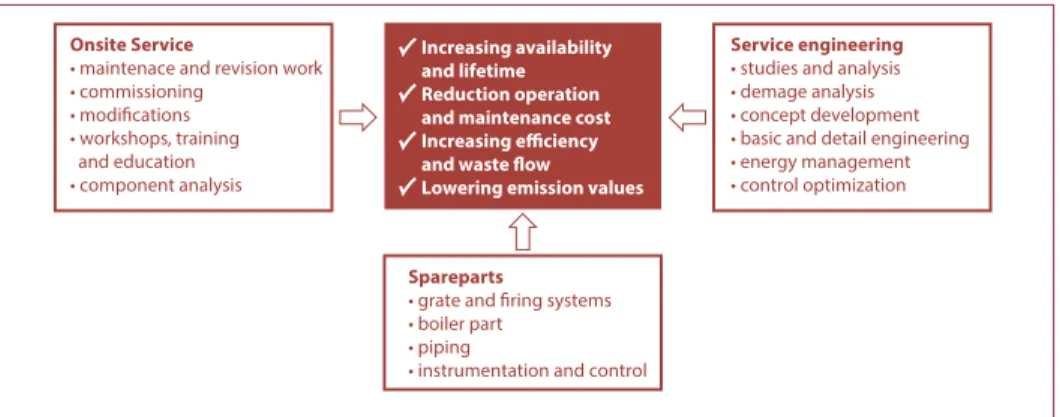
To fulfil the expectations of the customer it is necessary to have a weight service port- folio managed by a core service team.
To underline all these theoretical ideas in the following chapter a number of plants are shown where a long-term partnership is the basis for the technical support in different optimization projects, rom basic studies up to the realisation on site.
Onsite Service
• maintenace and revision work
• commissioning
• modifications
• workshops, training and education
• component analysis
Spareparts
• grate and firing systems
• boiler part
• piping
• instrumentation and control
Service engineering
• studies and analysis
• demage analysis
• concept development
• basic and detail engineering
• energy management
• control optimization Increasing availability
and lifetime Reduction operation and maintenance cost Increasing efficiency and waste flow Lowering emission values
Figure 9: Service portfolio and expectations of a cooperative partnership
7. Examples of realised projects and partnerships with plant operators
7.1. Example I: A plant in Italy (3 x 113.3 MW
th)
Plant designed for RDF, high heat value, steam parameter chosen because of financial benefit for high efficiency. Changes in the meantime:
• Waste quality (LHV decrease),
• Slag amount increases,
• Corrosion risk increases,
Waste Incineration
• Fouling behaviour increases,
• Residence time change by waste quality and modificated refractory,
• Due point problems in the bag house filter,
• Vibration problems with fans,
• Noise problems in air preheater.
Based on a long-term agreement for engineering support a large number of single optimization projects over a five years period was started.
a) Caused by the change of the fuel and its quality a number of modifications have been realised in cooperation with operating experienced staff and the plant supplier.
The combustion control was adapted to the changed waste quality to realise a stable combustion, steam flow and burn out quality.
b) The deslagger was medicated to become able to handle the much higher amount of slag in the household waste instead of the low amount in RDF.
c) The changed waste quality leads in combination with the high steam parameter to an unexpected high corrosion rate. Together with experts for analysing the corrosion behaviour and its mechanism, a concept was developed to protect the affected areas by cladding and refractory to increase live time and reduce maintenance costs.
d) To improve the drying phase of the waste and stabilize the burn out quality a steam supported air preheater was retrofitted.
e) The modified heat value of the fuel in combination with the optimized combusti- on control and the changed wall protection caused changes in the residence time.
Together with experts from a measuring institute, the support from a university and the experience of operator and supplier, the calculated characteristics where evaluated and adapted.
f) Vibration in fans and noise problems in the air preheater where analysed with spe- cial tools, verified with theoretical calculations and concepts to solve these matters where developed and realised.
g) Caused by different circumstances due point problems in parts of the flue gas system could be solved by a thermographic scan to locate damages in the insulation.
h) Mainly influenced by the waste quality and the need for realising the superheater in a high temperature area, the higher corrosion risk leads to high maintenance costs.
With a detailed analysis of the process data, a recalculation of the boiler, combined with ideas of the plant staff a modified superheater concept was developed and realised by a local supplier.
i) Is the combustion system able to fulfil requirements by lower heat values and higher waste flow? To underline this an analysis of the current situation and ash quality was done.
j) To update the operator manual all realized changes where updated.
Waste Incineration
k) Mistakes in the calculation of the drum level where analyzed and a revised calcu- lation was implemented.
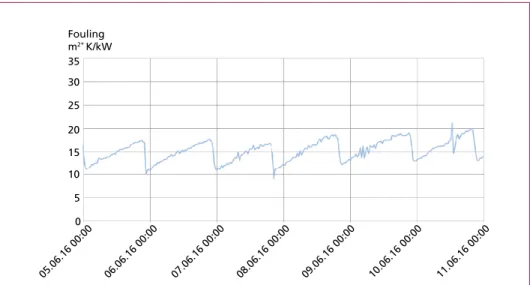
l) Monitoring tool: To calculate the efficiency of different heat surface parts of the boiler and a more aimed use of the soot blower a monitoring system was created (Figure 10 and 11).
Plant analysis actual situation / operating status / historical development
process data
and trends calculated values
additional measurements
visualisation of process
current methods advanced methods
Optimised process and maintenance concept
Figure 10: Principle structure of advanced monitoring tool
Source: Beckmann, M.; Pohl, M.; Spiegel, W.; Widder, T.: Wirtschaftliche Potentiale des Anlagen-Monitorings. In: Thomé- Kozmiensky, K.J.; Beckmann, M. (Hrsg.): Energie aus Abfall, Band 12. Neuruppin: TK Verlag Karl Thomé-Kozmiensky, 2015, S.55-69
35 Fouling m2* K/kW
05.06.16 00:00 06.06.16 00:00 07.06.16 00:00 08.06.16 00:0 0
09.06.16 00:00 10.06.16 00:00 11.06.16 00:00 0
5 10 15 20 25 30
062.332K901 Calculated fouling factor economizer m2* K/kW
Figure 11: Example: Calculation of fouling value for the economizer
Understanding and Improving
Thermochemical Processes
HOK
®.
Activated lignite. Flue gas adsorbent and catalyst. First choice for gas cleaning in refuse and special waste incineration and metallurgical processes.Substantial reduction of dioxins and furans.
Sometimes, a single, well-considered decision is all it takes:
for the benefit of your company, for the good of the environment.
THE HOK SOLUTION
- Solution for waste gas treatment -
®
MIR
Waste Incineration
7.2. Example II: A plant in Northern Germany (2 x 22 MW
th)
The technical support phase started with a basic analysis of the current situation of the plant. This analysis was supported by specialist for checking all relevant measurements and the flue gas distribution in the first pass. An evaluation of all mass- and energy flows as well as recalculation of the boiler and flue gas cleaning was the basis for the development of several projects.
a) How much refractory is necessary?
b) Increasing of plant efficiency by saving primary fuel for flue gas reheating, support by a consulting company to create an idea. The influence on the boilers and its temperature and heat balance was evaluated in a pre-study. In a second step, the reheating of the flue gas by gas burners was changed into a drum steam supported heat exchanger.
c) Optimizing process by constant thermal load to increase waste throughput and reducing thermals peaks, by implementation of an optimized combustion control.
d) Change in fuel quality leads to fouling problems in the first pass, reduced live time of refractory and grate. Development of measures to reduce thermal stress.
e) Increasing efficiency of power units lead to a reduced electrical consumption. But what is the return of invest? To evaluate this mater, all large consumers where che- cked and a list of sense full optimization matters was created.
f) Flue gas condensation and reuse of heat out of the flue gas system can achieve a big step forward according the efficiency of the plant. Pointing out possibilities with focus on the function of the complex flue gas cleaning system was goal of a realised evaluation study.
535 530 520 510 500 T (K)
495 Heat distribution
before DaGaVo (z = 20m)
Figure 12:
Support of concept development by CFD study
Waste Incineration
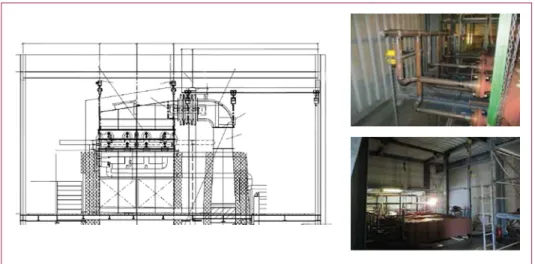
Figure 13: Erecting of steam supported heat exchanger upstream DeNOx reactor
2 sec – level at 23 t/h
2 sec – level at 18.4 t/h Area > 26.25 m:
optional cladding instead of refractory
Former end of refractory +28.305 m
Cladding – protection about 27.4 m ² Future end of refractory +26.25 m
Area air ventilated tials
5.515 6.0 6.5 7.0 7.5 8.0 8.5 9.5 9.0
16 17 18 19 20 21
Steam production t/h Height 2 seconds-level above last air supply m
Line 4 Line 5 Linear Line 5
22 23 24 25 26
Linear Line 4 Linear Line 4/5
Figure 14: Detailed analysis of necessary refractory surface and influence to the residence time
7.3. Example III: A plant in Eastern Germany (1 x 114 MW
th)
After the first wave of plants were built for RDF combined with high steam parameter and efficiency some years of operation was needed to point out the real operating con- ditions. Falling electrical revenues and high maintenance costs caused by the special fuel lead to a rethinking. This was the start for a long-term partnership to analyse the different challenges, to develop ideas and concepts and to realize it.
Waste Incineration
a) Waste to Energy plants are dependent on the available fuel and its costs or revenues.
On the other hand, different fuels are design relevant. To enlarge the spectrum of fuel it was necessary to evaluate the influence of the fuel to the combustion system, the boiler and the flue gas treatment. Based on this evaluation the possible limits related to the fuel inside the existing design where pointed out.
b) Lower heat values and higher water content lead to the necessity of preheated pri- mary air. A concept to integrate an air preheater in the existing primary air system as well as in the steam and condensate system was developed in close adjustment with the customer. This system is prepared for realisation.
c) Due to the condition of the flue gas in combination with the high parameter conti- nuously different analysis and evaluation have been done in a partnership between specialists for corrosion analysis, operator and SBENG. The goal was to evaluate the dependencies and possibilities to reduce corrosion risk by using the available technologies according to:
• refractory
• protecting layers and material (e.g. cladding)
• modification in the superheater flow
d) To reduce the gap between grate and boiler a new concept was developed, that reduces the thermal and mechanical stress for the compensator.
e) The reduction of NOx emissions is a goal to achieve future emission levels. The first step in partnership with the operator and by running several tests, was to evaluate possibilities and limits in the combustion system. Temperature level, temperature gradient as well as temperature distribution where the main focus and basis for further steps. The selection of the right technology and the development of an op- timized functional description was the second step. And finally, the concepts were installed and successful commissioned.
f) The availability of the plant, its safety and finally the cost for insurance policies are the driver to develop a new emergency power concept.
All this steps where supported by measurements, analysis of process data and thermal calculations.
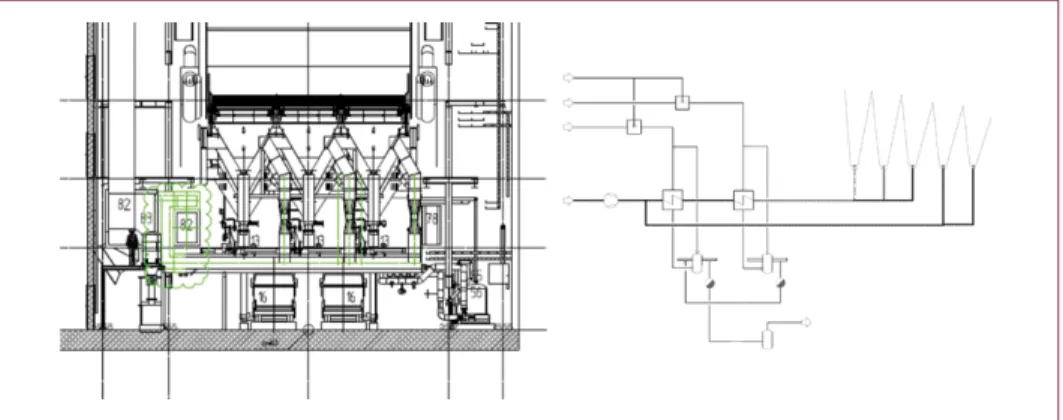
Figure 15: Air preheater concept
Waste Incineration
7.4. Example IV: A plant in Western Germany (1 x 76.4 MW
th)
Plant with roller grate technologies are designed for a small range of heat value chan- ges. Changes on the waste marked led to increased heat values and as a consequence to higher thermal stress for the refractory in the combustion chamber. An increase in maintenance costs was the result.
a) Based on operation and maintenance experience a new refractory concept conside- ring the as built thermal calculation as well as the new concept and its consequences according the temperature distribution, wall temperature and residence time was realized in the annual revision.
b) A clear structure in combustion control with the view to load stabilization and fire position is the next step to optimize thermal stress for the combustion chamber and its components and the boiler itself. In the meantime, this measure is successful realized.
Alumina-rich fire concrete mainly as a spraycast mass processed with > 70 % Al2O3 content AGT* > 1,600 °C Thickness 50 mm over pipe crest
Cladding of the combustion chamber facing side. Underlap
of the refractory connection areas min 50 mm
Lining of the entire enclosing wall sections of the inclined section with free-standing fire- retardant concrete on the basis of SiC, content
> 60 %, thickness 50 mm over the apex of the pipe
Fireproof protective cover as a strip-shaped mirror in the area of the wider webs (floor expansion for nozzle averages) Recommendation: SiC 85 lubrication/
spraying compound thickness about 30 mm
Cladding
To distributors and sub-areas of the outgoing pipes already available
Alumina-rich fire concrete mainly as a Free-flowing mass processed with
> 70 % Al2O3 content AGT*
> 1,600 °C Thickness 50 mm over pipe crest
Coating of the grate cooling-tube pipes with free-flowing fire concrete on the basis of SiC, content > 60 % Thickness 50 mm over the pipe crest (alternatively, this cooling belt can be run cladded)
Figure 16:
New developed refractory concept
c) By operating the plant in island-mode different circumstances caused a malfunction of a turbine and subsequently a loss of other turbines and blackout of the plant.
All available process data where analysed and recalculated in models. A concept to solve the problem was developed.
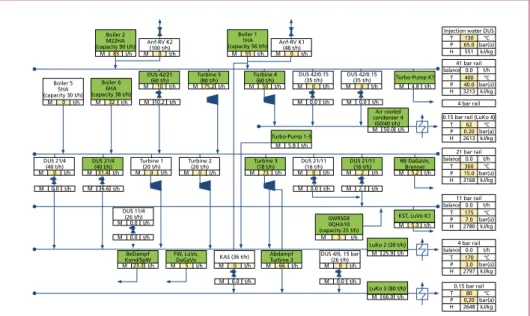
Waste Incineration Figure 17: Balance of the complete water steam cycle
Boiler 2 M22HA (capacity 90 t/h)
M 85 t/h M
Anf-RV K2 (100 t/h) 0 t/h
M DUS 42/21
(60 t/h) 10 t/h
M DUS 21/4
(40 t/h)
0 t/h M
DUS 21/4 (40 t/h)
31.4 t/h M
DUS 21/11 (16 t/h)
0 t/h
M DUS 11/4
(26 t/h) 0.0 t/h
M BeDampf Kond/SpW
23.3 t/h M FW, LuVo,
DaGaVo
5 t/h M
KAS (36 t/h)
0 t/h M
Abdampf Turbine 3
66 t/h M
DUS 4/0, 15 bar (26 t/h)
0 t/h M 0.0 t/h M 0.0 t/h
M DUS 21/11
(16 t/h)
2 t/h M
RB DaGaVo, Brenner
5.2 t/h
M GWRSDE 0QHA10 (capacity 25 t/h)
LuKo 2 (30 t/h) KST, LuVo K1
3 t/h M 25.9 t/h
LuKo 3 (80 t/h) M 66.0 t/h
M 5.3 t/h M
Turbine 1 (20 t/h)
0 t/h M
Turbine 2 (20 t/h)
0 t/h M
Turbine 3 (78 t/h)
73 t/h M
Turbine 5 (80 t/h)
75.2 t/h M
Turbine 4 (60 t/h)
50 t/h M
Turbo-Pump K1 4.8 t/h
M Turbo-Pump 1-3
5.8 t/h
M Air cooled condenser 4 (60/40 t/h) 50.0 t/h M
DUS 42/0.15 (35 t/h)
0 t/h
M 0.0 t/h M 0.0 t/h
M 0.0 t/h M 36.6 t/h M 0.0 t/h M 2.3 t/h
M 0.0 t/h M 10.2 t/h
M DUS 42/0.15
(35 t/h) 0 t/h M
Anf-RV K1 (48 t/h)
Injection water DUS
41 bar rail
0.15 bar rail (LuKo 4) 4 bar rail T P H
T P H
130 65.0 551
400 40.0 3213
°C
balance
balance
balance
balance 0.0 t/h
bar(ü) kJ/kg
°C bar(ü) kJ/kg
T P H
62 0.20 2613
°C bar(a) kJ/kg 0 t/h
M 55 t/h
M 32 t/h Boiler 6
6HA (capacity 38 t/h)
M 0 t/h
Boiler 5 5HA (capacity 30 t/h)
Boiler 1 1HA (capacity 56 t/h)
21 bar rail T P H
360 15.0 3168
0.0 t/h
°C bar(ü) kJ/kg
11 bar rail T P H
175 7.0 2780
0.0 t/h
°C bar(ü) kJ/kg
4 bar rail T P H
170 3.0 2797
0.0 t/h
°C bar(ü) kJ/kg 0.15 bar rail T P H
80 0,20 2648
°C bar(a) kJ/kg
Figure 18: Analysis of process data
0 10
8:56:008:56:108:56:208:56:308:56:408:56:508:57:008:57:108:57:208:57:308:57:408:57:508:58:008:58:108:58:208:58:308:58:408:58:508:59:008:59:108:59:208:59:308:59:408:59:509:00:009:00:109:00:209:00:309:00:409:00:509:01:00 20
30 40 50 60 70 80 90 100
0 5 10 15 20 25 30 35 40 45 50 Flow rate
t/h Pressure
bar ü
OLBA05CF701 flow steam 41 bar to turbine 5
OLBA40CF201 flow steam 41 bar to turbine 4 t/h OLBA02CF701 flow steam 41 bar to 41/21 red.station t/h
Steam quantity Boiler starting station calculated over position RV t / h
Steam quantity Turbos feed water pump t/h
Steam flow 41 bar turbine bypass station 1 to LUKO4 via position RV t/h Steam quantity Start-up control valve Boiler 1 via position RV t/h 0LBA01CP701 pressure 2v3 steam 41 bar steam engine bar ü Steam flow 41 bar turbine bypass station 2 to LUKO4 over position Steam quantity Start-up control valve Boiler 2 via position RV t / h
Waste Incineration
7.5. Example V: A plant in Western Germany (1 x 35 MW
th, 3 x 40 MW
th, 2 x 45 MW
th)
A way to increase the efficiency of a plant is to rise the live steam parameter. This was planned together with the change of an old boiler and the concept for a new turbine. One question, that has to be answered: What are the consequences for the existing boilers a) To evaluate the influences on the existing process, thermal calculation with new
parameter were done to point out the consequences.
b) A plant in close neighbourhood to residential buildings has a certain view to noise protection. To increase the acceptance in the neighbourhood and to lower the noise emission a new concept for the silencer of the blow down tank was developed.
c) Changing of waste quality in a changing market led to problems with the combusti- on quality. The layout possibilities in an existing plant are very limited. To improve the combustion quality and the burn out results we started to develop a concept to realise an additional primary air preheater. The specific challenge is to combine process needs and given layout possibilities.
7.6. Example VI: A plant in the Netherlands (2 x 60 MW
th)
The general view on a newly built facility assumes that it is state-of-the-art and free from defects. But what happens, if the plant builder gets into insolvency and the plant is not yet fully optimized?
In a partnership of involved experts from different companies and based on a funda- mental knowledge about the design, the time after commissioning was used to start the optimization work and the development of new concepts.
a) As a basis for further steps the basic study was done to point out all bottle necks and the current situation as well as the potential of the plant.
b) Damages caused by a blackout has been analyzed and reported as support for further insurance discussions.
Figure 19:
3D Model – Evaluation of pos- sible layout concept
Waste Incineration
c) Based on the basic study the possible load increase was evaluated in a second step.
The limitation in some components, as well as the necessary improvements for safety related components and optimization of control loops were listed and the consequences for the boiler were shown.
d) Temperature distribution in the 1st pass and the reduction of peaks, which lead to a higher corrosion risk, was combined with the optimization of the combustion control.
e) A possible step to increase the overall efficiency of the water steam cycle is to rise the live steam parameter. But not only the process side of the boiler must be able to fulfill this, as well the pressure part has to be able to work with the new parameters.
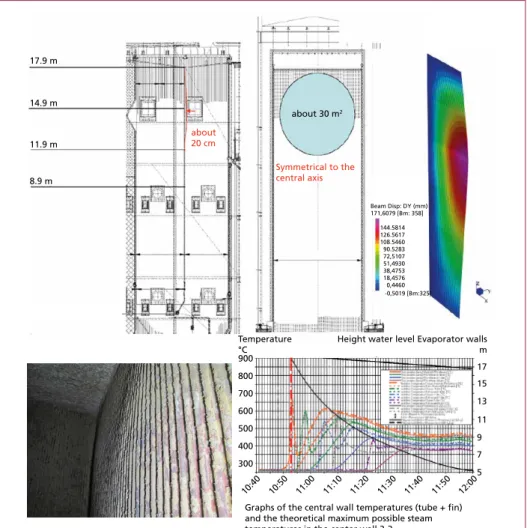
Based on several thermal calculations the maximum stress was evaluated and all headers and pipes as well as the pressure parts of the boiler were checked.
17.9 m
14.9 m
about 20 cm
Symmetrical to the central axis
about 30 m2 11.9 m
8.9 m
900 Temperature
°C
Height water level Evaporator walls m
Graphs of the central wall temperatures (tube + fin) and the theoretical maximum possible steam temperatures in the center wall 2-3.
800 700 600 500 400
300 5
7 9 11 13 17 15
10:4 0
10:5 0
11:0 0
11:10 11:20 11:3 0
11:4 0
12:00 11:5
0
Beam Disp: DY (mm) 171,6079 [Bm: 358]
144.5814 126.5617 108.5460 90.5283 72,5107 51,4930 38,4753 18,4576 0,4460 -0,5019 [Bm:325]
Figure 20: Evaluation of the reason for deformation of an evaporator wall
Waste Incineration
f) Whenever you can use heat out of the water-steam-system on a very low level with- out condensing losses, you can use this benefit to increase plant efficiency. Heat directly from waste! Supporting a customer with warm water to heat up a water cycle for production was the goal of a concept development. Before it was necessary to check the influence of this to the existing boiler one and to and to the boiler under construction in line 3. Especially the drum heat exchanger reaches its limits, but with modified bypass of the economizers the boilers are operable.
7.7. Example VII: A plant in Finland (1 x 53 MW
th, 1 x 36 MW)
In the most plants, single components are delivered in a standard way related to the project budget and under competitive pressure. After some years of operation, the operating company starts to develop solutions with a longer life time and lower main- tenance costs. Changes in fuel quality as well as possible reductions of operating costs are the basis for different optimization projects realised in the meantime.
a) A optimized fuel chute concept and modification at the grate reduced maintenance costs and the number of unplanned outages.
b) To find the right temperature profile for SNCR a check of the unnecessariness of refractory in the upper part of the 1st pass was the goal for a detailed process data analysis compared with temperature measurements and a measurement program with different combustion air distributions. In a second step, the SNCR process was modified to reduce operating costs. Refractory height could be reduced and changed to a maintenance friendly system.
7.8. Example VIII: A plant in Western Germany
(1 x 33 MW
th, 1x 18 MW
th, 1 x 6 MW
th, 1 x 3,5 MW
th)
Hazardous waste plants are very specific and the operating staff has a lot of experience with the combination of fuel and its influence to fouling and wearing. On the other hand, in times of reduced personal and the focus on economic aspects unplanned outages are increasing and the pressure on optimization solutions becomes higher. Related to the different parts of the plant a large number of projects where started.
a) A first step was the development of a boiler diary with the aim to show the complete history of the done repair works and modifications. The status of the different parts where evaluated, measured and documented. Similar activities where done on the process side.
b) Based on the above-mentioned status analysis and a customer developed concept for a change in fuel types a new concept for the oven hood was developed and constructed in detail. CFD analysis and the experience of the operating staff was part of the developed solution.
c) To check the influence of different water content in sludge test periods were analysed and the consequences for the boiler where pointed out.
Waste Incineration
d) The development and support of an energy management system was and still is a close working relationship between customer and SBENG to optimize energy con- sumption in the process line. Based on balances and detailed analyses the goal is to identify implausible measurements, to check not properly working components and to implement an PDMA-cycle. In the meantime, a successful audit attests the good work.
e) Refractory in the combustion part and in the pre-combustion chamber is a high costly maintenance item. Expert analysis and concept developments in combination with supplier and customer led to an optimized system.
f) To reduce unplanned outages in the flue gas cleaning caused by the quench header, new materials where checked and realisation is under progress.
7.9. Example IX: A plant in Western Germany (2 x 27 MW, 1 x 36 MW)
Related to the age of existing boiler and grate improvement in this three-line plant is clearly needed. After a complete revamping of the flue gas treatment in the year 1996 caused by the environmental regulations, the combustion system a boiler is main focus now.
The goal was mainly:
• increasing efficiency,
• reducing maintenance time and costs,
• creating solutions for fouling problems in the radiation pass of the boiler,
• improvement of the existing combustion control.
Based on operator experience and process data the evaluation of the current status and the development of the necessary modifications was done in the following steps:
a) In a basic study, the current situation of the combustion units and boiler where analysed. Thermal recalculation of the different load cases, fouling stages and heat values took place as well as a check of all necessary components. Possible solutions to reach the above-mentioned goal were developed:
• modification of the grate system,
• modification of the combustion chamber and refractory,
• combustion air distribution and O2-content,
• cleaning systems for the radiation pass,
• modification in heat surface cycle,
• additional economizer to reduce flue gas outlet temperature.
b) In a second step, the discussed and agreed solutions where detailed in the basic engineering phase with the following results:
• detailed description of the planed measure,
• bill of quantity of the measure,
• time schedule for realisation: engineering, production, dismantling, erecting and commissioning,
Waste Incineration
• specification for components,
• influence on the existing system,
• pointing out of benefits,
• cost estimation.
c) In the meantime, the combustion control was optimized for all three lines as the measure with the shortest time to realize without a plant outage.
Figure 21: Concept for a evaporator cooled combustion chamber side wall
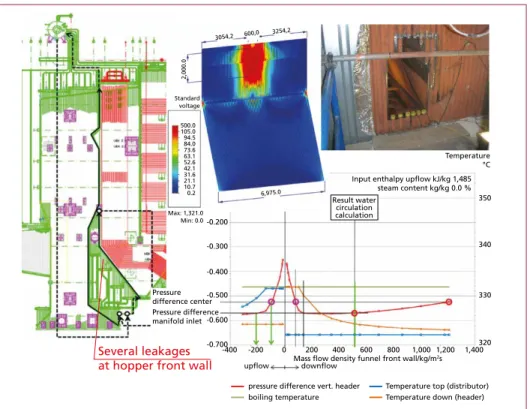
7.10. Example X: A plant in Western Germany (90 MW
th)
Several leakages at hopper front wall
-0.700-400 -0.600 -0.500 -0.400 -0.300 -0.200 -0,100 Pressure difference
bar Temperature
°C Input enthalpy upflow kJ/kg 1,485
steam content kg/kg 0.0 % 0
-200 200
Mass flow density funnel front wall/kg/m2s
upflow downflow
400 600 800 1,000 1,200 1,400320 330 340 350
boiling temperature
pressure difference vert. header Temperature top (distributor) Temperature down (header) 0
Result water circulation calculation
Pressure difference center Pressure difference manifold inlet
2,000.0
500.0 105.0 94.584.0 73.663.1 52.642.1 31.621.1 10.70.2
Max: 1,321.0 Min: 0.0 Standard
voltage
3054,2 600,0 3254,2
6,975.0
Figure 22: Repeated leakage – analysis, concept development, realisation
Waste Incineration
A coal and reject fired boiler supports a paper producing process. High availability and flexible operation is the goal. After several unplanned outages caused by a leakage of an evaporator wall in the hopper below 2nd and 3rd pass, the customer asks for support. He knew that different small project where realised before, the reason for damages was analysed and a solution was created. In the meantime, the following projects where realised:
a) Development of a concept for sidewall cooling for the reject grate.
b) Analysis of reason for leakages in the evaporator wall. As a reason, a structural mistake in the water circulating system could be identified.
c) Development and detail engineering for solution to solve the leakage problems.
d) Realisation of the modification.
8. Summary and outlook
The who sticks his head in the sand today, has grit in his teeth tomorrow. There is no re- ason to designate. The large number of successful realized project shows that a trustful partnership between plant operator and owner and right skilled partners is the right foundation for the implementation of optimization and development projects. The success speaks for itself.
Do not stew in your own juice, work together with competent partners! And avoid to stand still in your development, try a continues development instead, better step by step than with big jumps.
9. Literature
[1] Beckmann, M.; Pohl, M.; Spiegel, W.; Widder, T.: Wirtschaftliche Potentiale des Anlagen-Moni- torings. In: Thomé-Kozmiensky, K.J.; Beckmann, M. (Eds.): Energie aus Abfall, Band 12. Neu- ruppin: TK Verlag Karl Thomé-Kozmiensky, 2015, pp. 55-69
[2] Braun, G.; Höbler, M.; Hofacker, M.; Hoven, M.; Poschlod, J.; Schumacher, F.: Maximierung des Betriebsergebnisses für Abfallverbrennungsanlagen durch langfristige Servicepartnerschaft. In:
Thomé-Kozmiensky, K.J.; Thiel S.; Thomé-Kozmiensky, E.; (Eds.): Startegie Planung Umwelt- recht, Band 11. Neuruppin: TK Verlag Karl Thomé-Kozmiensky, 2017, pp. 141-158
[3] ecoprog GmbH: Market Study Waste to Energy 2016/2017
[4] EUWID 24.07.2016; http://www.euwid-recycling.de/news/international/einzelansicht/Artikel/
ecoprog-mva-markt-bleibt-weltweit-auf-allzeithoch.html
[5] Grahl, A.; Graube, F.; Reiche, M.; Stärke, T.; Thiel, C.; Beckmann, M.: Optimierung der Online- Reinigung durch erweiterte Sensorik und Monitoring. In: Thomé-Kozmiensky, K.J.; Beckmann, M. (Eds.): Energie aus Abfall, Band 14. Neuruppin: TK Verlag Karl Thomé-Kozmiensky, 2017, pp. 235-268
[6] Heißen, N.; Patel, B.; Mueller, C.: Kontinuierliche Prozessoptimierung durch modell- und sen- sorbasierte Dampferzeugerreinigung. In: Thomé-Kozmiensky, K.J.; Beckmann, M. (Eds.): Ener- gie aus Abfall, Band 11. Neuruppin: TK Verlag Karl Thomé-Kozmiensky, 2014, pp. 207-214 [7] International Solid Waste Association: ISWA Report 2015
Waste Incineration
[8] International Solid Waste Association: Waste-to-Energy State-of-the-Art-Report Statistics 6th Edition; Revision November 2013
[9] Krüger, S.; Krüger, J.: Optimierung von Verbrennungsanlagen – Praxiserfahrung bei der Ver- brennung von Abfällen. In: Thomé-Kozmiensky, K.J.; Beckmann, M. (Eds.): Energie aus Abfall, Band 12. Neuruppin: TK Verlag Karl Thomé-Kozmiensky, 2015, pp. 25-52
[10] Lehmann, H.: Erfahrungen beim Verschleißschutz in Abfallverbrennungsanlagen mit unter- schiedlichen Frischdampfdrücken In: Thomé-Kozmiensky, K.J.; Beckmann, M. (Eds.): Energie aus Abfall, Band 11. Neuruppin: TK Verlag Karl Thomé-Kozmiensky, 2014, pp. 517-537 [11] Mück, M.: Umbau von Abfallverbrennungsanlagen -Beispiele aus der jüngsten Vergangenheit.
In: Thomé-Kozmiensky, K.J.; Beckmann, M. (Eds.): Energie aus Abfall, Band 11. Neuruppin:
TK Verlag Karl Thomé-Kozmiensky, 2014, pp. 17-53
[12] Reiche, M.; Graube, F.; Grahl, S.; Beckmann, M.; Kaiser, M.; Taubner, S.; Spiegel, W.; Schindhelm, M; Baj, P.: Verschmutzung und optimierte Abreinigung der Heizflächen in der Abfallverbren- nungsanlage Coburg. In: Thomé-Kozmiensky, K.J.; Beckmann, M. (Eds.): Energie aus Abfall, Band 13. Neuruppin: TK Verlag Karl Thomé-Kozmiensky, 2016, pp. 173-187
[13] Spiegel, W.; Margel, G.; Herzog, T.; Müller, W.; Schmidl, W.: Systematische Optimierung von Kesselbauteilen bei Korrosions- und Verschmutzungsbelastungen. In: Thomé-Kozmiensky, K.J.; Beckmann, M. (Eds.): Energie aus Abfall, Band 11. Neuruppin: TK Verlag Karl Thomé- Kozmiensky, 2014, pp. 497-515
Bibliografische Information der Deutschen Nationalbibliothek Die Deutsche Nationalbibliothek verzeichnet diese Publikation in der Deutschen Nationalbibliografie; detaillierte bibliografische Daten sind im Internet über http://dnb.dnb.de abrufbar
Thomé-Kozmiensky, K. J.; Thiel, S.; Thomé-Kozmiensky, E.;
Winter, F.; Juchelková, D. (Eds.): Waste Management, Volume 7 – Waste-to-Energy – ISBN 978-3-944310-37-4 TK Verlag Karl Thomé-Kozmiensky
Copyright: Elisabeth Thomé-Kozmiensky, M.Sc., Dr.-Ing. Stephanie Thiel All rights reserved
Publisher: TK Verlag Karl Thomé-Kozmiensky • Neuruppin 2017
Editorial office: Dr.-Ing. Stephanie Thiel, Elisabeth Thomé-Kozmiensky, M. Sc.
Janin Burbott-Seidel and Claudia Naumann-Deppe
Layout: Sandra Peters, Anne Kuhlo, Ginette Teske, Claudia Naumann-Deppe, Janin Burbott-Seidel, Gabi Spiegel and Cordula Müller
Printing: Universal Medien GmbH, Munich
This work is protected by copyright. The rights founded by this, particularly those of translation, reprinting, lecturing, extraction of illustrations and tables, broadcasting, micro- filming or reproduction by other means and storing in a retrieval system, remain reserved, even for exploitation only of excerpts. Reproduction of this work or of part of this work, also in individual cases, is only permissible within the limits of the legal provisions of the copyright law of the Federal Republic of Germany from 9 September 1965 in the currently valid revision. There is a fundamental duty to pay for this. Infringements are subject to the penal provisions of the copyright law.
The repeating of commonly used names, trade names, goods descriptions etc. in this work does not permit, even without specific mention, the assumption that such names are to be considered free under the terms of the law concerning goods descriptions and trade mark protection and can thus be used by anyone.
Should reference be made in this work, directly or indirectly, to laws, regulations or guide- lines, e.g. DIN, VDI, VDE, VGB, or these are quoted from, then the publisher cannot ac- cept any guarantee for correctness, completeness or currency. It is recommended to refer to the complete regulations or guidelines in their currently valid versions if required for ones own work.