ATLAS-CONF-2017-036 24May2017
ATLAS CONF Note
ATLAS-CONF-2017-036
May 19, 2017
A search for √ B- L R-parity-violating scalar top in s = 13 TeV p p collisions with the ATLAS
experiment
The ATLAS Collaboration
A search is presented for the direct production of scalar top pairs which decay through an
R-parity-violating coupling to a final state with two leptons and two jets, at least one of which is identified as a
b-jet. The dataset consists of an integrated luminosity of 36.1 fb
−1of proton-proton collisions at a center-of-mass energy of
√s =
13 TeV, collected over 2015 and 2016 by the ATLAS detector at the LHC. No significant excess is observed over the Standard Model background, and exclusion limits are set on scalar top pair production at a 95% confidence level. Upper limits on the scalar top mass are set between 600 GeV and 1.5 TeV for branching fractions on the scalar top decay to an electron or muon and a
b-quark above 10%.
© 2017 CERN for the benefit of the ATLAS Collaboration.
Reproduction of this article or parts of it is allowed as specified in the CC-BY-4.0 license.
1 Introduction
The extension of the Standard Model (SM) of particle physics with supersymmetry (SUSY) [1–6] leads to processes that violate both baryon number (
B) and lepton number (
L), leading to rapid proton decay and lepton-number-violating processes. A common theoretical approach to reconcile the strong constraints from the non-observation of these processes is to introduce a multiplicative quantum number called
R- parity [7], defined as
R=(−1
)3(B−L)+2swhere
sis the spin of the particle. If
R-parity is conserved, then SUSY particles are produced in pairs, and the lightest supersymmetric particle (LSP) is stable. The LSP cannot carry electric charge or color charge without coming into conflict with astrophysical data [8, 9].
A number of theoretical models beyond the Standard Model (BSM) predict
R-parity violation [10–12].
The benchmark model of this search considers an additional local symmetry
U(1
)B-Lto the
SU(3
)C × SU(2
)L×U(1
)YStandard Model with right-handed neutrino supermultiplets. The minimal supersymmetric extension then only needs a vacuum expectation value for a right-handed scalar neutrino in order to spontaneously break the
B−Lsymmetry [13–17]. This minimal
B-
Lmodel violates lepton number but not baryon number. The couplings for
R-parity-violation (RPV) are highly suppressed, as they are related to the neutrino masses, and the model is consistent with the experimental bounds on proton decay and lepton number violation. At the LHC, the most noticeable effect is that the LSP is no longer stable and can now decay via
R-parity-violating processes, and it also may now carry color and electric charge. This leads to unique signatures that are forbidden in conventional models with
R-parity conservation. A novel possibility is a scalar top (˜
t) LSP with a rapid RPV decay. Due to the large top quark mass, the lightest ˜
tis expected to be significantly lighter than the other scalar quarks due to renormalization group effects [18, 19].
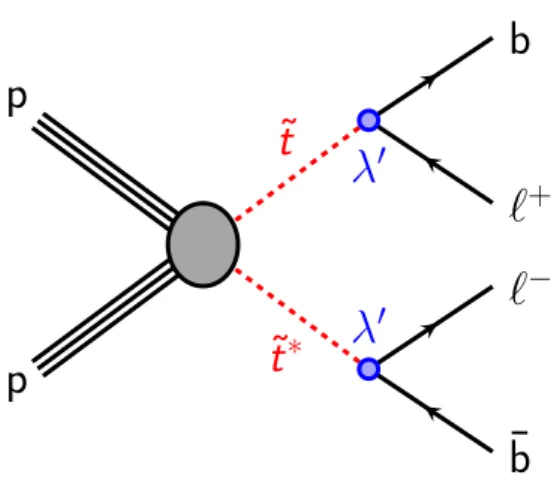
This document presents a search performed by ATLAS for direct scalar top pair production, with the RPV decay of each ˜
tto a
b-quark and a charged lepton (˜
t → b`), as shown in Figure 1. In contrast to
R-parity conserving searches for ˜
t, there is no significant missing transverse momentum. The ˜
tdecay branching fractions to each lepton flavor may be different in a manner related to the neutrino mass hierarchy [20, 21]. For the inverted mass hierarchy, the branching fraction to electrons may be as large as 100%. For the normal mass hierarchy, the branching fraction to muons may be as high as 90%. Therefore, the experimental signature is two oppositely charged leptons of any flavor and two
b-jets. For this analysis, only events with electron or muon signatures are selected, and final states are split by flavor into
ee,
eµ, and
µµselections. At least one of the two jets is required to be identified as initiated by a
b-quark, improving the selection efficiency of signal events over a two
b-jet requirement. Events are chosen that reconstruct two
b`resonances of roughly equal mass.
Previous searches with similar final states have targeted the pair production of first, second, and third generation leptoquarks at ATLAS [22, 23] and at CMS [24]. However, they consider final states within the same generation (
ee j j,
µµj j,
ττbbwhere
jindicates a light flavor jet) and do not focus on final states with
b-jets and electrons or muons (
eebb,
µµbb) nor consider final states with both electrons and muons (
eµbb). The results of the Run 1 leptoquark searches were interpreted for the ˜
tmass and its decay branching fractions in the
B−Lmodel [20, 21], setting lower mass limits between 424 and 900 GeV at a 95% confidence level.
The ATLAS detector and the dataset collected during Run 2 of the LHC are described in Sec. 2, with the
corresponding Monte Carlo simulation samples presented in Sec. 3. The identification and reconstruction
of jets and leptons is presented in Sec. 4, and the discriminating variables used to construct the signal
regions are described in Sec. 5. The method of background estimation is described in Sec. 6, and the
b
¯b
`
+`
−p
p
t ˜
t ˜
∗λ
0λ
0Figure 1: Feynman diagram for scalar top pair production, with ˜t and anti-˜t (˜t∗) decay to a charged lepton and b-quark through anR-parity violating couplingλ0.
systematic uncertainties are detailed in Sec. 7. The results are presented in Sec. 8, and the conclusion given in Sec. 9.
2 ATLAS detector and data set
The ATLAS detector [25] consists of an inner detector tracking system, sampling electromagnetic and hadronic calorimeters, and a muon spectrometer. Charged-particle tracks are reconstructed in the inner detector (ID), which spans the pseudorapidity1 range
|η| <2
.5, and consists of three subdetectors: a silicon pixel tracker, a microstrip silicon tracker, and a straw-tube transition radiation tracker. The ID is surrounded by a thin solenoid providing an axial magnetic field of 2 T, allowing the measurement of charged-particle momenta. In preparation for Run 2, a new innermost layer of the silicon pixel tracker, the insertable B-layer (IBL) [26], was introduced at a radial distance of 3.3 cm from the beamline to improve track reconstruction and the identification of jets initiated by
b-quarks.
The ATLAS calorimeter system consists of high-granularity electromagnetic and hadronic sampling calorimeters covering the region
|η|< 4.9. The electromagnetic calorimeter uses liquid argon (LAr) as the active material with lead absorbers in the region
|η|< 3.2. The central hadronic calorimeter incorporates plastic scintillator tiles and steel absorbers in the region
|η|< 1.7. The hadronic endcap calorimeter (1.5
<
|η|< 3.2) and forward calorimeters (3.1 <
|η|< 4.9) also use LAr with copper or tungsten absorbers.
The muon spectrometer (MS) surrounds the calorimeters and measures muon tracks within
|η|< 2.7 using three layers of precision tracking chambers and dedicated trigger chambers. A system of three superconducting air-core toroidal magnets provides a magnetic field for measuring muon momenta.
1ATLAS uses a right-handed coordinate system with its origin at the nominal interaction point (IP) in the center of the detector and thez-axis along the beam pipe. The x-axis points from the IP to the center of the LHC ring, and the y-axis points upward. Cylindrical coordinates(r, φ)are used in the transverse plane,φbeing the azimuthal angle around thez-axis. The pseudorapidity is defined in terms of the polar angleθasη=−ln tan(θ/2).
The ATLAS trigger system begins with a hardware-based Level 1 (L1) trigger followed by a software-based high-level trigger (HLT) [27]. The L1 trigger is designed to accept events at an average 100 kHz rate, and the HLT is designed to accept events that are written out to disk at an average rate of 1 kHz. Electrons are triggered in the pseudorapidity range
|η|< 2.5, where the electromagnetic calorimeter is finely segmented and track reconstruction is available. Compact electromagnetic energy deposits triggered at L1 are used as the seeds for the HLT algorithms, which are designed to identify electrons based on calorimeter and fast track reconstruction. The muon trigger at L1 is based on a coincidence of trigger chamber layers.
The parameters of muon candidate tracks are then derived in the HLT by fast reconstruction algorithms in both the ID and MS.
The data sample used for this search was collected from proton–proton collisions at a center-of-mass energy of
√s =
13 TeV in 2015 and 2016 while tracking detectors, calorimeters, muon chambers, and magnets were operating normally and corresponds to an integrated luminosity of 36.1 fb
−1. The uncertainty in the combined 2015+2016 integrated luminosity is 3.2%. It is derived, following a methodology similar to that detailed in Ref. [28], from a preliminary calibration of the luminosity scale using x-y beam-separation scans performed in August 2015 and May 2016. The LHC collided protons with bunch crossing intervals of 25 ns, and the average number of interactions per bunch crossing was estimated to be
hµi=23
.7.
For this analysis, events are selected using single-electron and single-muon triggers requiring leptons above a transverse momentum (
pT) threshold and passing varying lepton identification and isolation criteria.
The trigger-level criteria on the
pT, identification, and isolation of the leptons are looser than those applied in the event selection to ensure that trigger efficiencies are constant in the analysis phase space.
3 Monte Carlo simulation
Monte Carlo (MC) simulation is used to predict the backgrounds from SM processes, estimate the detector response and efficiency to reconstruct the signal process, and estimate systematic uncertainties. The largest sources of SM backgrounds are
t¯t, single-top, and
Z+jets production, and their yields are estimated throughdata-driven methods described in Sec. 6. The smaller backgrounds are
W+jets, diboson, and t¯t+
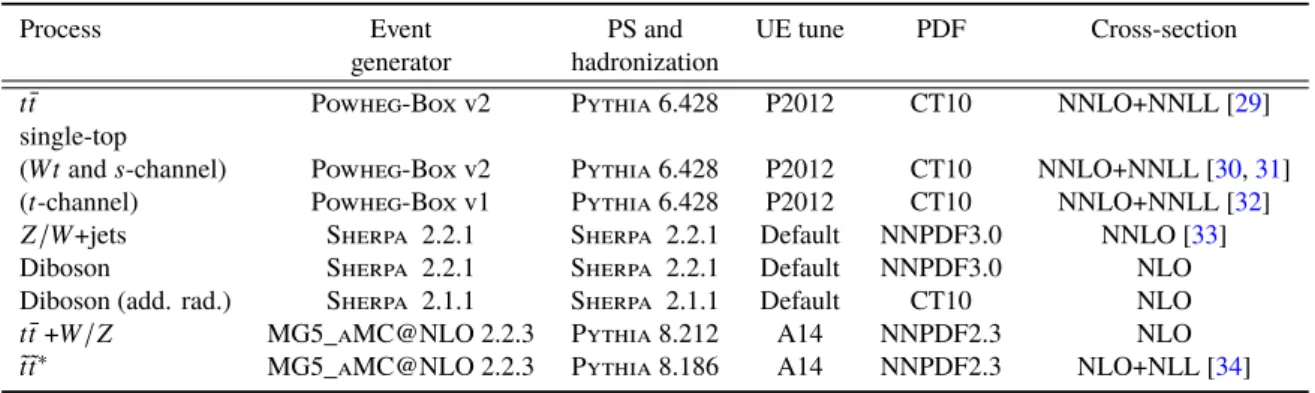
W/Zproduction and are estimated directly from MC simulation. The contribution from backgrounds with jets misreconstructed as leptons or with non-prompt leptons is negligible, and is therefore determined from MC simulation. Details of the MC simulations are given below and are summarized in Table 1.
Process Event PS and UE tune PDF Cross-section
generator hadronization
t¯t Powheg-Box v2 Pythia 6.428 P2012 CT10 NNLO+NNLL [29]
single-top
(Wtands-channel) Powheg-Box v2 Pythia 6.428 P2012 CT10 NNLO+NNLL [30,31]
(t-channel) Powheg-Box v1 Pythia 6.428 P2012 CT10 NNLO+NNLL [32]
Z/W+jets Sherpa 2.2.1 Sherpa 2.2.1 Default NNPDF3.0 NNLO [33]
Diboson Sherpa 2.2.1 Sherpa 2.2.1 Default NNPDF3.0 NLO
Diboson (add. rad.) Sherpa 2.1.1 Sherpa 2.1.1 Default CT10 NLO
t¯t+W/Z MG5_aMC@NLO 2.2.3 Pythia 8.212 A14 NNPDF2.3 NLO
t˜˜t∗ MG5_aMC@NLO 2.2.3 Pythia 8.186 A14 NNPDF2.3 NLO+NLL [34]
Table 1: MC simulation details by physics process.
The
tt¯ and single-top processes [35] are simulated at next-to-leading order (NLO) accuracy in perturbative QCD using the Powheg-Box [36] v2 generator for
tt¯ ,
Wt, and
s-channel single-top production, and using the Powheg-Box v1 generator for the electroweak
t-channel single-top production. For these processes the top spin correlations are preserved, and the top quark mass is set to 172.5 GeV. The matrix element is interfaced with the CT10 [37] parton distribution function (PDF) set, with the parton shower (PS), fragmentation, and underlying event are simulated with Pythia 6.428 [38] using the CTEQ6L1 [39] PDF set and P2012 [40] underlying event tuned parameters (UE tune), with additional radiation simulated to the leading-logarithmic approximation through
pT-ordered parton showers [41].
The
Z+jets and W+jets samples [42] are generated at NLO with the Sherpa2.2.1 [43] generator.
Matrix elements are calculated for up to 2 partons at NLO and 4 partons at LO using the Comix [44] and OpenLoops [45] matrix element generators and merged with the Sherpa PS [46] using the ME+PS@NLO prescription [47]. The NNPDF3.0 [48] PDF set is used in conjunction with dedicated PS tuning developed by the Sherpa authors. Diboson samples with two, three, or four leptons are similarly generated with Sherpa 2.2.1. The diboson matrix elements contain all diagrams with four electroweak verticies, and are calculated for up to one (
Z Z) or zero (
WW,
W Z) partons at NLO and up to three partons at LO. Diboson events produced in association with additional radiation are simulated with Sherpa 2.1.1, using the same prescriptions as above but with the CT10 PDF set used in conjunction with the dedicated Sherpa PS tuning. The production of
t¯tpairs in assocation with
Wand
Zbosons (
t¯t+V) is generated at NLO using MadGraph5_aMC@NLO (MG5_aMC@NLO) 2.2.3 [49] and interfaced to Pythia 8.212 [50] with the CKKW-L [51] prescription. It uses the A14 [52] UE tune and NNPDF2.3 [53] PDF set.
The RPV scalar top signal events are generated at leading-order using the MG5_aMC@NLO 2.2.3 generator with the NNPDF2.3 PDF set and interfaced to Pythia 8.186 [50] using the A14 UE tune.
The matrix element is matched to the PS using the CKKW-L prescription, with the matching scale set to one quarrter of the generated scalar top mass. All other supersymmetric particles are assumed to be decoupled. The signal cross sections are calculated to NLO accuracy in the strong coupling constant, adding the resummation of soft gluon emission at next-to-leading-logarithmic accuracy (NLO+NLL) [54–
57]. The nominal cross section and the uncertainty for each mass point are taken from a combination of cross section predictions using different PDF sets and factorization and renormalization scales, as described in Ref. [34]. Scalar top samples are generated at masses between 600 and 1000 GeV in steps of 100 GeV and between 1000 and 1600 GeV in steps of 50 GeV. The cross section ranges from 175
±23 fb for a ˜
tmass of 600 GeV to 0
.141
±0
.038 fb for a mass of 1600 GeV. The generated scalar tops decay promptly through ˜
t →b`with a 1/3 branching ratio (
Br) into each lepton flavour. When optimizing the signal event selection, the generated events are reweighted to have
Br(˜t → be) = Br(˜t → bµ) =0
.5 and
Br(t˜
→ bτ) =0, and various weightings are used to derive limits for different branching ratio assumptions.
All background samples are normalized to the available NLO or NNLO cross sections, as indicated in Table 1. The modeling of c-hadron and b-hadron decays in samples generated with Powheg-Box or MG5_aMC@NLO is performed with EvtGen 1.2.0 [58]. Generated events are propagated through a full simulation [59] of the ATLAS detector based on Geant4 [60] which describes the interactions of the particles with the detector. A parameterized simulation of the ATLAS calorimeter called Atlfast-II [59]
is used for faster detector simulation of signal samples, and is found to have good agreement with the
full simulation. Multiple overlapping
ppinteractions (pileup) are included in by overlaying simulated
minimum bias events onto the simulated hard scatter event. Minimum bias events are generated using
Pythia 8.186 with the A2 [61] UE tune and MSTW2008LO [62] PDF set. The simulated events are
weighted such that the distribution of the average number of
ppinteractions per bunch crossing agrees with data.
4 Event reconstruction
Events, leptons, and jets are required to pass several quality criteria to be considered by the analysis.
Events recorded during stable beam and detector conditions are required to pass data-quality criteria [63].
Each event is required to have a primary reconstructed vertex with two or more associated tracks with
pT>400 MeV, where the primary vertex is chosen as the vertex with the highest
Σp2T
of associated tracks.
Two stages of quality and kinematic requirements are applied to leptons and jets. The looser baseline requirements are first applied, and baseline leptons and jets are used to resolve any misidentification or overlap between electrons, muons, and jets. The subsequent tighter signal requirements are then applied to identify high-quality leptons and jets in the kinematic phase-space of interest.
Electron candidates are reconstructed from energy deposits in the electromagnetic calorimeter matched to a charged particle track in the ID. Baseline electron candidates must have
pT >10 GeV,
|η| <2
.47, and satisfy a loose electron likelihood identification [64]. Signal electrons must pass the baseline electron selection, have
pT >40 GeV, and satisfy a tight electron likelihood identification. In addition they must be isolated from nearby activity, passing a loose
pT-dependent track-based criterion [65]. Finally, their trajectory must be consistent with the primary vertex, such that their impact parameter in the transverse plane (
dPV0
) satisfies
|dPV0 |/σdPV 0
<
5, where
σdPV0
is the uncertainty on
dPV0
. The distance between the impact parameter and the primary vertex along the beam direction (
zPV0
) must also satisfy
|zPV
0
sin
θ| <0
.5 mm.
Muon candidates are reconstructed by combining tracks in the ID and track segments in the MS. Baseline muon candidates must have
pT >10 GeV,
|η| <2
.7, and satisfy the medium muon identification criteria [66]. Signal muons must pass the baseline muon selection, have
pT >40 GeV,
|η| <2
.5,
|zPV
0
sin
θ| <0
.5 mm, and
|dPV0 |/σdPV 0
<
3. As with electrons, muons must pass the
pT-dependent loose track-based isolation criteria. Events containing a poorly measured signal muon, as determined by having incompatible momentum measurements in the ID and the MS, are rejected. Absolute requirements on the impact parameter of signal muons are also applied to reject cosmic muons, requiring
|zPV0 | <
1 mm and
|dPV
0 | <
0
.2 mm.
Jets are reconstructed using the anti-
ktalgorithm [67, 68] with a radius parameter
R=0
.4 from clusters
of energy deposits in the calorimeters [69]. Jets are corrected for pileup contamination on a per-event
basis using the jet area subtraction method [70, 71]. Jets are further calibrated to account for the predicted
detector response in MC simulation, and a residual calibration of jets in data is derived through in situ
measurements [72]. Baseline jet candidates are required to have
pT >20 GeV and
|η| <2
.8. Jets with
pT <60 GeV and
|η| <2
.4 are required to pass pileup-rejection criteria implemented via the jet vertex
tagger (JVT) algorithm [70]. Signal jets must pass the baseline jet selection and have
pT >60 GeV. Events
with jets that fail the loose quality criteria [73] to identify noise bursts and non-collision backgrounds are
rejected. Jets initiated by
b-quarks are identified using the multivariate
MV2c10b-tagging algorithm [74,
75], which exploits the impact parameters of charged particle tracks, the parameters of reconstructed
secondary vertices, and the topology of
b- and
c-hadron decays inside a jet. The working point is
chosen to provide a
b-tagging efficiency of 77% per
b-jet in simulated
tt¯ events with a rejection factor of
approximately 130 for light quark- and gluon-initiated jets and 6 for
c-quark-initiated jets [75]. Correction
factors are applied to events to compensate for differences between data and MC simulation in the b-tagging efficiency for
b-,
c-, and light-jets.
To avoid reconstructing a single detector signature as multiple leptons or jets, an overlap removal procedure is performed on baseline leptons and jets. The requirements are applied sequentially, and failing particles are removed from consideration in the subsequent steps. If an electron and muon share a track in the ID, the electron is removed. Any jet that is not
b-tagged and is within a distance2
∆R(`,jet
) ≤0
.20 of a lepton is removed. If the jet is
b-tagged, the lepton is removed instead in order to suppress leptons from semi-leptonic decays of c- and b-hadrons. Finally, any lepton within
∆R(`,jet
) ≤0
.40 of a jet is removed.
The identification, reconstruction, isolation, and trigger efficiencies of electrons [65] and muons [66] in MC simulation are corrected using events in data with leptonic
Zand
J/ψdecays. Similarly, corrections to the
b-tagging efficiency and mis-tag rate in MC simulation are derived from various control regions in data [75].
5 Event selection
To identify the pair production of scalar tops, events are required to have at least two leptons and two jets.
If more than two leptons or two jets are found, the objects with the highest
pTare selected. At least one of the two leading jets must be
b-tagged. The selected leptons are required to have opposite charge, and one of them must be consistent with the associated single-lepton trigger. This trigger requirement is highly efficient for signal events, with an efficiency of 93% for the
µµchannel and 98% for the
eechannel.
The lepton–jet pair of each ˜
tdecay will roughly reconstruct the invariant mass
mb`of the original ˜
t. In an event with two leptons and two jets, two pairings are possible; one that reconstructs the correct ˜
tmasses, and one which inverts the pairing and incorrectly reconstructs the masses. As the two masses should be roughly equal, the pairing which minimizes the mass asymmetry between
mb`0and
m1b`is chosen, defined as
masymb` = m0b`−m1b`
m0b`+m1b`.
Here
m0b`is chosen to be the larger of the two masses. Events are further selected to have small mass asymmetry
masymb` <0
.2. This reduces the contamination from background processes, whose random pairings lead to a more uniform
masymb`distributions.
Two nested signal regions (SRs) are constructed to optimize the identification of signal over background events. The signal regions are optimized using MC signal and background predictions, assuming ˜
tdecays of
Br(˜t → be)=
Br(t˜
→ bµ)= 50%. A primary kinematic selection of the signal regions is on
m0b`, with SR800 requiring
m0b` >800 GeV and SR1100 requiring
m0b` >1100 GeV. By defining two signal regions the sensitivity to high mass signals above 1.1 TeV is improved, while still allowing for sensitivity to lower mass signals. Several other kinematic selections, common to both SRs, are defined to reduce the
2 The distance between two four-vectors is defined as∆R=p
(∆η)2+(∆φ)2, where∆ηis their distance in pseudorapidity and
∆φis their azimuthal distance. The distance with respect to a jet is calculated from its central axis.
contribution of the largest backgrounds. As the ˜
tdecay products are generally very energetic, a selection on their
pTsum,
HT =Õ2
i=1
p`i
T +Õ2
j=1
pjetj
T
is applied, such that
HT >1000 GeV. To reduce contamination from
Z+jets events, a requirement isplaced on the invariant mass of two same-flavor leptons, with
m`` >300 GeV. A large fraction of background processes involving a top quark is suppressed through the requirement on
m0b`and
masymb`, with correctly reconstructed top masses falling well below the signal region requirements. However, top decays in which the lepton and b-jet decay products are mispaired can enter the SRs if the incorrectly reconstructed masses are large. In such cases it is the rejected pairing that properly reconstructs the top decay, with one of the two
b`pair masses below the kinematic limit for a top decay. To suppress such backgrounds, events are rejected if the subleading
b`mass of the rejected pairing,
m1b`(rej), is compatible with that of a reconstructed top quark, with
m1b`(rej)
<150 GeV.
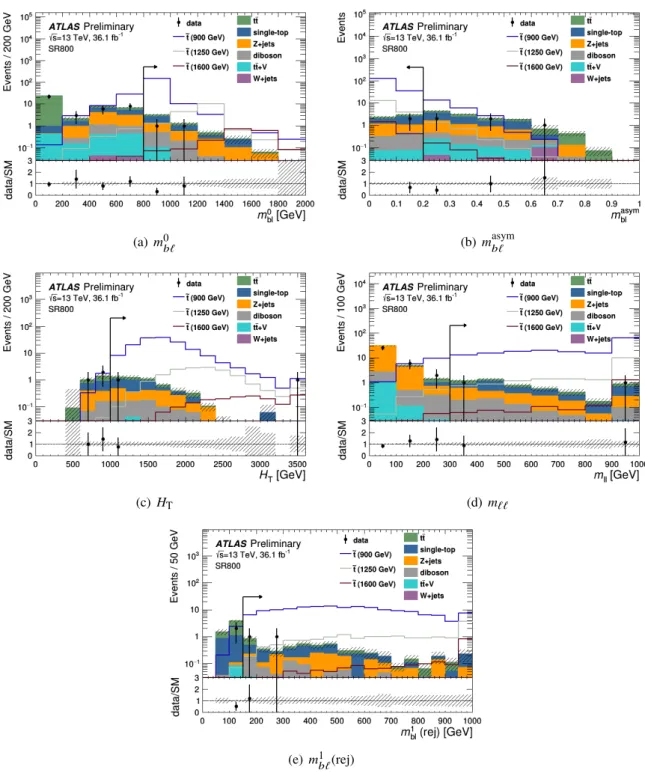
The distribution of predicted signal and background events is shown for the SR800 region in Fig. 2 for
m0b`,
HT,
masymb`,
m``, and
m1b`(rej), demonstrating the potential for background rejection. For the 1 TeV (1.5 TeV) mass signal model, the SR800 selections are 21% (24%) efficient for events with two ˜
t → bedecays, 16% (16%) for events with two ˜
t → bµdecays, and 0.1% (0.3%) for events with two ˜
t → bτdecays.
6 Background estimation
For each of the relevant backgrounds in the signal regions, one of two methods is used to estimate the contribution. For the minor diboson,
t¯t+V, and
W+jets backgrounds, the prediction from MC simulationis taken, corrected to the highest order theoretical cross section available. For the dominant
tt¯ , single-top, and
Z+jets backgrounds, the expected yield in the SRs is estimated by scaling each MC prediction by anormalization factor (NF) derived from three dedicated control regions (CRs), one for each background process. Each control region is defined to be kinematically close to the SRs while inverting or relaxing specific selections to enhance the contribution of the targeted background process while reducing the contamination from other backgrounds and the benchmark signals.
To derive a background-only estimation, the normalizations of the
tt¯ , single-top, and
Z+jets backgroundsare determined through a likelihood fit [76] performed simultaneously to the observed number of events in each CR. The expected yield in each region is given by the sum over all background processes in the
ee,
eµ, and
µµchannels inclusively. The NF for each of the
tt¯ , single-top, and
Z+jets backgrounds arefree parameters of the fit. The systematic uncertainties are treated as nuisance parameters in the fit.
Several validation regions (VRs) are defined to test the extrapolation from the CRs to SRs over the relevant
kinematic variables. The VRs are disjoint from both the CRs and SRs, and are constructed to fall between
one or more CRs and the SRs in one of the extrapolated variables. The VRs are not included in the fit, but
provide a statistically independent cross-check of the background prediction in regions with a negligible
signal contamination. Three VRs are constructed to test the extrapolation in the
m0b`,
m1b`(rej), and
HTobservables. A fourth VR is constructed to validate the extrapolation of the
Z+jets CR inm``. Details of
(a) m0b` (b)masymb`
(c) HT (d)m``
(e)m1b`(rej)
Figure 2: A comparison of data to the post-fit MC prediction inm0b`(a),masymb` (b),HT(c),m``(d), andm1b`(rej) (e)in the SR800 signal region. The SR800 event selections are applied for each distribution except the selection on the variable shown, which is indicated by an arrow. Normalization factors are derived from the background-only estimation discussed in Sec.6 and are applied to the dominanttt¯, single-top, andZ+jets processes. Benchmark signal models generated at masses of 900, 1250, and 1600 GeV are included for comparison. The bottom panel shows the ratio between the data and SM prediction. The hashed uncertainty band includes the statistical uncertainties on the background prediction. The last bin includes the overflow events.
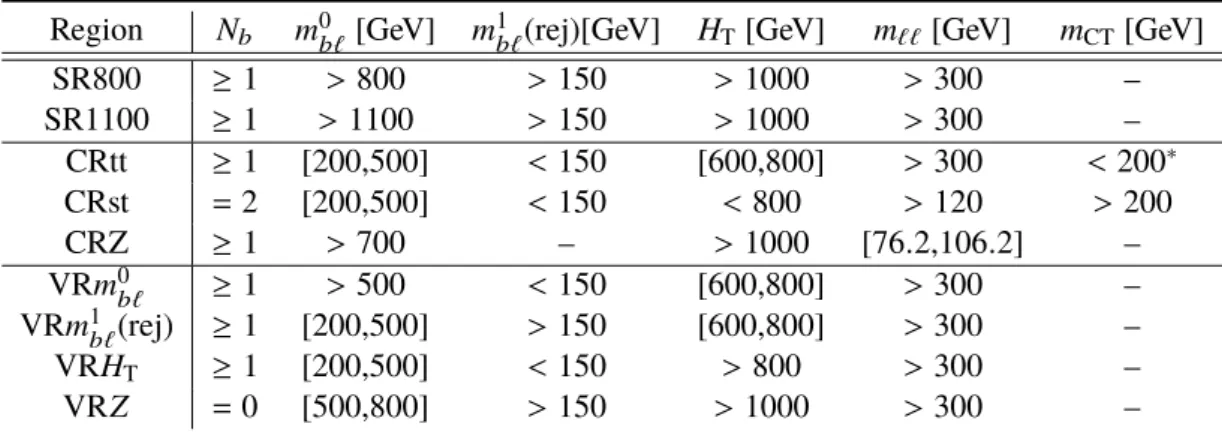
the selection criteria in each CR and VR are presented below, and a summary of the selections is provided in Table 2.
Region
Nb m0b`[GeV]
m1b`(rej)[GeV]
HT[GeV]
m``[GeV]
mCT[GeV]
SR800
≥1
>800
>150
>1000
>300 –
SR1100
≥1
>1100
>150
>1000
>300 –
CRtt
≥1 [200,500]
<150 [600,800]
>300
<200
∗CRst
=2 [200,500]
<150
<800
>120
>200
CRZ
≥1
>700 –
>1000 [76
.2,106
.2] –
VR
m0b` ≥1
>500
<150 [600,800]
>300 –
VR
m1b`(rej)
≥1 [200,500]
>150 [600,800]
>300 –
VR
HT ≥1 [200,500]
<150
>800
>300 –
VR
Z =0 [500,800]
>150
>1000
>300 –
Table 2: Summary of the selections of the signal, control, and validation regions. All regions require at least two oppositely charged leptons and at least two jets. Each region requires at least one of the two leading jets to be b-tagged with the exception of CRst, which requires both leading jets to beb-tagged, and VRZ, which requires zero b-tagged jets in the event. A mass asymmetry selection ofmasymb` <0.2 is applied to all regions. The contransverse mass selectionmCT(Eq.1) is only applied to events in CRtt with exactly twob-tagged jets, as indicated by the∗, ensuring the region is orthogonal to CRst.
6.1 Single-top control region
The single-top background enters the SR through the
Wtprocess, when the
b`pair produced in the leptonic top quark decay are incorrectly paired with the lepton from the
Wdecay and an additional jet from QCD radiation. The CRst control region is designed to target the
Wtproduction in a less-energetic kinematic region or where the rejected
b`pairing correctly associates the decay products of the top quark.
To separate CRst from the SRs, the
HTand
m0b`requirements are reversed such that
HT <800 GeV and 200
< mb`0 <500 GeV. To target events in which the top quark is reconstructed in the rejected
b`pairing, the selection on
m1b`(rej) is reversed, requiring
m1b`(rej)
<150 GeV. As there is no dilepton resonance in this background process the
m``selection is reduced to increase the CRst yield and improve the statistical precision of the constraint.
The cross section of the
Wtprocess is significantly lower than that of
t¯tproduction. The contransverse mass (
mCT) [77] is introduced to discriminate between
Wtand
tt¯ events and increase the
Wtpurity in the CRst. The
mCTobservable attempts to reconstruct the invariant mass of pair-produced, semi-invisibly decaying heavy particles. For two identical decays of top quarks into two visible
b-quarks
b1and
b2, and two W bosons, each of whose decay products may include an invisible particle,
mCTis defined as
m2
CT(b1,b2)=[ET(b1)+ET(b2)]2− [pT(b1) −pT(b2)]2,
(1) where
ET = qp2
T+m2
. For an event with two top quarks, the
mCTobservable will therefore have a kinematic endpoint at
mmax
CT = m2t −mW2 mt ,
where
mtand
mWare the masses of the top quark and W boson, respectively. A lower cut on this variable
is effective at suppressing the
tt¯ background, for which
mCThas a kinematic endpoint of about 135 GeV,
and a strict requirement of
mCT >200 GeV is applied in CRst. The
mCTvariable is only effective at rejecting
tt¯ events in which the
b-quark decay products of both top quarks are properly identified, and both leading jets (and only the leading jets) are required to be
b-tagged in CRst, such that
Nb =2. The
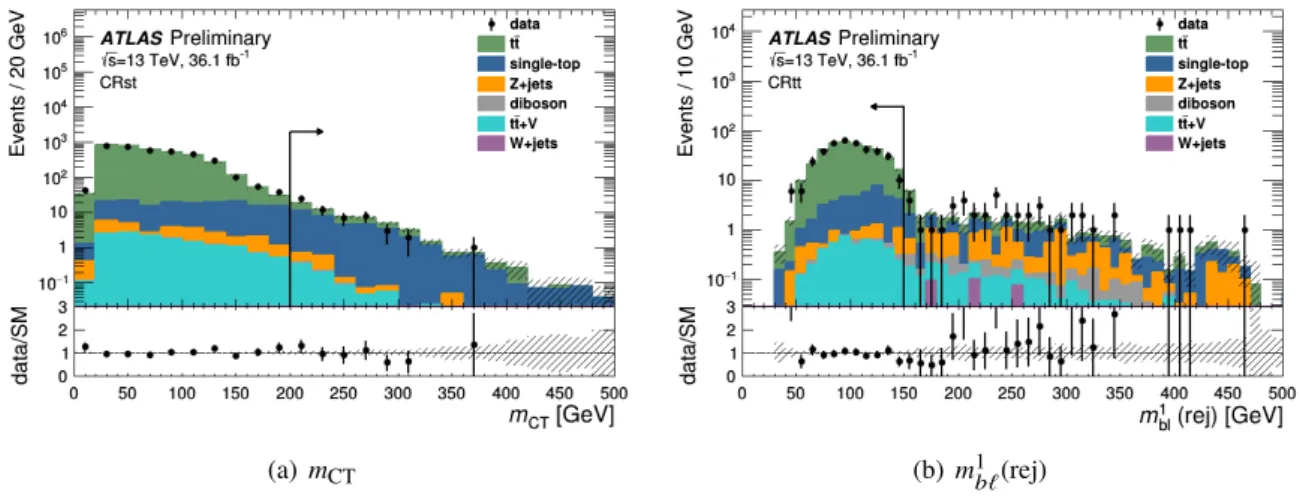
mCTdistribution of the backgrounds in CRst is shown in Fig. 3(a) when no
mCTrequirement is applied, and a significant single-top contribution is seen for
mCT >200 GeV.
6.2 t t ¯ control region
The CRtt control region is constructed to target
t¯tevents with kinematics similar to the SRs. As with CRst, the
HTand
m0b`requirements are inverted such that 600
< HT <800 GeV and 200
<m0b` <500 GeV. The selection on
m1b`(rej) is also inverted, requiring
m1b`(rej)
<150 GeV, such that one of the two top quarks is reconstructed in the rejected
b`pairings. The distribution of
m1b`(rej) in CRtt is shown in Fig. 3(b), showing the mispairing of
t¯tevents is well-modeled in MC simulation. Due to the larger cross section of the
t¯tprocess, contamination from
Wtevents is minimal. However, to maintain orthogonality with CRst, a requirement of
mCT <200 GeV is applied to events in which both leading jets (and only the leading jets) are
b-tagged, with
Nb=2.
6.3 Z + jets control region
The CRZ control region targets
Z+jets events by applying a selection on the invariant mass of the dileptonpair
m``, requiring it to be within 15 GeV of the Z mass. Both leptons are required to be of the same flavor. The
m``selection is effective at removing signal contamination, and the SR
HTselection is left unchanged, while the
m0b`selection is slightly relaxed to
m0b` >700 GeV to enchance the event yield.
(a)mCT (b)m1b`(rej)
Figure 3: A comparison of data to the post-fit MC prediction for(a)mCTin CRst and(b)m1b`(rej) in CRtt. The relevant CR event selections are applied for each distribution except the selection on the variable shown, which is indicated by an arrow. Normalization factors are derived from the background-only fit configuration and are applied to the dominanttt¯, single-top, andZ+jets processes. The bottom panel shows the ratio between the data and SM prediction. The hashed uncertainty band includes the statistical uncertainties on the background prediction. The last bin includes the overflow events.
6.4 Validation regions
Four disjoint validation regions are developed to test the extrapolation of the background fit between the CRs and SRs. A full list of the region selections is given in Table 2. The VR
m0b`, VR
m1b`(rej), and VR
HTtest the extrapolation from CRst and CRtt to the SRs in the
m0b`,
m1b`(rej), and
HTobservables by requiring
m0b` >500 GeV,
m1b`(rej)
>150 GeV, and
HT >800 GeV, respectively. In this way VR
m0b`, VR
m1b`(rej), and VR
HTall lie between the SRs and both CRtt and CRst, with signal contamination below 1% for all signal mass points. No requirement is placed on
mCTin any VR, allowing both
tt¯ and
Wtcontributions to be validated.
A fourth validation region, VR
Z, is developed to extrapolate between CRZ and the SRs in the
m``observable, requiring
m`` >300 GeV. As the
m``variable provides the only separation between CRZ and the SRs, the requirement on
m0b`is relaxed to 500
< m0b` <800 GeV, and any event with a
b-tagged jet is rejected, such that
Nb =0. The
Z+jets MC prediction models the data well in bothmb`and
Nb, with a signal contamination in VR
Zbelow 5% for mass points above 1 TeV.
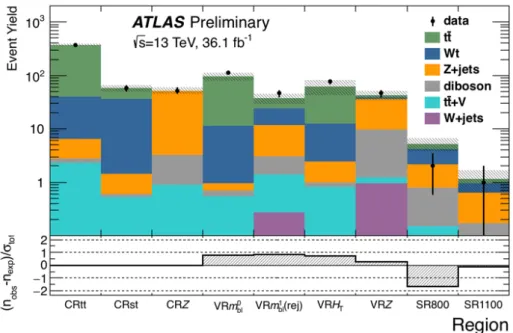
The observed data yield and the post-fit background prediction for each CR and VR are shown in Fig. 4.
Good agreement is seen in all validation regions, with differences between the data and SM prediction below 1
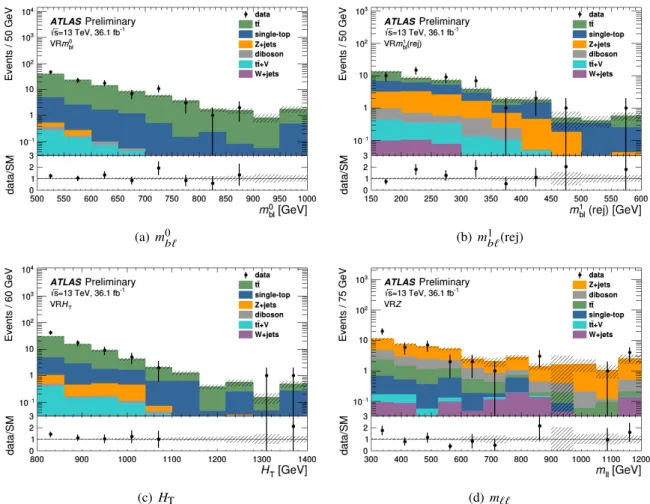
σ. The modeling of the extrapolated variable for each VR is shown in Fig. 5, demonstrating good agreement in the shape of the variables of interest.
Figure 4: Comparison of the observed data and expected number of events in the CRs, VRs, and SRs. The background prediction is derived with the background-only fit configuration, and the hashed band includes the total uncertainty on the background prediction. The bottom panel shows the significance of the difference between data and the background prediction.
(a) m0b` (b)m1b`(rej)
(c) HT (d)m``
Figure 5: A comparison of data to the post-fit MC prediction for(a)m0b`in VRm0b`,(b)m1b`(rej) in VRm1b`(rej),(c) HTin VRHT, and(d)m`` in VRZ. Normalization factors are derived from the background-only fit configuration and are applied to the dominanttt¯, single-top, and Z+jets processes. The bottom panel shows the ratio between the data and SM prediction. The hashed uncertainty band includes the statistical uncertainties on the background prediction. The last bin includes the overflow events.
7 Systematic uncertainties
Systematic uncertainties on the signal and background predictions arise from theoretical sources on the expected yield and MC modeling, and from experimental sources.
Experimental uncertainties reflect the precision of the energy and momentum calibration of jets and leptons, as well as the assumptions on the identification and reconstruction efficiencies in MC simulation.
The dominant experimental uncertainties are related to jets, including those in the jet energy scale and
resolution [72, 78] and the calibration of the
b-tagging efficiency for
b-,
c-, and light-flavor jets [75]. The
largest experimental uncertainties on the fitted background prediction in SR800 (SR1100) are in jet energy
resolution at 2% (10%) and the
b-tagging efficiency of light-flavor jets at 2% (4%). The experimental
uncertainties on leptons each have a small impact on the final measurement, which includes uncertainties
in the energy scale and resolution of electrons [65] and muons [66], and the calibration of the lepton
trigger, identification, reconstruction, and isolation efficiencies. The 3.2% uncertainty on the measured
integrated luminosity also has a marginal effect on the final result.
Uncertainties on the MC modeling of the
t¯tand
Wtbackgrounds account for the choice of MC generator, variations in the hadronization and fragmentation processes, and the amount of initial- and final-state radiation [35]. As the
t¯t(
Wt) background normalization is constrained in the likelihood fits, the uncertainty on the transfer of the NF from the CRtt (CRst) to both SR800 and SR1100 is derived by comparing signal- to-control region yields in alternative models. The uncertainty on the background estimation due to the choice of MC generator is derived for
t¯tand
Wtby comparing the SR-to-CR NF derived using MG5_aMC@NLO 2.2.3 against Powheg-Box v2, both showered with Herwig++ v2.7.1 [79] using the UEEE5 [80] UE tune. The hadronization and fragmentation modeling is similarly evaluated in both
t¯tand
Wtby comparing the nominal Powheg+Pythia sample with the same Powheg+Herwig sample.
The uncertainty related to initial and final state radiation is evaluated for both
tt¯ and
Wtby varying the parameters of the generator and P2012 UE tune in the nominal Powheg+Pythia sample related to NLO radiation and the factorization and renormalization scale. An uncertainty on the single-top yield due to the destructive interference between the
t¯tand
Wtprocesses is measured using inclusively-generated WWbb events at LO, and compared with the combined yields of LO-generated
tt¯ and
Wtsamples. The uncertainty on the total background estimate is found to be 8-45% from
t¯tsamples and 22% from single-top samples.
The theoretical uncertainties on the
Z+jets, diboson, andtt¯
+Vsamples are calculated by varying generator parameters related to the factorization, renormalization, resummation, and CKKW matching scales. The envelope of these variations is taken as the theoretical uncertainty on the predicted yield in each SR, with total uncertainties on the background estimation of 2-4% for
Z+jets, 4% for diboson, and∼1% for
t¯t+Vsamples. As the diboson and
tt¯
+Vsamples are not normalized in the CRs, the uncertainty on the theoretical cross section is also included. The uncertainty on the NLO cross section is found to be 6% for the diboson process [81] and 13% for the
t¯t+Vprocess [49]. A 50% uncertainty is applied to the small
W+jets yield in both SRs.The cross section uncertainties on the scalar top signal models are derived from the envelope of cross section predictions from several distinct PDF sets and varying the factorization and renormalization scales, as described in Ref. [34]. The uncertainty on the cross section varies from 13% for the 600 GeV mass point to 27% for the 1.6 TeV mass point.
8 Results
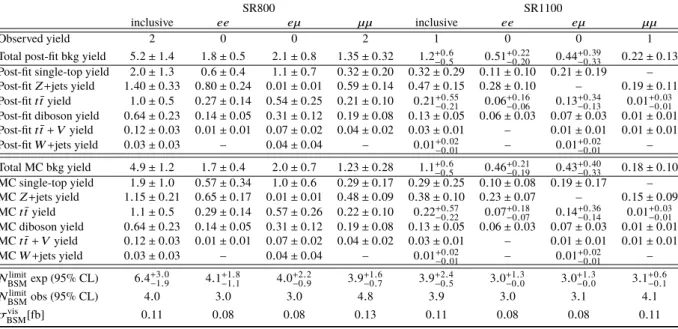
The observed yield and fitted background prediction in SR800 and SR1100 are shown in Table 3. One event is observed in SR1100 and two are observed in SR800, in agreement with the SM prediction. The SR1100 event is included in SR800 by definition, and both events are found in the
µµchannel. The observed and predicted
m0b`,
HT,
masymb`,
m``, and
m1b`(rej) distributions in SR800 are shown in Fig. 2.
For each SR, model-independent upper limits are derived on the cross section of potential BSM processes at a 95% confidence level (CL). A likelihood fit is performed to the number of observed events in all three CRs and the target SR, and a generic signal model is assumed to contribute to the SR only. No theoretical or systematic uncertainties are considered for the signal model except the luminosity uncertainty. The observed and expected limits on the number of BSM events, as well as the observed limit on the visible cross section, are shown in the lower rows of Table 3.
Exclusion limits are derived at 95% CL for the ˜
tsignal samples. Limits are obtained through a profile
log-likelihood ratio test using the CL
Sprescription [82], following the simultaneous fit to the CRs and
SR800 SR1100
inclusive ee eµ µµ inclusive ee eµ µµ
Observed yield 2 0 0 2 1 0 0 1
Total post-fit bkg yield 5.2±1.4 1.8±0.5 2.1±0.8 1.35±0.32 1.2+0.6−0.5 0.51+0.22−0.20 0.44+0.39−0.33 0.22±0.13 Post-fit single-top yield 2.0±1.3 0.6±0.4 1.1±0.7 0.32±0.20 0.32±0.29 0.11±0.10 0.21±0.19 – Post-fitZ+jets yield 1.40±0.33 0.80±0.24 0.01±0.01 0.59±0.14 0.47±0.15 0.28±0.10 – 0.19±0.11 Post-fitt¯tyield 1.0±0.5 0.27±0.14 0.54±0.25 0.21±0.10 0.21+0.55−0.21 0.06+0.16−0.06 0.13+0.34−0.13 0.01+0.03−0.01 Post-fit diboson yield 0.64±0.23 0.14±0.05 0.31±0.12 0.19±0.08 0.13±0.05 0.06±0.03 0.07±0.03 0.01±0.01 Post-fitt¯t+Vyield 0.12±0.03 0.01±0.01 0.07±0.02 0.04±0.02 0.03±0.01 – 0.01±0.01 0.01±0.01 Post-fitW+jets yield 0.03±0.03 – 0.04±0.04 – 0.01+0.02−0.01 – 0.01+0.02−0.01 – Total MC bkg yield 4.9±1.2 1.7±0.4 2.0±0.7 1.23±0.28 1.1+0.6−0.5 0.46+0.21−0.19 0.43+0.40−0.33 0.18±0.10 MC single-top yield 1.9±1.0 0.57±0.34 1.0±0.6 0.29±0.17 0.29±0.25 0.10±0.08 0.19±0.17 – MCZ+jets yield 1.15±0.21 0.65±0.17 0.01±0.01 0.48±0.09 0.38±0.10 0.23±0.07 – 0.15±0.09 MCtt¯yield 1.1±0.5 0.29±0.14 0.57±0.26 0.22±0.10 0.22+0.57−0.22 0.07+0.18−0.07 0.14+0.36−0.14 0.01+0.03−0.01 MC diboson yield 0.64±0.23 0.14±0.05 0.31±0.12 0.19±0.08 0.13±0.05 0.06±0.03 0.07±0.03 0.01±0.01 MCtt¯+Vyield 0.12±0.03 0.01±0.01 0.07±0.02 0.04±0.02 0.03±0.01 – 0.01±0.01 0.01±0.01 MCW+jets yield 0.03±0.03 – 0.04±0.04 – 0.01+0.02−0.01 – 0.01+0.02−0.01 – Nlimit
BSMexp (95% CL) 6.4+3.0−1.9 4.1+1.8−1.1 4.0+2.2−0.9 3.9+1.6−0.7 3.9+2.4−0.5 3.0+1.3−0.0 3.0+1.3−0.0 3.1+0.6−0.1 Nlimit
BSMobs (95% CL) 4.0 3.0 3.0 4.8 3.9 3.0 3.1 4.1
σvis
BSM[fb] 0.11 0.08 0.08 0.13 0.11 0.08 0.08 0.11
Table 3: The observed and expected background yields in SR800 and SR1100. Both the pre-fit MC expectation and post-fit yields are shown, with each broken down into single-top,Z+jets,tt¯, diboson,tt¯+VandW+jets background processes. Model-independent expected and observed limits are set at a 95% CL on the number of events (Nlimit
BSM) and on the visible cross section (σvis
BSM) of a generic BSM process. Results are shown in each flavor channel and inclusively. The background estimates and their uncertainties are derived from a background-only fit configuration.
a target SR [76]. The signal contribution in both the SR and CRs is accounted for in the fit, though is negligible in the latter. Exclusion fits are performed separately for various branching ratio assumptions, sampling values of
Br(t˜
→ be),
Br(t˜
→bµ), and
Br(˜t → bτ), whose sum is unity, in steps of 5%, and reweighting events in the signal samples according to the generated decays. For both SR800 and SR1100, limits are derived in the
ee,
eµ,
µµ, and inclusive channels. Observed limits are reported for the SR and channel combination with the lowest expected CL
Svalue, and therefore best expected sensitivity, at a given mass point and branching ratio. The inclusive channel typically has the largest expected sensitivity when
Br(t˜
→be)and
Br(t˜
→bµ)are both above 15%, while the
ee(
µµ) channel is more sensitive when
Br(˜t→bµ)(
Br(t˜
→be)) is below 15%.
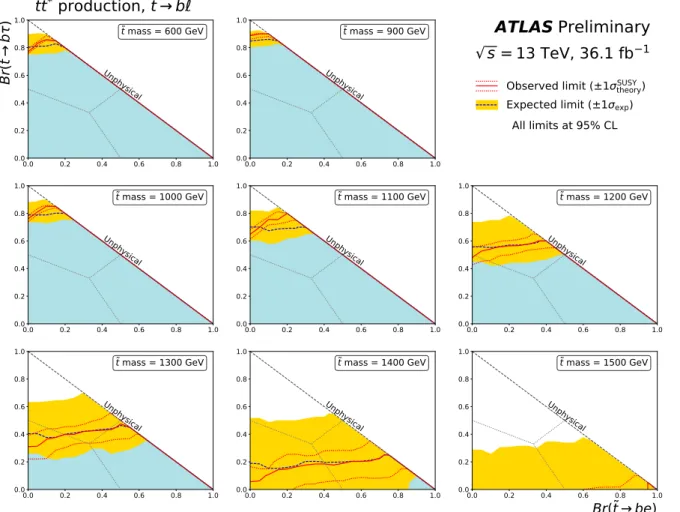
The expected and observed exclusion contours on the branching fraction are shown in Fig. 6 for each
simulated ˜
tmass. The limits are strongest at low values of
Br(t˜
→ bτ), when the number of expected
events with electrons or muons in the final state is largest. Expected limits are slightly stronger for
increasing
Br(˜t→be), reflecting a better efficiency in the trigger and identification efficiency of electrons
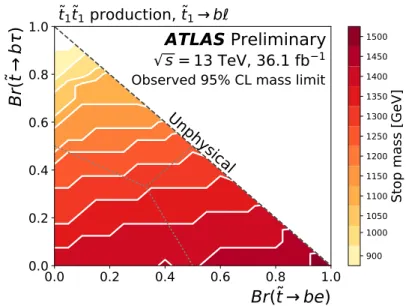
over muons. Exclusion contours reflecting the highest ˜
tmass excluded at a 95% CL for a given point in
the branching ratio plane are shown in Fig. 7.
0.0 0.2 0.4 0.6 0.8 1.0 0.0
0.2 0.4 0.6 0.8 1.0
Br (t b )
t mass = 600 GeVUnphysical
All limits at 95% CL Observed limit (±1
theorySUSY) Expected limit (±1
exp)
0.0 0.2 0.4 0.6 0.8 1.0
0.0 0.2 0.4 0.6 0.8
1.0 t mass = 900 GeV
Unphysical
0.0 0.2 0.4 0.6 0.8 1.0
0.0 0.2 0.4 0.6 0.8
1.0 t mass = 1000 GeV
Unphysical
0.0 0.2 0.4 0.6 0.8 1.0
0.0 0.2 0.4 0.6 0.8
1.0 t mass = 1100 GeV
Unphysical
0.0 0.2 0.4 0.6 0.8 1.0
0.0 0.2 0.4 0.6 0.8
1.0 t mass = 1200 GeV
Unphysical
0.0 0.2 0.4 0.6 0.8 1.0
0.0 0.2 0.4 0.6 0.8
1.0 t mass = 1300 GeV
Unphysical
0.0 0.2 0.4 0.6 0.8 1.0
0.0 0.2 0.4 0.6 0.8
1.0 t mass = 1400 GeV
Unphysical
0.0 0.2 0.4 0.6 0.8 1.0
Br(t be)
0.0 0.2 0.4 0.6 0.8
1.0 t mass = 1500 GeV
Unphysical
ATLAS Preliminary s = 13 TeV, 36.1 fb 1 tt * production, t b
Figure 6: Expected (dashed blue) and observed (solid red) limit curves as a function of ˜tbranching ratios for various mass values between 600 and 1500 GeV. The sum of Br(t˜→ be), Br(t˜→ bτ), and Br(t˜→ bµ) is assumed to be unity everywhere, and points of equality are marked by a dotted gray line. The shaded blue area under the observed limit curve represents the branching ratios which are excluded at 95% CL. The yellow band reflects the
±1σuncertainty on the expected limit due to theoretical, experimental, and MC statistical uncertainties. The dotted red lines correspond to the±1σcross section uncertainty on the observed limit derived by varying the signal cross section by the theoretical uncertainties.
0.0 0.2 0.4 0.6 0.8 1.0
Br(t be)
0.0 0.2 0.4 0.6 0.8 1.0
Br (t b )
Unphysical
Observed 95% CL mass limit
900 1000 1050 1100 1150 1200 1250 1300 1350 1400 1450 1500
Stop mass [GeV]
ATLAS Preliminary
s = 13 TeV, 36.1 fb 1 t 1 t 1 production, t 1 b
Figure 7: The observed mass limit on the ˜tat 95% CL as a function of ˜tbranching ratios. The sum ofBr(t˜→be), Br(t˜→ bτ), and Br(t˜→ bµ)is assumed to be unity everywhere, and points of equality are marked by a dotted gray line. This limit is obtained using the nominal ˜tcross section prediction. The mass limit shown corresponds to the highest-mass sample which is excluded. As the branching ratioBr(˜t →bτ)increases, the number of expected events with electrons or muons in the final state decreases, reducing the mass reach of the exclusion.