A TLAS-CONF-2020-034 11 August 2020
ATLAS CONF Note
ATLAS-CONF-2020-034
10th August 2020
Search for dark matter associated production with a single top quark in √
s = 13 TeV p p collisions with the ATLAS detector
The ATLAS Collaboration
This paper presents a search for dark matter in the context of a two-Higgs-doublet model together with an additional pseudo-scalar mediator, which decays to the dark matter particles ( χ ). Processes where the pseudo-scalar mediator is produced in association with a single top quark are explored for the first time at the LHC. Several final states are considered, including either one or two charged leptons (electrons or muons) and a significant amount of missing transverse momentum. The analysis is based on the data collected with the ATLAS experiment at
√ s = 13 TeV during LHC Run 2 (2015 − 2018), corresponding to an integrated luminosity of 139 fb
−1. No significant excess is found with respect to Standard Model predictions. The results are expressed as 95% confidence level limits on the parameters of the signal models considered.
© 2020 CERN for the benefit of the ATLAS Collaboration.
Reproduction of this article or parts of it is allowed as specified in the CC-BY-4.0 license.
1 Introduction
Strong evidence for the existence of a new, non-luminous matter component of the universe, dark matter (DM), arises from precision measurements of the cosmic microwave background and gravitational lensing measurements. Through its gravitational interactions, it is suggested that DM constitutes up to 26%
of the matter-energy content of the Universe [1, 2]. The nature and properties of DM remain largely unknown in the context of the Standard Model (SM) of particle physics. Under the hypothesis that DM behaves like a weakly interacting massive particle (WIMP), searches are performed using multiple, complementary approaches. At hadron colliders, searches for WIMP-like DM production critically rely on one or more visible particles being produced in association with the sought-after invisible DM candidate.
The experimental signature for DM candidates is missing transverse momentum ( p ®
missT
, its modulus referred to as E
missT
) in collision events. Several models have been proposed in the past decades, with the details of the DM-SM production process depending on the model assumptions.
A class of simplified models for DM searches at the LHC is considered in this paper. It involves a two-Higgs-doublet extended sector together with an additional pseudo-scalar mediator to DM, the 2HDM+ a model [3, 4]. This class of models represents one of the simplest ultra-violet (UV) complete and renormalisable frameworks to investigate the broad phenomenology predicted by spin-0 mediator-based DM models [5–19]. For the present study, a type-II [20, 21] coupling structure of the Higgs sector to third generation fermions is considered. The CP eigenstates are identified with the mass eigenstates, i.e. two scalars h and H , two pseudo-scalars A and a and a charged scalar H
±. Three mixing angles are defined in the model: α denotes the mixing angle between the two CP-even weak spin-0 eigenstates, tan β is the ratio of the vacuum expectation values (VEVs) of the two Higgs doublets and θ represents the mixing angle of the two CP-odd weak spin-0 eigenstates. The alignment (cos (β − α) = 0) and decoupling limit is assumed, such that the lightest CP-even state of the Higgs-sector, h , can be identified with the SM Higgs boson and the electroweak VEV is set to 246 GeV. The pseudo-scalar mediator a couples the DM particles, χ , to the SM and mixes with the pseudo-scalar partner of the SM Higgs boson A . Following the prescriptions in Ref. [10], the masses of the heavy CP-even Higgs boson H and charged bosons H
±are set equal to the mass of the heavy CP-odd partner A .
This set of models offers a rich phenomenology, with a variety of final states that might arise depending on the production and decay modes of the various bosons composing the Higgs sector, as investigated in Ref. [22]. A recent study [23] has shown that final state events characterised by the presence of E
missT
and a single top quark provide a promising sensitivity to 2HDM+ a models. Like for SM single top production, three different types of processes contribute at leading order (LO) in QCD: t -channel production, s -channel production and associated production with a W boson ( tW ). In the following, these are collectively referred to as DM t processes. The t -channel process pp → t j χ χ ¯ receives the dominant contributions from the two diagrams shown in Figures 1(a)–1(b). These two diagrams interfere destructively, ensuring the perturbative unitarity of the pp → t j χ χ ¯ process. The magnitude of the interference decreases with increasing H
±mass.
In the case of the tW production channel, two diagrams provide the dominant contributions to the DM t cross section, shown in Figures 1(c)–1(d). As for the t -channel production, these two diagrams interfere destructively. When the decays H
±→ W
±a are kinematically possible, the charged Higgs bosons are produced on-shell and the cross section of pp → tW χ χ ¯ , assuming H
±masses of a few hundred GeV, increases to a sizeable rate. Finally, s -channel production is relevant in regions of the parameter space characterised by very low a masses and it is not directly targeted by the analysis.
This paper presents a dedicated search for single top quarks produced in association with DM candidates, exploiting final state signatures characterised by the presence of: large E
missT
; jets, possibly arising from
the fragmentation of b -hadrons ( b -jets); and one or two charged leptons, electrons or muons ( ` = e, µ ).
The analysis is conducted using proton-proton ( pp ) collisions at a center-of-mass energy
√ s = 13 TeV produced at the LHC and collected by ATLAS between 2015 and 2018, for a dataset corresponding to 139 fb
−1. Three analysis channels, characterised by different lepton or jet multiplicities, are optimised to target different processes: tW
1Land tW
2L(single- and di-lepton final states, respectively) for the tW +DM events and tj
1Lfor t -channel DM production. The results are interpreted in the context of 2HDM+ a models considering various assumptions on the most relevant parameters, m
a, m
H±, and tan β . Furthermore, the mutually exclusive tW
1Land tW
2Lanalysis channels are statistically combined to maximise the sensitivity to tW +DM processes.
Previous searches for 2HDM+ a models targeted associated production of DM candidates with Higgs or Z bosons, as well as DM and a t¯ t pair (referred to as DM t t ¯ ) (see Ref. [24] for CMS and [22] and references therein for ATLAS). This is the first dedicated search for DM produced in association with single top quarks at ATLAS (for CMS results, see Ref. [25]). The analysis is also sensitive to DM t¯ t processes in regions of the parameter space where the DM t and DM t¯ t production rates are similar.
/a
g b
t
¯ W
Figure 29: Diagram 28
W a
b
¯ q
t
¯
¯ q0
Figure 30: Diagram 29
15
(a)
directly, leading to a di↵erent phenomenology. For completeness, we exam- ine a model where is a Standard Model (SM) singlet, a Dirac fermion; the mediating particle, labeled , is a charged scalar color triplet and the SM parti- cle is a quark. Such models have been studied in Refs. [?,?,?,?,?,?]. However, these models have not been studied as extensively as others in this Forum.
Following the example of Ref. [?], the interaction Lagrangian is written as
W
+H
a
q b
q
0¯ t
W a
b
¯ q
t
¯
¯ q
a
g b
t
¯ W
H a
g b
W
¯ t
1
(b)
directly, leading to a di↵erent phenomenology. For completeness, we exam- ine a model where is a Standard Model (SM) singlet, a Dirac fermion; the mediating particle, labeled , is a charged scalar color triplet and the SM parti- cle is a quark. Such models have been studied in Refs. [?,?,?,?,?,?]. However, these models have not been studied as extensively as others in this Forum.
Following the example of Ref. [?], the interaction Lagrangian is written as
W+ H
a
q b
q
¯ t
W a
b
¯ q
t
¯
¯ q
a
g b
t
¯ W
H a
g b
W
¯ t
(c)
1directly, leading to a di↵erent phenomenology. For completeness, we exam- ine a model where is a Standard Model (SM) singlet, a Dirac fermion; the mediating particle, labeled , is a charged scalar color triplet and the SM parti- cle is a quark. Such models have been studied in Refs. [?,?,?,?,?,?]. However, these models have not been studied as extensively as others in this Forum.
Following the example of Ref. [?], the interaction Lagrangian is written as
W+ H
a
q b
q
¯ t
W a
b
¯ q
t
¯
¯ q
a
g b
t
¯ W
H a
g b
W
¯ t
1
(d)
Figure 1: Representative diagrams of the dark matter particle χ pair-production from the 2HDM+ a model considered in this analysis: (a)–(b) through t -channel, and (c)–(d) through tW-channel.
2 ATLAS detector
The ATLAS detector [26] is a multipurpose particle detector with a forward–backward symmetric cylindrical geometry and nearly 4 π coverage in solid angle.1 The inner tracking detector consists of pixel and microstrip silicon detectors covering the pseudorapidity region |η | < 2 . 5, surrounded by a transition radiation tracker which enhances electron identification in the region |η| < 2 . 0. A new inner pixel layer, the insertable B-layer [27, 28], was added at a mean radius of 3.3 cm during the period between Run 1 and Run 2 of the LHC. The inner detector is surrounded by a thin superconducting solenoid providing an axial 2 T magnetic field and by a fine-granularity lead/liquid-argon (LAr) electromagnetic calorimeter covering
|η| < 3 . 2. A steel/scintillator-tile calorimeter provides hadronic coverage in the central pseudorapidity range ( |η| < 1 . 7). The endcap and forward regions (1 . 5 < |η | < 4 . 9) of the hadronic calorimeter are made of LAr active layers with either copper or tungsten as the absorber material. A muon spectrometer
1
ATLAS uses a right-handed coordinate system with its origin at the nominal interaction point in the center of the detector. The positive
x-axis is defined by the direction from the interaction point to the center of the LHC ring, with the positive
y-axis pointing upwards, while the beam direction defines the
z-axis. Cylindrical coordinates
(r, φ)are used in the transverse plane,
φbeing the azimuthal angle around the
z-axis. The pseudorapidity
ηis defined in terms of the polar angle
θby
η=−ln tan
(θ/2
). Rapidity is defined as
y= 0
.5 ln
[(E+pz)/(E−pz)]where
Edenotes the energy and
pzis the component of the momentum along the beam direction. The angular distance
∆Ris defined as
p(∆y)2+(∆φ)2
.
with an air-core toroid magnet system surrounds the calorimeters. Three layers of high-precision tracking chambers provide coverage in the range |η | < 2 . 7, while dedicated fast chambers allow triggering in the region |η| < 2 . 4. The ATLAS trigger system consists of a hardware-based level-1 trigger followed by a software-based high-level trigger [29].
3 Data and Monte Carlo Simulation
The data analysed in this paper corresponds to an integrated luminosity of 139 fb
−1of pp collision data collected by the ATLAS detector with a centre-of-mass energy of 13 TeV and a 25 ns proton bunch crossing interval in the period between 2015 and 2018. The uncertainty in the combined 2015–2018 integrated luminosity is 1.7 % [30], obtained using the LUCID-2 detector [31] for the primary luminosity measurements. All detector subsystems were required to be operational during data taking. The average number of interactions in the same and nearby bunch crossings (pile-up) increased from hµi = 13 . 4 (2015 dataset) to hµi = 36 . 1 (2018 dataset), with a highest hµi = 37 . 8 (2017 dataset) and an average hµi
= 33 . 7.
Candidate events were recorded using a combined set of triggers [29] based on the presence of missing transverse momentum or charged leptons ( ` = e, µ ). The E
missT
trigger [32] is fully efficient for events with reconstructed E
missT
> 250 GeV and it was used for the single-lepton analysis channels. Furthermore, an OR between E
missT
and single-lepton triggers was used for the tj
1Lchannel for events with reconstructed E
missT
< 250 GeV. Triggers based on single-muon or single-electron require the presence of transverse momentum p
T(muons) and transverse energy E
T(electrons) above certain thresholds, as well as data quality and lepton isolation requirements. The lowest p
T( E
T) threshold without trigger prescaling is 24 (26) GeV for muons (electrons) and includes a lepton isolation requirement that is not applied for triggers with higher thresholds. For the two-lepton channel, lower thresholds on electrons and muons must be applied to retain sensitivity to the signal. A combined set of two-lepton triggers was used, with lepton p
T( E
T) trigger threshold varying depending on the data-taking periods. The lepton p
T( E
T) trigger threshold ranged between 8 and 22 GeV for muons, and between 12 and 24 GeV for electrons. The analysis selections are chosen to guarantee maximum trigger efficiency, generally above 95%. Trigger matching requirements [29]
are applied where the lepton(s) must lie within the vicinity of the corresponding trigger-level object.
Dedicated Monte Carlo (MC) simulated samples are used to model SM processes and estimate the expected signal yields. All samples were produced using the ATLAS simulation infrastructure [33] and GEANT4 [34], or a faster simulation based on a parameterisation of the calorimeter response and GEANT4 for the other detector systems [33]. The simulated events are reconstructed with the same algorithms as that used for data. They contain a realistic modelling of pile-up interactions with pile-up profiles matching the ones of each dataset between 2015 and 2018, obtained by overlaying minimum-bias events simulated using the soft QCD processes of Pythia 8.186 [35] with the NNPDF2.3 LO set of parton distribution functions (PDFs) [36] and the A3 [37] set of tuned parameters.
Signal MC samples for single top-quark in association with DM production include tW , t -channel and
s -channel processes. Samples were produced either varying (m
a, m
H±) parameters and assuming tan β
equal to unity, or varying ( tan β, m
H±) parameters and setting m
a= 250 GeV. Details on other parameters
assumptions are provided in Section 7. They are generated from leading order (LO) matrix elements
using the MadGraph5_aMC@NLO [38] v2.6.2 generator interfaced to Pythia 8.212 [39] with the A14
tune [40] for the modelling of parton showering (PS), hadronisation and the description of the underlying
event. Parton luminosities are provided by the five-flavour scheme NNPDF3.0 NLO [41] PDF set.
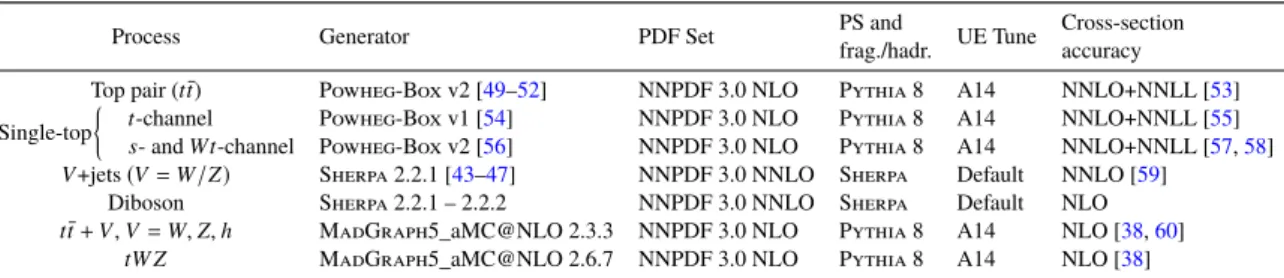
Table 1: List of generators used for the different processes. Diboson includes WW , W Z and Z Z productions.
Information is given about the underlying-event tunes, the PDF sets and the perturbative QCD highest-order accuracy (LO, NLO, next-to-next-to-leading order (NNLO), and next-to-next-to-leading-log (NNLL)) used for the normalization of the different samples. Diboson cross-sections are taken directly from Sherpa.
Process Generator PDF Set PS and
UE Tune Cross-section frag./hadr. accuracy Top pair (tt¯) Powheg-Box v2 [49–52] NNPDF 3.0 NLO Pythia 8 A14 NNLO+NNLL [53]
Single-top
t-channel Powheg-Box v1 [54] NNPDF 3.0 NLO Pythia 8 A14 NNLO+NNLL [55]
s- andWt-channel Powheg-Box v2 [56] NNPDF 3.0 NLO Pythia 8 A14 NNLO+NNLL [57,58]
V+jets(V=W/Z) Sherpa 2.2.1 [43–47] NNPDF 3.0 NNLO Sherpa Default NNLO [59]
Diboson Sherpa 2.2.1 – 2.2.2 NNPDF 3.0 NNLO Sherpa Default NLO t¯t+V,V=W,Z,h MadGraph5_aMC@NLO 2.3.3 NNPDF 3.0 NLO Pythia 8 A14 NLO [38,60]
tW Z MadGraph5_aMC@NLO 2.6.7 NNPDF 3.0 NLO Pythia 8 A14 NLO [38]
Signal cross sections are calculated to LO accuracy in QCD. Additional simulated samples are used for DM t t ¯ processes. They are generated using a LO matrix element, with up to one extra parton using the MadGraph5_aMC@NLO v2.6.7 generator interfaced to Pythia 8.244 with the same PDF set and tune used for the tW , t - and s -channel processes. The top-quark decay is simulated using MadSpin [42]. In this case, signal cross sections are calculated to next-to-leading order (NLO) accuracy using the same version of MadGraph5_aMC@NLO as suggested in Ref. [16].
Background samples were simulated using different MC event generators depending on the process.
All background processes are normalised to the best available theoretical calculation of their respective cross sections. The event generators, the accuracy of theoretical cross sections, the underlying-event parameter tunes, and the PDF sets used in simulating the SM background processes most relevant for this analysis are summarised in Table 1. For all samples, except those generated using Sherpa [43–47], the EvtGen v1.2.0 [48] program was used to simulate the properties of the b - and c -hadron decays.
4 Event reconstruction and object definitions
Common event-quality criteria and object reconstruction definitions are applied for all analysis channels, including standard data-quality requirements to select events taken during optimal detector operation.
In addition, in each analysis channel, dedicated selection criteria, which are specific to the objects and kinematics of interest in those final states, are applied as described in Section 5.
Events are required to have at least one reconstructed interaction vertex with a minimum of two associated tracks each having p
T> 500 MeV. In events with multiple vertices, the one with the highest sum of squared transverse momenta of associated tracks is chosen as the primary vertex (PV) [61]. A set of baseline quality criteria are applied to reject events with non-collision backgrounds or detector noise [62].
Two levels of object identification requirements are defined for leptons and jets, baseline and signal.
Baseline leptons and jets are selected with looser identification criteria, and are used in computing the
missing transverse momentum as well as in resolving possible reconstruction ambiguities. Signal leptons
and jets are a subset of the baseline objects with tighter quality requirements which are used to define the
search regions. Isolation criteria, defined with a list of tracking-based and calorimeter-based variables,
are used to select signal leptons by discriminating against semileptonic heavy-flavour decays and jets misidentified as leptons.
Electron candidates are reconstructed from energy deposits in the electromagnetic calorimeter that are matched to charged-particle tracks in the inner detector (ID) [63]. Baseline electrons are required to satisfy p
T> 10 GeV and |η| < 2 . 47. The transition region between the barrel and endcap calorimeters (1 . 37 < |η| < 1 . 52) is excluded. They are identified using the ‘loose’ likelihood identification operation point as described in Ref. [63]. The number of hits in the innermost pixel layer is used to discriminate between electrons and converted photons. The longitudinal impact parameter z
0relative to the PV is required to satisfy |z
0sin θ | < 0 . 5 mm. Signal electrons are required to further satisfy p
T> 20 GeV and the
‘tight’ likelihood identification criteria as defined in Ref. [63]. The significance of the transverse impact parameter d
0must satisfy |d
0/σ(d
0)| < 5 for signal electrons. Signal electrons with p
T< 200 GeV are further refined using the ‘FCLoose’ isolation working point, while those with larger p
Tare required to pass the ‘FCHighPtCaloOnly’ isolation working point, as described in Ref. [63]. Corrections for energy contributions due to pile-up are applied.
Muon candidates are reconstructed from matching tracks in the ID and muon spectrometer, refined through a global fit which uses the hits from both subdetectors [64]. Baseline muons must have p
T> 10 GeV and
|η| < 2 . 5, and satisfy the ‘medium’ identification criteria. Similar to electrons, the longitudinal impact parameter z
0relative to the PV is required to satisfy | z
0sin θ | < 0 . 5 mm. Signal muons are further defined with tighter requirements on their transverse momentum and transverse impact parameter significance, p
T> 20 GeV and | d
0/σ(d
0)| < 3. The ‘FCLoose’ isolation working point is also required for signal muons [64].
Jets are reconstructed from topological clusters of energy depositions in the calorimeters using the anti- k
talgorithm [65], with a radius parameter R = 0 . 4 [66]. The average energy contribution from pile-up is subtracted according to the jet area and the jets are calibrated as described in Ref. [67]. To further reduce the effect of pile-up interactions, the jets with |η| < 2 . 4 and p
T< 120 GeV are required to satisfy the
‘medium’ working point of the jet vertex tagger (JVT), a tagging algorithm that identifies jets originating from the PV using track information [68, 69]. Baseline jets are selected in the region |η| < 4 . 5 and have p
T> 20 GeV. The selection of signal jets is further refined by requiring them to be in the region |η | < 2 . 5 and have p
T> 30 GeV.
Jets containing b -hadrons are identified as arising from b -hadrons (‘ b -tagged’) using a multivariate algorithm (MV2c10), based on the track impact parameters, the presence of displaced secondary vertices and the reconstructed flight path of b and c hadrons inside the jet [70]. These b -tagged jets are reconstructed in the region |η| < 2 . 5 and have p
T> 20 GeV. The b -tagging working point provides an efficiency of 77%
for jets containing b -hadrons in simulated t t ¯ events, with average rejection of 110 and 4.9 for light-flavour jets and jets containing c -hadrons, respectively [71].
To resolve the reconstruction ambiguities between electrons, muons and jets, an overlap removal procedure is applied to baseline objects in a prioritised sequence as follows. First, if an electron shares the same ID track with another electron, the one with lower p
Tis discarded. Any electron sharing the same ID track with a muon is rejected. Next, jets that are not b -tagged are rejected if they lie within ∆R = 0 . 2 of an electron. Similarly, jets that are not b -tagged are rejected if they lie within ∆R = 0 . 2 of a muon if the jet has fewer than three associated tracks or the muon is matched to the jet through ghost association [72].
Finally, electrons and muons that are close to a remaining jet are discarded, if their distance from a jet is
within ∆R = min ( 0 . 4 , 0 . 04 + 10 GeV /p
T) as a function of the lepton p
T.
The missing transverse momentum p ®
missT
, with magnitude E
missT
, is calculated as the negative vectorial sum of the transverse momentum of all baseline reconstructed objects (electrons, muons, jets and photons [73]) and the soft term. The soft term includes all tracks associated with the PV but not matched to any reconstructed physics object. Tracks not associated with the PV are not considered in the E
missT
calculation, improving the E
missT
resolution by suppressing the effect of pile-up [74, 75].
To compensate for differences between data and simulation in trigger, particle identification and reconstruc- tion efficiency, correction factors usually as functions of the relevant kinematic variables, are derived from data and applied to the samples of simulated events.
5 Analysis strategy
The search is conducted in three independent analysis channels differing by lepton and jet multiplicities to maximise the sensitivity to distinct signal processes. The tW
1Lanalysis channel targets tW +DM events where one of the W bosons (directly produced or arising from the top quark decay) decays leptonically (Section 5.2). The tW
2Lanalysis channel targets the same signal processes, but considers both W bosons in the events decaying leptonically (Section 5.3). The two selections are designed to be mutually exclusive.
The results of these two analysis channels are statistically combined to maximise the sensitivity to the tW +DM processes. Finally, the tj
1Lanalysis targets t -channel production of DM candidates and requires also a single lepton in the events (Section 5.4). In all analysis channels, large missing transverse momentum and jets are required. Event selections and background estimation methods specific to each analysis channel are described in this section, as well as the signal, control, and validation region definitions (SR, CR, and VR, respectively).
Dedicated CRs are designed in each analysis channel for the major SM background processes to predict their expected contribution in the SRs. Mutually exclusive to the SRs, the CRs are enriched in the major background processes relevant to each analysis channel while minimising the signal contamination. The potential signal contamination in the CRs is found to be negligible, at the level of < 3% of the total SM expectation for all analysis channels.
The expected SM backgrounds are first determined separately and independently for each channel, with a profile likelihood fit [76], referred to as a background-only fit. In this fit, normalisation factors of the backgrounds, for which dedicated CRs are defined, are adjusted simultaneously to match the data in the associated CRs. The input to the background-only fit includes the number of events observed in the associated CRs and the number of events predicted by simulation in each CR for all background processes.
They are both described by Poisson statistics. The systematic uncertainties, described in Section 6, are included in the fit as nuisance parameters. They are constrained by Gaussian distributions with widths corresponding to the sizes of the uncertainties and are treated as correlated, when appropriate, between the various regions. The product of the various probability density functions forms the likelihood, which the fit maximises by adjusting the background normalisation and the nuisance parameters.
Normalisation and nuisance parameters in the control regions are then used to constrain the corresponding backgrounds in the signal regions. The reliability of the MC extrapolation of the SM background estimates outside of the control regions is verified in dedicated validation regions. Statistically independent from the corresponding CRs and SRs, these VRs are designed to probe a kinematic region closer to that of the SRs.
The potential signal contamination in the VRs is at the level of < 1% of the total SM expectation for most
validation regions, and between 8% and 15% in a few validation regions in the tW
1Lanalysis channel.
In the absence of a significant event excess in the SRs concluded from the background-only fit, upper limits on the interesting properties of the targeted signal models as well as a generic BSM process will be extracted from simultaneous fits of the CRs and SRs, referred to as model-dependent and model-independent signal fits as detailed in Section 7.
5.1 Kinematic requirements and event variables
The event selection criteria in each analysis channel are defined based on the physics objects described in Section 4 and the event variables defined in this section.
The following variables are defined based on simple combinations of the physics objects in the events.
• N
jetis the number of jets with |η| < 2 . 5 and p
T> 30 GeV.
• N
forwardjet
is the number of jets in the forward region, 2 . 5 < |η| < 4 . 5 and p
T> 30 GeV.
• N
b-jetis the number of b -jets with |η| < 2 . 5 and p
Tabove a given threshold defined in each analysis channel.
• The minimum azimuthal distance ∆φ
minbetween the p ®
missT
and the p ®
Tof each of the four leading jets in the event is useful for rejecting events with mismeasured jet energies leading to E
missT
in the event, and is defined as,
∆ φ
min= min
i≤4∆ φ
® p
missT
, p ®
jetT,i
,
where min
i≤4selects the jet that minimises ∆φ .
• m
``is the invariant mass of the dilepton system in the event.
• An iterative reclustering approach as defined in Ref. [77] is used to reconstruct the hadronically decaying W bosons. All the signal jets in the event are first reclustered using the anti- k
talgorithm with a large distance parameter of R = 3 . 0. The radius of each large-radius jet is then iteratively reduced to an optimal radius, R(p
T) = 2 × m
W/p
T. The mass of the reclustered jet, m
reclusteredW
, is used in the tW
1Lchannel.
• m
`1b1is the invariant mass of the leading lepton and b -jet of the event.
A set of transverse mass based variables are defined to distinguish between the signal and SM background processes in the following.
• The transverse mass formed by the p ®
missT
and the leading lepton in the event, m
lepT
, is used to reduce the W +jets and semileptonic t¯ t backgrounds. It is defined as:
m
lepT
= q
2 p
`T
E
missT
1 − cos ∆φ( ® p
`T
, p ®
missT
) .
• Similarly, the transverse mass m
`bT
is formed by the p ®
missT
and the system of the leading lepton and b -jet in the event to suppress the W + b background, and is defined as,
m
`bT
=
r 2 p
`1+b1T
E
missT
1 − cos ∆φ( ® p
`1+b1T
, p ®
missT
)
.
• Closely related to m
lepT
, the stransverse mass, m
T2[78, 79], is used to bound the masses of pair- produced particles such as the t¯ t production, each of which decays into a visible particle that can be detected and an invisible particle that contributes to the missing transverse momentum. In the case of a dilepton final state, it is defined by:
m
T2( ® p
`1T
, p ®
`2T
, p ®
missT
) = min
q®T
h max
m
lepT
( ® p
`1T
, q ®
T), m
lepT
( ® p
`2T
, p ®
missT
− ® q
T) i ,
where q ®
Tis the transverse vector that minimises the larger of the two transverse masses m
lepT
, and p ®
`1T
and p ®
`2T
are the leading and subleading transverse momenta of the two leptons in the pair.
• The asymmetric stransverse mass am
T2[80, 81], a variation of m
T2, is used in the tW
1Lfinal state to reduce the di-leptonic t¯ t background events where one of the leptons is undetected. For these events, am
T2has a kinematic endpoint at the top quark mass.
To improve the selection of single top events in the tW
2Lchannel the following invariant mass based quantities are defined.
• m
minb`is the minimum invariant mass of the leading b -jet with each of the leptons, m
minb`= min (m
b1`1, m
b1`2) . An upper endpoint at approximately 153 GeV or 160 − 170 GeV is expected for the events with one or two leptonic top quark decays, respectively.
• To further reduce the background with two leptonic top decays, such as t t ¯ and t¯ tV , m
tb`, an extended variation of m
minb`, is used in the tW
2Lfinal state. It is defined as:
m
tb`= min ( max (m
`1j1, m
`2j2), max (m
`1j2, m
`2j1)),
where m
`njmis the invariant mass of lepton `
nand jet j
mand j
1, j
2are the two jets with highest b -tag discriminator value. For the t¯ t and t tV ¯ background where both top quarks decay leptonically, m
tb`has a kinematic endpoint at approximately 160 − 170 GeV.
Additional variables based on angular separations of the objects are used in the tj
1Lanalysis to suppress SM background contributions, as defined below.
• ∆η(`
1, b
1) , ∆φ(`
1, b
1) , and ∆R(`
1, b
1) : the pseudorapidity difference, azimuthal angle difference, and angular distance between the leading lepton and b -jet of the event.
• ∆φ(`
1, p ®
missT
) : the azimuthal angle difference between the p ®
missT
and the leading lepton in the event.
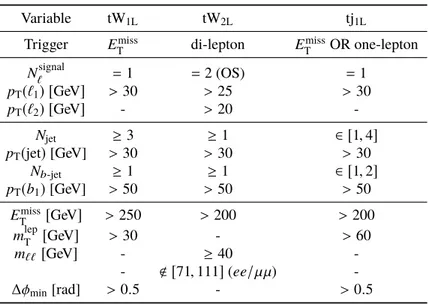
Table 2 summarises the trigger and preselection requirements for all analysis channels, in terms of lepton,
jet and b -jet multiplicities, as well as transverse momenta and global kinematic variables.
Table 2: Summary of the trigger and preselection requirements for the three analysis channels. Opposite sign leptons are indicated as (OS). Events with additional baseline leptons are vetoed in addition.
Variable tW
1LtW
2Ltj
1LTrigger E
missT
di-lepton E
missT
OR one-lepton
N
`signal= 1 = 2 (OS) = 1
p
T(`
1) [ GeV ] > 30 > 25 > 30
p
T(`
2) [ GeV ] - > 20 -
N
jet≥ 3 ≥ 1 ∈ [ 1 , 4 ]
p
T( jet ) [GeV] > 30 > 30 > 30
N
b-jet≥ 1 ≥ 1 ∈ [ 1 , 2 ]
p
T(b
1) [GeV] > 50 > 50 > 50 E
missT
[ GeV ] > 250 > 200 > 200
m
lepT
[ GeV ] > 30 - > 60
m
``[ GeV ] - ≥ 40 -
- < [ 71 , 111 ] ( ee/µµ ) -
∆φ
min[rad] > 0 . 5 - > 0 . 5
5.2 Single lepton tW
1Lanalysis channel
Events with exactly one electron or muon are selected first for the SR if they also contain at least three jets, exactly one of which must be b -tagged, and satisfy the preselection requirements described in Table 2. The dominant SM background contributions in the channel are t¯ t , W +jets, and single-top ( Wt channel) production. Discriminating variables, E
missT
, m
lepT
, m
reclusteredW
and the asymmetric stransverse mass am
T2as described in Section 5.1, are used to further separate the signal from backgrounds. A Genetic Algorithm [82] is used to optimise a baseline signal region defined as in Table 3. To increase the sensitivity to different signal model parameters, a binned E
missT
distribution is used as the final input for the statistical analysis. The binning is chosen to be [ 250 , 300 ] GeV, [ 300 , 400 ] GeV, [ 400 , 500 ] GeV, [ 500 , 600 ] GeV and
≥ 600 GeV, referred to as Bins [0 − 4].
The acceptance times detector efficiency for the tW +DM signal processes after applying all selection criteria is between 0.3% and 5.1% in the parameter space of tan β = 1, m
a∈ [100, 450] GeVand m
H±∈ [400, 1500] GeV, and between 0.2% and 4.8% in the parameter space of m
a= 250 GeV, tan β ∈ [0.5, 30]
and m
H±∈ [400, 1500] GeV.
Dominant background contributions from the t t ¯ and W +jets processes are estimated using MC simulation and the dedicated CRs. The contribution from multijet production, where the lepton is misidentified as a jet or originates from a heavy-flavour hadron decay or photon conversion, is found to be negligible. The remaining sources of background (single-top, Z +jets, diboson, t¯ tV , t t h ¯ and tW Z production, as well as rarer processes such as triboson, t t t ¯ t ¯ and t¯ t WW ), are estimated from simulation.
Dedicated control regions CR
tW1L( t¯t ) and CR
tW1L( W ) , defined in Table 3, are designed for the t t ¯ and W +jets background estimations. The acceptance for t¯ t events is increased in CR
tW1L( t¯t ) by requiring at least two b -jets, inverting the selection on am
T2and removing the requirement on m
reclusteredW
. To increase the acceptance of the W +jets events and statistics, CR
tW1L( W ) is first selected by 40 < m
lepT
< 100 GeV and
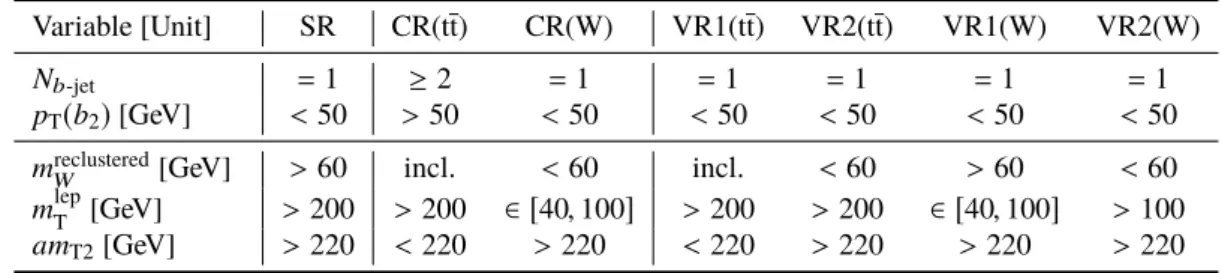
Table 3: Summary of signal, control and validation region definitions used in the tW
1Lanalysis channel. The entry of
‘incl.’ represents an inclusive selection with no requirements. The W +jets control and validation regions are further split into regions with opposite lepton charges as described in the text.
Variable [Unit] SR CR(t¯t) CR(W) VR1(t¯t) VR2(t¯t) VR1(W) VR2(W)
N
b-jet= 1 ≥ 2 = 1 = 1 = 1 = 1 = 1
p
T(b
2) [GeV] < 50 > 50 < 50 < 50 < 50 < 50 < 50 m
reclusteredW
[GeV] > 60 incl. < 60 incl. < 60 > 60 < 60
m
lepT
[GeV] > 200 > 200 ∈ [ 40 , 100 ] > 200 > 200 ∈ [ 40 , 100 ] > 100 am
T2[GeV] > 220 < 220 > 220 < 220 > 220 > 220 > 220
m
reclusteredW
< 60 GeV. To further exploit the lepton charge asymmetry of the W +jets events with respect to the remaining backgrounds, it is subsequently split into regions with opposite lepton charges, CR
tW1L( W
+) and CR
tW1L( W
−) . Normalisation factors, µ
tt¯
and µ
W+jets, defined as the ratio of the number of observed events to the SM prediction, are found to be 0 . 96 ± 0 . 08 and 1 . 01 ± 0 . 05 after the background-only fit for the t¯ t and W +jets processes, respectively.
To validate the t¯ t background predictions and the reliability of MC extrapolation in m
reclusteredW
and am
T2two validation regions, VR1
tW1L( t¯t ) and VR2
tW1L( t¯t ) , are defined by reversing the SR selection requirements on am
T2and m
reclusteredW
as shown in Table 3, respectively. To increase the statistics, the SR selection requirement on the m
reclusteredW
is removed in the VR1
tW1L( t¯t ) region. Similarly, for the W +jets background processes, two validation regions, VR1
tW1L( W ) and VR2
tW1L( W ) , are defined by varying the SR selection requirements on m
lepT
and m
reclusteredW
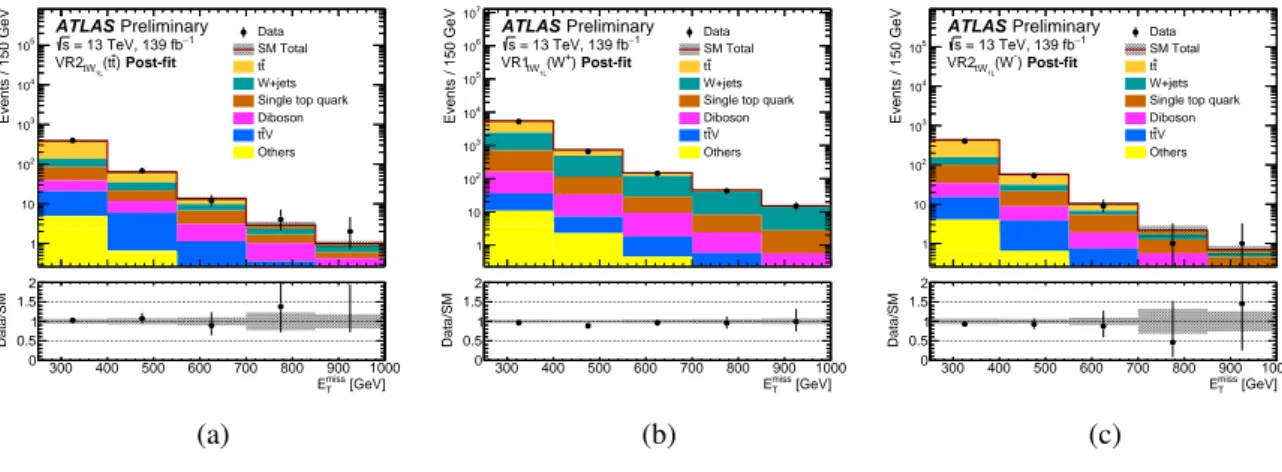
shown in Table 3, respectively. Each of the W +jets validation regions is further split into two regions by the lepton charge. Figure 2 shows the post-fit E
missT
distributions in the representative validation regions. Good agreement is observed between data and SM expectation in all validation regions. The observed yields, post-fit background estimations and significance [83] in each CR and VR are shown in Figure 3 after the background-only fit. As the W +jets CR is further split into two regions with opposite lepton charges sharing the same normalisation factor, the significance in the CRs are explicitly shown. The data event yields are found to be consistent with background expectations.
5.3 Dilepton tW
2Lanalysis channel
Events with exactly two oppositely charged leptons (electron or muon) are selected first for the SR if they also contain at least one signal jet, at least one of which must be b -tagged with p
T> 50 GeV, and satisfy the preselection requirements as described in Table 2. The dominant SM background contributions in the channel after these selections are from the t t ¯ , t¯ t Z and tW Z processes, followed by that of diboson events.
The contribution from misidentified or non-prompt lepton backgrounds (referred to as ‘Fakes /non-prompt’
in Figures) is found to be negligible in the signal region.
Discriminating variables, m
minb`, m
tb`, m
T2and ∆φ
minas defined in Section 5.1, are used to define the final signal region as shown in Table 4.
The acceptance times detector efficiency after applying all selection criteria for the tW +DM signal processes
is between 0.07% and 0.7% in the parameter space of tan β = 1, m
a∈ [100, 450] GeVand m
H±∈ [400,
Events / 150 GeV
1 10 102 103 104 105
Data SM Total
t t W+jets Single top quark Diboson
V t t Others Preliminary ATLAS
−1 = 13 TeV, 139 fb s
Post-fit ) t
1L(t VR2tW
[GeV]
miss ET
300 400 500 600 700 800 900 1000
Data/SM
0 0.5 1 1.5 2
(a)
Events / 150 GeV
1 10 102 103 104 105 106 107
Data SM Total
t t W+jets Single top quark Diboson
V t t Others Preliminary ATLAS
−1 = 13 TeV, 139 fb s
Post-fit +)
1L(W VR1tW
[GeV]
miss ET
300 400 500 600 700 800 900 1000
Data/SM
0 0.5 1 1.5 2
(b)
Events / 150 GeV
1 10 102 103 104 105
Data SM Total
t t W+jets Single top quark Diboson
V t t Others Preliminary ATLAS
−1 = 13 TeV, 139 fb s
Post-fit -)
1L(W VR2tW
[GeV]
miss ET
300 400 500 600 700 800 900 1000
Data/SM
0 0.5 1 1.5 2
(c)
Figure 2: The E
missT
distributions after the background-only fit, post-fit, are shown in three representative validation regions: (a)VR2
tW1L( t¯t ) , (b)VR1
tW1L( W
+) and (c)VR2
tW1L( W
−) . The uncertainty bands plotted include all statistical and systematic uncertainties. The ‘Others’ category includes contributions from Z +jets, tW Z productions and rare processes such as triboson, Higgs boson production processes, t t t¯ ¯ t and t t WW ¯ . The overflow (underflow) events, where present, are included in the last (first) bin.
) t (t
tW1L
CR (W+)
tW1L
CR (W-)
tW1L
CR (tt)
tW1L
VR1 (tt)
tW1L
VR2 (W+)
tW1L
VR1 (W-)
tW1L
VR1 (W+)
tW1L
VR2 (W-)
tW1L
VR2
Events
10 102
103
104
105
106
Data SM Total t t
Single top quark W+jets Diboson V
t
t Others
=13 TeV, 139 fb-1
s
Preliminary ATLAS
Post-fit
) t (t
tW1L
CR (W+)
tW1L
CR (W-)
tW1L
CR (tt)
tW1L
VR1 (tt)
tW1L
VR2 (W+)
tW1L
VR1 (W-)
tW1L
VR1 (W+)
tW1L
VR2 (W-)
tW1L
Significance VR2
−2 0 2
Figure 3: Comparison of the predicted backgrounds with the observed numbers of events in the CRs and VRs associated with the tW
1Lchannel. The normalisation of the backgrounds is obtained from the fit to the CRs. The
‘Others’ category includes contributions from Z +jets, tW Z productions and rare processes such as triboson, Higgs boson production processes, t t t ¯ t ¯ and t¯ t WW . The upper panel shows the observed number of events and the predicted background yield. All uncertainties are included in the uncertainty band. The lower panel shows the significances in each region.
1500] GeV, and between 0.05% and 0.6% in the parameter space of m
a= 250 GeV, tan β ∈ [0.5, 30] and
m
H±∈ [400, 1500] GeV.
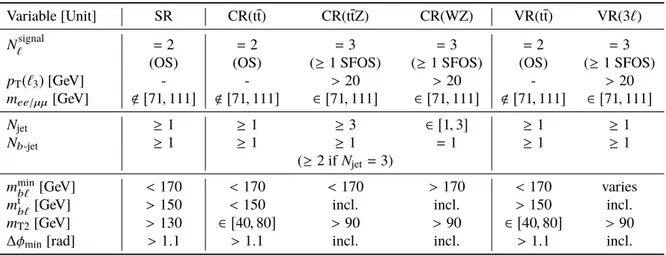
Table 4: Summary of signal, control and validation region definitions used in the tW
2Lanalysis channel. The entry of
‘incl.’ represents an inclusive selection with no requirements. In the final states with three leptons, the corrected variables of E
missT
, m
minb`and m
T2are used instead as described in the main text. The selection requirement on the corrected m
minb`in the VR ( 3 `) region varies according to the jet and b -jet multiplicity as described in the main text.
Events with additional baseline leptons are vetoed in addition.
Variable [Unit] SR CR(t¯t) CR(t¯tZ) CR(WZ) VR(t¯t) VR(3 ` )
N
`signal= 2 = 2 = 3 = 3 = 2 = 3
(OS) (OS) ( ≥ 1 SFOS) ( ≥ 1 SFOS) (OS) ( ≥ 1 SFOS)
p
T(`
3) [GeV] - - > 20 > 20 - > 20
m
ee/µµ[GeV] < [ 71 , 111 ] < [ 71 , 111 ] ∈ [ 71 , 111 ] ∈ [ 71 , 111 ] < [ 71 , 111 ] ∈ [ 71 , 111 ]
N
jet≥ 1 ≥ 1 ≥ 3 ∈ [ 1 , 3 ] ≥ 1 ≥ 1
N
b-jet≥ 1 ≥ 1 ≥ 1 = 1 ≥ 1 ≥ 1
( ≥ 2 if N
jet= 3)
m
minb`[GeV] < 170 < 170 < 170 > 170 < 170 varies
m
tb`[GeV] > 150 < 150 incl. incl. > 150 incl.
m
T2[GeV] > 130 ∈ [ 40 , 80 ] > 90 > 90 ∈ [ 40 , 80 ] > 90
∆φ
min[rad] > 1 . 1 > 1 . 1 incl. incl. > 1 . 1 incl.
The contributions from the t¯ t , t¯ tV (with V = W or Z boson) and diboson background processes are estimated from MC simulation and dedicated CRs. The remaining sources of background, including the irreducible tW Z process which is dominated by the Z → νν component, single top quark productions, t¯ t h productions and other rarer processes such as t¯ tt t ¯ and t tWW ¯ , are estimated from simulation.
The acceptance for t¯ t events is increased in CR
tW2L( t¯t ) by requiring a low value of m
T2and inverting the SR selection criteria on m
tb`.
The t¯ tV contribution is dominated by the t¯ t Z component (about 80% of t tV ¯ in the SR). A dedicated control region, CR
tW2L( t¯tZ ) , is defined by first selecting three leptons, where at least one same-flavour-opposite- charge (SFOS) pair are required to be consistent with coming from a Z -boson decay with an invariant mass within the window of [ 71 − 111 ] GeV. If more than one pair are present in the event, the pair which has the invariant mass closest to the Z -boson mass is chosen. The purity of t t Z ¯ events is further enriched by requiring at least three jets. To reduce the diboson background in this region events with exactly one b -jet and three jets are rejected.
Due to the presence of three leptons in this region, the background contribution from misidentified or
non-prompt leptons becomes non-negligible and is estimated using a data-driven matrix method (MM) as
described in Ref. [84, 85]. Two types of lepton identification criteria, ‘tight’ and ‘loose’ are defined in the
evaluation, corresponding to the baseline and signal lepton selections described in Section 4. The number
of events containing misidentified or non-prompt leptons in the t¯ t Z CR is estimated from the number of
observed events with tight or loose leptons using as input the probability for loose prompt, misidentified
or non-prompt leptons to satisfy the tight criteria. The probability for prompt loose leptons to pass the
tight selection is determined from t t Z ¯ MC simulation. The equivalent probability for loose misidentified
or non-prompt leptons to pass the tight selection is measured in a t t ¯ enriched region with two same sign
leptons (electrons or muons) and a least one b-tagged jet, which is dominated with events with at least one
misidentified or non-prompt leptons.
Events / 15 GeV
1 10 102 103 104 105
Data SM Total
t t Single top quark
V t t Diboson tWZ Others
Preliminary ATLAS
−1 = 13 TeV, 139 fb s
Post-fit ) t
2L(t VRtW
[GeV]
t mbl
160 180 200 220 240 260 280 300
Data/SM
0 0.5 1 1.5 2
(a)
Events / 66 GeV
0 20 40 60 80 100
Data SM Total Single top quark
V t t Diboson tWZ Fakes / non-prompt Others
Preliminary ATLAS
−1 = 13 TeV, 139 fb s
Post-fit (3L) tW2L
VR
[GeV]
miss T, corrected E
200 250 300 350 400 450 500 550 600
Data/SM
0 0.5 1 1.5 2
(b)
Events / 68 GeV
0 10 20 30 40
50 Data
SM Total Single top quark
V t t Diboson tWZ Fakes / non-prompt Others
Preliminary ATLAS
−1 = 13 TeV, 139 fb s
Post-fit (3L) tW2L
VR
[GeV]
corrected mT2
100 150 200 250 300 350 400 450 500
Data/SM
0 0.5 1 1.5 2
(c)
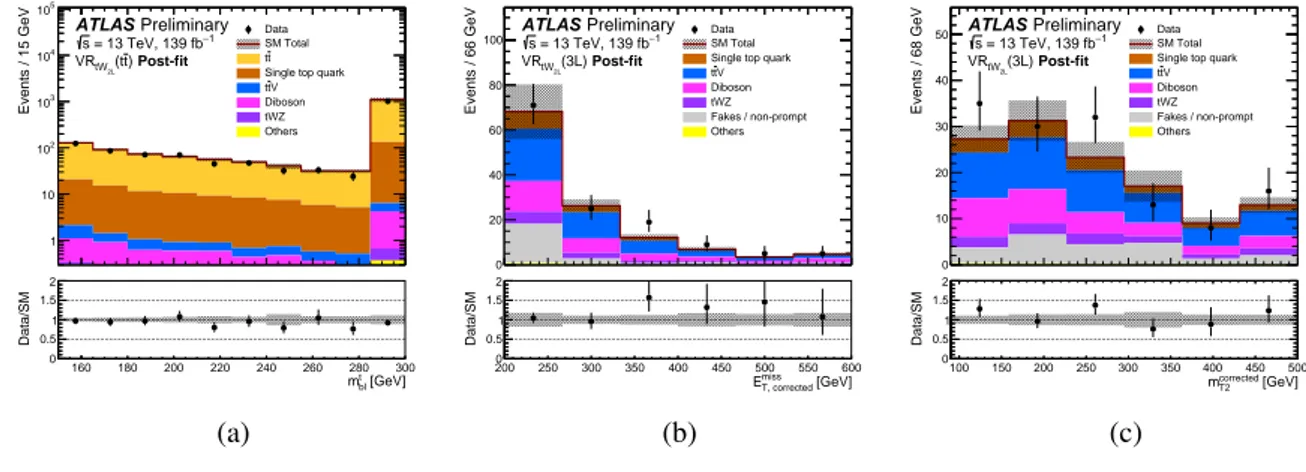
Figure 4: The kinematic distributions in the t t ¯ and 3 ` validation regions of the tW
2Lanalysis channel after the background-only fit: (a) m
tb`in VR
tW2L( t¯t ) , (b) E
missT
in VR
tW2L( 3L ) and (c) m
T2in VR
tW2L( 3L ) . The uncertainty bands plotted include all statistical and systematic uncertainties. The ‘Others’ category includes contributions from rare processes such as triboson, Higgs boson production processes, t t t ¯ t ¯ and t t WW ¯ . The overflow events, where present, are included in the last bin. As the m
tb`is defined for events with at least two jets, the events with exactly one jet are included in the overflow bin.
In the CR
tW2L( t¯tZ ) region, to mimic the event topology of the signal processes a corrected p ®
missT
is used by adding vectorially the transverse momenta of the SFOS pair, which is subsequently used to recalculate the corrected m
T2. The two leptons from the SFOS pair are excluded in the calculation of m
minb`. To improve the estimation of the dominant background from the W Z process in the CR
tW2L( t¯tZ ) region a dedicated W Z CR, CR
tW2L( WZ ) , is defined by inverting the CR
tW2L( t¯tZ ) selection requirements on the jet multiplicity and the corrected m
minb`. The CR is also used to aid in the estimate of all diboson processes in SR. Normalisation factors µ
t¯t, µ
ttV¯
and µ
Diboson
, are found to be 1 . 00 ± 0 . 03, 0 . 76 ± 0 . 26 and 0 . 80 ± 0 . 16 after the background-only fit for the t t ¯ , t tV ¯ and diboson processes, respectively.
A validation region, VR
tW2L( t¯t ) , is defined to validate the t t ¯ background predictions by requiring all signal selection criteria apart from a low value of m
T2as shown in Table 4. The background predictions of the t¯ tV and diboson processes, a 3 ` validation region, VR
tW2L( 3L ) , is defined with similar selection requirements to the CR
tW2L( t¯tZ ) and CR
tW2L( WZ ) regions. To ensure that VR
tW2L( 3L ) region is exclusive to those two CRs, the selection on the corrected m
minb`variable is varied according to the jet and b -jet multiplicity. For the events with exactly one b -jet, the corrected m
minb`is required to be larger than 170 GeV if N
jet> 3, or smaller than 170 GeV if N
jet≤ 3. For the events with more than one b -jet and N
jet> 2, the corrected m
minb`is required to be larger than 170 GeV. To increase the statistics in this region, the threshold of p
Tfor the b -tagged jets is reduced to 40 GeV.
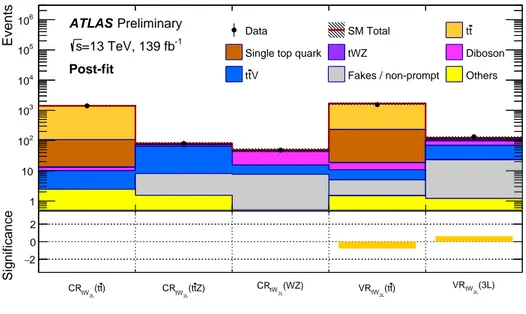
Figure 4 shows the post-fit kinematic distributions in the validation regions. Good agreement is observed between data and the SM expectation in all validation regions. The observed yields, post-fit background estimations and significance [83] in each CR and VR are shown in Figure 5 after the background-only fit.
The data event yields are found to be consistent with background expectations.
) t (t
tW2L
CR (ttZ)
tW2L
CR (WZ)
tW2L
CR (tt)
tW2L
VR (3L)
tW2L
VR
Events
1 10 102
103
104
105
106
Data SM Total tt
Single top quark tWZ Diboson
V t
t Fakes / non-prompt Others
=13 TeV, 139 fb-1
s
Preliminary ATLAS
Post-fit
) t (t
tW2L
CR (ttZ)
tW2L
CR (WZ)
tW2L
CR (tt)
tW2L
VR (3L)
tW2L
Significance VR
−2 0 2
Figure 5: Comparison of the predicted backgrounds with the observed numbers of events in the CRs and VRs associated with the tW
2Lchannel. The normalisation of the backgrounds is obtained from the fit to the CRs. The
‘Others’ category includes contributions from rare processes such as triboson, Higgs boson production processes, t t t¯ ¯ t and t t WW ¯ . The upper panel shows the observed number of events and the predicted background yield. All uncertainties are included in the uncertainty band. The lower panel shows the significances estimated for each region.
5.4 Single lepton tj
1Lanalysis channel
Events with exactly one electron or muon are selected first for the SR if they also contain 1 − 4 jets with p
T> 30 GeV, one or two of which must be b -tagged, and satisfy the preselection requirements as described in Table 2. The fourth jet of the event, if present, is required to have p
T< 50 GeV. The second b -tagged jet is required to have p
T> 30 GeV. The dominant SM background contributions in the channel are t¯ t , W +jets, and single-top ( Wt channel) production. Discriminating variables, E
missT
, m
lepT
, N
forwardjet
and ∆ φ(`
1, b
1) as described in Section 5.1, are used to define the signal region shown in Table 5.
To further improve the sensitivity, a boosted decision tree (BDT) is trained to distinguish between signal and background processes, using events passing the preselection defined in Table 2. The following nine kinematic variables as defined in Section 5.1, are used as input:
• p
Tand η of the highest- p
Tjet: p
T( j
1) and η( j
1) .
• The transverse masses m
lepT
and m
`bT
.
• η
`bof the leading lepton and b -jet system
• The invariant mass of and angular distances between the highest- p
Tlepton and b -jet: m
`1b1, ∆φ(`
1, b
1) ,
∆φ(`
1, p ®
missT
) and ∆R(`
1, b
1) .
To explore the kinematic features in different regions of the signal parameter space, samples with different
signal model parameters are used as an ensemble in the training. A binned distribution of the BDT output
score above 0.6 is then used to extract the final results in the signal regions. The binning of the distribution is optimised as [0.6, 0.75], [0.75, 0.85], [0.85, 0.9] and [0.9, 1.0], referred to as Bins [0 − 3].
The acceptance times detector efficiency after applying all selection criteria for the t -channel production of the signal models is between 0.37%(0.36%) and 0.73%(0.67%) in the parameter space of m
a= 250 GeV, tan β = 0.3(0.5) and m
H±∈ [500, 1750] GeV.
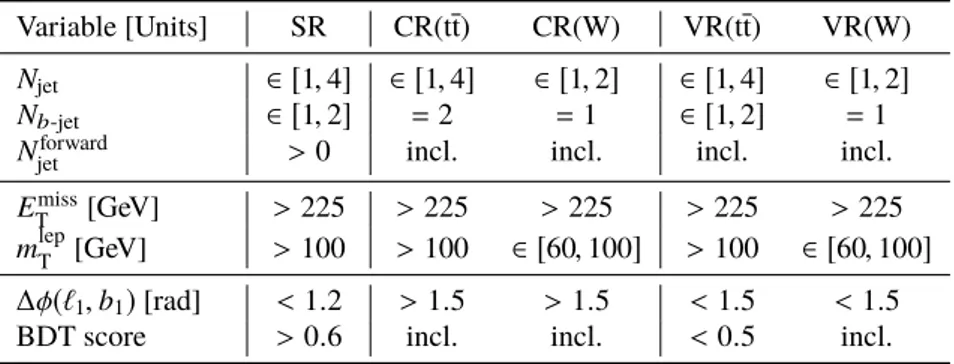
Table 5: Summary of signal, control and validation region definitions used in the tj
1Lanalysis channel. The entry of
‘incl.’ represents an inclusive selection with no requirements.
Variable [Units] SR CR(t¯t) CR(W) VR(t¯t) VR(W) N
jet∈ [ 1 , 4 ] ∈ [ 1 , 4 ] ∈ [ 1 , 2 ] ∈ [ 1 , 4 ] ∈ [ 1 , 2 ] N
b-jet∈ [ 1 , 2 ] = 2 = 1 ∈ [ 1 , 2 ] = 1 N
forwardjet
> 0 incl. incl. incl. incl.
E
missT
[GeV] > 225 > 225 > 225 > 225 > 225 m
lepT
[GeV] > 100 > 100 ∈ [ 60 , 100 ] > 100 ∈ [ 60 , 100 ]
∆φ(`
1, b
1) [rad] < 1 . 2 > 1 . 5 > 1 . 5 < 1 . 5 < 1 . 5 BDT score > 0 . 6 incl. incl. < 0 . 5 incl.
Similar to the tW
1Lanalysis channel, dominant backgrounds from the t¯ t and W +jets processes are estimated using MC simulation and dedicated CRs. The contribution from multijet production is found to be negligible. The remaining sources of background (single-top, Z +jets, diboson, t tV ¯ , t t h ¯ , tW Z productions and rarer processes such as triboson, t¯ t t t ¯ and t t WW ¯ ), are estimated from simulation.
Dedicated control regions CR
tj1L( t¯t ) and CR
tj1L( W ) are designed to estimate the t¯ t and W +jets background processes, respectively, as shown in Table 5. The acceptance for t¯ t events is increased in CR
tj1L( t¯t ) by requiring exactly two b -jets and large ∆φ(`
1, b
1) values. Contribution from W +jets events in the CR
tj1L( W ) region is enhanced by selecting events with one or two jets, exactly one b -jet, low m
lepT
and large ∆φ(`
1, b
1) values. No splitting based on the W boson charge is applied. Normalisation factors, µ
tt¯
and µ
W+jetsare found to be 1 . 00 ± 0 . 27 and 1 . 10 ± 0 . 13 for the t t ¯ and W +jets processes, respectively.
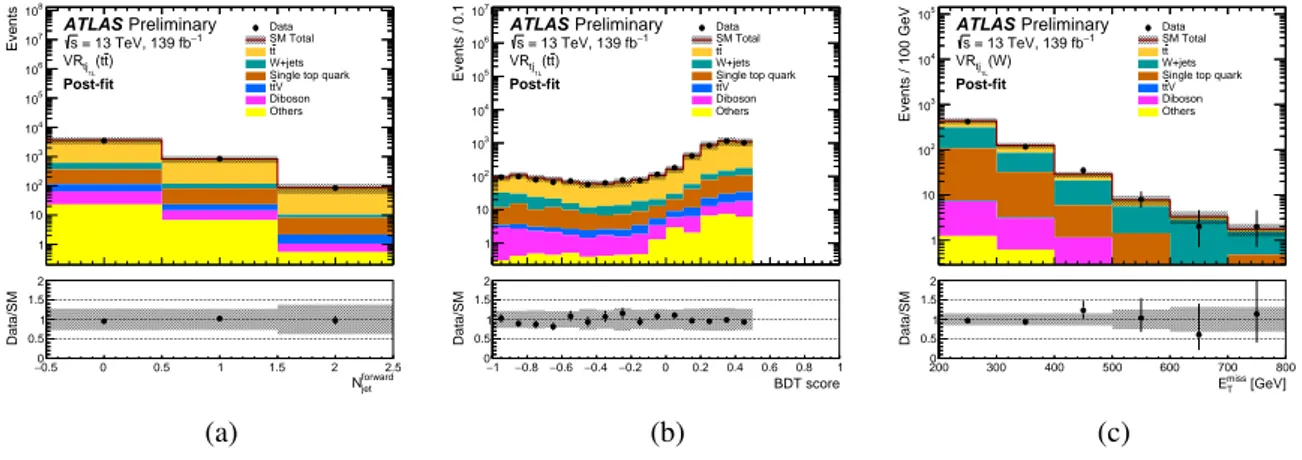
To validate the t¯ t background predictions, a validation region VR
tj1L( t¯t ) is defined by requiring a lower value of the BDT score in comparison to the SR definition as shown in Table 5. For the W +jets background, a validation region VR
tj1L( W ) is defined by requiring a lower m
lepT