A TLAS-CONF-2019-020 28 May 2019
ATLAS CONF Note
ATLAS-CONF-2019-020
24th May 2019
Search for chargino-neutralino production with mass splittings near the electroweak scale in
three-lepton final states in √
s = 13 TeV p p collisions with the ATLAS detector
The ATLAS Collaboration
A search for supersymmetry through the pair production of electroweakinos with mass splitting near the electroweak scale decaying via on-shell W and Z bosons is presented in a three-lepton final state. The analyzed proton-proton collision data taken at a centre-of-mass energy of
√ s = 13 TeV was collected between 2015 and 2018 by the ATLAS experiment at the Large Hadron Collider, corresponding to an integrated luminosity of 139 fb
−1. A search, emulating the recursive jigsaw reconstruction technique with easily reproducible laboratory frame variables, is performed. The two excesses observed with the 2015-2016 data recursive jigsaw analysis in the low-mass three-lepton phase space are consistently reproduced. Results with the full dataset are in agreement with the Standard Model expectations. They are interpreted to set exclusion limits at 95% confidence level on simplified models of chargino-neutralino pair production for masses between 100 GeV and 350 GeV.
© 2019 CERN for the benefit of the ATLAS Collaboration.
Reproduction of this article or parts of it is allowed as specified in the CC-BY-4.0 license.
1 Introduction
Supersymmetry (SUSY) [1–6] is a space-time symmetry that extends the Standard Model (SM), predicting the existence of new partners for each SM particle. The new particles have identical quantum numbers to their partners with the exception of spin, with SM fermions having bosonic partners and SM bosons having fermionic partners. This extension presents solutions to deficiencies in the SM, addressing the hierarchy problem [7–10] and providing a candidate for dark matter as the lightest supersymmetric particle (LSP), which will be stable if R -parity [11] is conserved.
The electroweakinos consists of two generations of charginos ( ˜ χ
i±, i = 1 , 2) and four generations of neutralinos ( ˜ χ
i0, i = 1 , 2 , 3 , 4), where the indices are ordered by ascending mass, with the LSP assumed to be the lightest neutralino, ˜ χ
01
. The electroweakinos are formed from the mixing of the SUSY partners of the Higgs field (known as higgsinos) and of the electroweak gauge fields (the bino for the U(1) gauge field and winos for the W fields).
This paper presents a search for the chargino-neutralino ( ˜ χ
±1
χ ˜
02
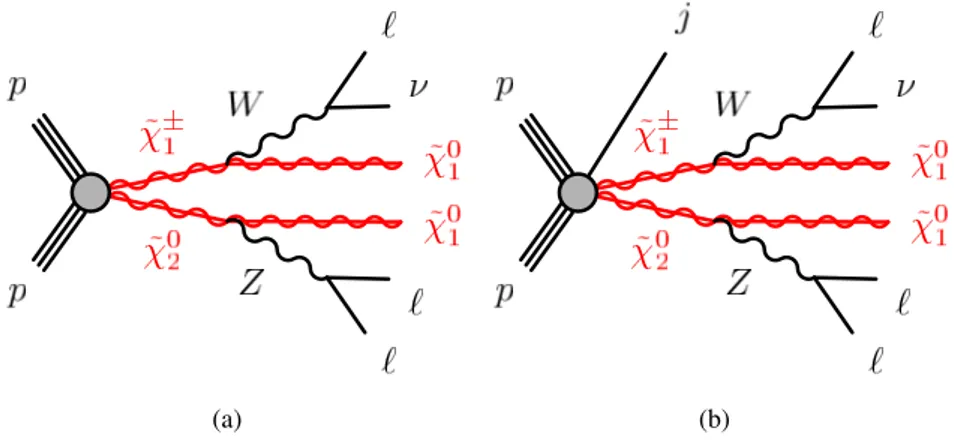
) pair-production with mass splitting near the electroweak scale. The targeted decay chain is shown in Figure 1, with the chargino and neutralino decaying to the invisible LSP ˜ χ
01
and either a W or Z gauge boson, respectively. Simplified models [12, 13], where the masses of the SUSY particles are the only free parameters, are used for interpretation. The
χ ˜
±1
and ˜ χ
02
are assumed to be purely wino and mass degenerate, and decay with 100% branching ratio to W and Z bosons. The ˜ χ
01
LSP is assumed to be pure bino. Both the W and Z bosons decay leptonically via SM branching ratios, leading to a final state with three leptons and missing momentum from two ˜ χ
01
and a neutrino. The presence of initial state radiation (ISR) may lead to jets in the final state and boost the ˜ χ
±1
χ ˜
02
system, enhancing the signature of the missing momentum. The search targets a range of ˜ χ
±1
/ ˜ χ
02
masses between 100 GeV and 450 GeV and mass splittings with respect to the ˜ χ
01
LSP, ∆m = m( χ ˜
±1
/ χ ˜
02
) − m( χ ˜
01
) , larger than the Z boson mass.
(a) (b)
Figure 1: Diagrams of ˜ χ
±1
χ ˜
02
production with subsequent decays into two ˜ χ
01
and, via leptonically decaying W and Z bosons, three leptons and a neutrino. Diagrams are shown both (a) without and (b) with a jet from initial state radiation.
Previous searches for ˜ χ
±1
χ ˜
02
production using conventional observables by the ATLAS [14–16] and CMS [17–
19] collaborations have found no significant excess of events in data over background expectations, setting limits on the ˜ χ
±1
and ˜ χ
02
masses of up to 580 GeV and 570 GeV, respectively. A search by the ATLAS
collaboration using the recursive jigsaw reconstruction (RJR) technique [20, 21] on 36 . 1 fb
−1of data collected between 2015 and 2016 [22] found excesses of three-lepton events in two regions, one targeting low-mass resonances and another utilizing ISR to target resonances with mass differences with respect to the LSP close to the Z boson mass. The excesses corresponded to a local significance of 2 . 1 σ in the signal region targeting low-mass ˜ χ
±1
χ ˜
02
production and to a local significance of 3 . 0 σ in the signal region targeting χ ˜
±1
χ ˜
02
produced in association with ISR. The signal regions of the RJR analysis targeting high-mass ˜ χ
±1
χ ˜
02
production saw no substantial excess, setting limits on the ˜ χ
±1
and ˜ χ
02
masses of up to 600 GeV.
This new, independent analysis explores the intersection between the conventional and RJR approaches to better understand the tension in the exclusion limits produced by the two analyses. It emulates the variables used by the RJR technique with conventional laboratory frame discriminating variables, providing a simple set of variables that are easily reproducible. This technique reproduces the three-lepton excesses in the low-mass region and ISR regions in the laboratory frame using 36 . 1 fb
−1of pp collision data collected between 2015 and 2016 by the ATLAS detector at the LHC. The object and region definitions using these new emulated Recursive Jigsaw Reconstruction (eRJR) variables are kept as close as possible to those from Ref. [22]. Results of this conventional search are presented using a larger dataset corresponding to 139 fb
−1of pp collision data collected between 2015 and 2018.
A brief overview of the ATLAS detector is presented in Section 2, and a description of the dataset and the simulation of ˜ χ
±1
χ ˜
02
and SM background processes is given in Section 3. The reconstruction of the event and of physics objects used in the search are described in Section 4. The eRJR kinematic discriminant variables are introduced in Section 5. A description of the search strategy is presented in Section 6, of the background estimation and validation in Section 7, and of the systematic uncertainty derivation in Section 8. The results of the search are presented in Section 9, followed by a conclusion in Section 10.
2 ATLAS detector
The ATLAS detector [23] is a multi-purpose particle detector with an almost 4 π coverage in solid angle1.
It consists of an inner detector tracking system covering the pseudorapidity region |η| < 2 . 5, sampling electromagnetic and hadronic calorimeters covering |η | < 4 . 9, and a muon spectrometer covering |η | < 2 . 7.
The inner detector (ID) reconstructs charged-particle tracks using silicon pixel and microstrip detectors and a straw-tube transition radiation tracker. An additional innermost layer of the silicon pixel tracker, the insertable B-layer (IBL) [24], was installed before Run 2 at an average radial distance of 3.3 cm from the beamline to improve track reconstruction and the flavor identification of quark-initiated jets. The ID is surrounded by a thin, superconducting solenoid proving an axial magnetic field of 2 T, allowing for the measurement of charged-particle momenta. Beyond the ID is a high-granularity lead/liquid-argon (LAr) electromagnetic sampling calorimeter covering |η | < 3 . 2 and a steel/scintillator-tile hadronic sampling calorimeter covering |η| < 1 . 7. The forward regions in |η| are also covered by the copper/tungsten and LAr hadronic endcap calorimeter (1 . 7 < |η| < 3 . 2) and forward calorimeter (3 . 1 < |η | < 4 . 9). The muon spectrometer (MS) surrounds the calorimeters and measures muon tracks within a system of three
1
ATLAS uses a right-handed coordinate system with its origin at the nominal interaction point (IP) in the center of the detector and the z -axis along the beam pipe. The x -axis points from the IP to the centre of the LHC ring, and the y -axis points upwards.
Cylindrical coordinates (r, φ) are used in the transverse plane, φ being the azimuthal angle around the z -axis. The pseudorapidity η is defined in terms of the polar angle θ as η = − ln tan ( θ / 2 ) and the rapidity y is defined as y = ( 1 / 2 ) ln [( E + p
z)/( E − p
z)] , where E is the energy and p
zthe longitudinal momentum of the physics object. Angular distance is measured in units of
∆R ≡ p
(∆η )
2+ (∆φ )
2, defined using η unless otherwise specified.
superconducting air-core toroidal magnets with eight coils each. The MS consists of three layers of precision tracking and triggering chambers.
The ATLAS trigger system consists of an initial, hardware-based Level 1 (L1) trigger followed by a software-based high-level trigger (HLT). The L1 trigger is designed to use a subset of detector information to accept events at an average 100 kHz rate, while the HLT is designed to reduce the rate to an average of 1 kHz. Candidate electrons are identified by the L1 trigger within the range |η| < 2 . 5 as compact electromagnetic energy deposits in the electromagnetic calorimeter, and by the HLT using additional fast track reconstruction. Candidate muons are identified by the L1 trigger through a coincidence of MS trigger chamber layers and further selected by the HLT using fast reconstruction algorithms with input from the ID and MS.
3 Data and Monte Carlo simulation
The data used for this search were collected between the years 2015 and 2018 by the ATLAS experiment and correspond to an integrated luminosity of 139 fb
−1. The LHC collided protons in bunch-crossing intervals of 25 ns, with the average number of interactions per crossing measured in the dataset to be hµi = 34.
Monte Carlo (MC) simulation is used to model the expected contributions of various SM processes as well as possible SUSY signals. The MC simulation is also used to optimize the event selection criteria and estimate systematic uncertainties on event yield measurement. A full description of MC simulation samples used is given below, and summarized in Table 1. For most SM backgrounds, the expected contributions are taken directly from MC simulation or from MC simulation normalized to data in dedicated control regions.
For Z +jets processes a data-driven method is used to predict the expected yield as described in Section 7, with MC simulation used for method development and deriving uncertainty estimates.
Diboson, triboson, and Z +jets samples are simulated with the Sherpa 2.2 [25] generator. Diboson samples include fully leptonic and semileptonic decays as well as loop-induced and electroweak VV j j production, where V refers to a Z or W vector boson. For all Sherpa samples the additional hard parton emissions [26] are matched to a parton shower based on Catani-Seymour dipole factorization [27]. The NNPDF3.0nnlo [28] set of parton distribution functions (PDFs) and a dedicated set of tuned parton-shower parameters developed by the Sherpa authors are used [27]. The ME+PS matching [29] is employed for different jet multiplicities and then merged into an inclusive sample using an improved CKKW matching procedure [30] which is extended to next-to-leading order (NLO) accuracy using the MEPS@NLO prescription [31]. These samples are NLO accurate for up to one additional parton and leading order (LO) accurate for up to three additional parton emissions. The virtual QCD correction for matrix elements at NLO accuracy are provided by the OpenLoops library [32]. The Z +jets samples are normalised to a next-to-next-to-leading order (NNLO) prediction of the cross section [33].
The production of t t ¯ events is modeled using the PowhegBox [34] v2 generator at NLO with the NNPDF3.0nnlo PDF set and the h
dampparameter2 is set to a factor of 1.5 of the top mass [35]. The events are interfaced with Pythia8.230 [36] using the A14 tune [37] and the NNPDF2.3lo PDF set [38].
The NLO t¯ t inclusive production cross section is corrected to the theory prediction at NNLO in QCD
2
The h
dampparameter controls the transverse momentum p
Tof the first additional emission beyond the leading-order Feynman
diagram in the parton shower and therefore regulates the high- p
Temission against which the t¯ t system recoils.
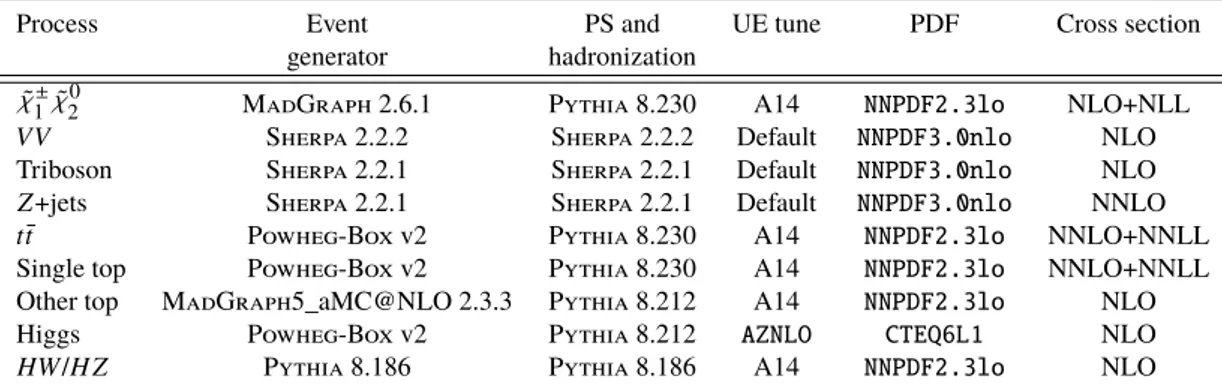
Table 1: Monte Carlo simulation details by physics process. Listed are the generators used for matrix-element calculation and for parton showering, the underlying event parameter tunes, the PDF sets, and the order in α
Sof cross-section calculations used for the yield normalization. Other top includes tt + X , t Z , 3-top, and 4-top processes.
V refers to a Z or W vector boson, while X refers to a Z , W , or Higgs boson.
Process Event PS and UE tune PDF Cross section
generator hadronization χ ˜
±1
χ ˜
02
MadGraph 2.6.1 Pythia 8.230 A14 NNPDF2.3lo NLO+NLL
VV Sherpa 2.2.2 Sherpa 2.2.2 Default NNPDF3.0nlo NLO
Triboson Sherpa 2.2.1 Sherpa 2.2.1 Default NNPDF3.0nlo NLO
Z +jets Sherpa 2.2.1 Sherpa 2.2.1 Default NNPDF3.0nlo NNLO
t¯ t Powheg-Box v2 Pythia 8.230 A14 NNPDF2.3lo NNLO+NNLL
Single top Powheg-Box v2 Pythia 8.230 A14 NNPDF2.3lo NNLO+NNLL
Other top MadGraph5_aMC@NLO 2.3.3 Pythia 8.212 A14 NNPDF2.3lo NLO
Higgs Powheg-Box v2 Pythia 8.212 AZNLO CTEQ6L1 NLO
HW / H Z Pythia 8.186 Pythia 8.186 A14 NNPDF2.3lo NLO
including the resummation of next-to-next-to-leading logarithmic (NNLL) soft-gluon terms calculated using Top++2.0 [39].
Single-top s -channel, t -channel, and tW associated production are also modeled using the PowhegBox v2 generator at NLO in QCD with the NNPDF3.0nlo PDF set. The events are interfaced with Pythia 8.230 using the A3 tune [40] and the NNPDF2.3lo PDF set. Other rare top processes include tt + X (where X may be a Z , W , or Higgs boson), t Z , 3-top, and 4-top production and are modeled using the MadGraph5_aMC@NLO v2.3.3 [41] generator at NLO with the NNPDF3.0nlo PDF set. The events are interfaced with Pythia 8.210 using the A14 tune and the NNPDF2.3lo PDF set.
Higgs-boson production processes are generated using PowhegBox v2 and interfaced with Pythia 8.212 using the AZNLO [42] tune and CTEQ6L1 [43] PDF set. Higgs-boson production in association with a W or Z boson is produced with Pythia 8.186 using the A14 tune and NNPDF2.3lo PDF set. Higgs samples are normalized with cross sections calculated at NLO [44].
The SUSY ˜ χ
±1
χ ˜
02
signal samples are produced at LO using MadGraph5_aMC@NLO v2.6.1 with up to two additional partons with the NNPDF2.3lo PDF set, and interfaced with Pythia8.230 using the A14 tune and NNPDF2.3lo PDF set. The scale parameter for jet-parton CKKW-L matching was set at a quarter of the ˜ χ
±1
/ ˜ χ
02
mass. Signal cross sections are calculated at NLO in α
S, adding the resummation of soft gluon emission at next-to-leading-logarithmic accuracy (NLL) [45]. The cross-section for ˜ χ
±1
χ ˜
02
production, when each has a mass of 200 GeV, is 1 . 8 ± 0 . 1 pb.
The modeling of c - and b -hadron decays in samples generated with Powheg-Box or MadGraph5_aMC@NLO was performed with EvtGen 1.2.0 [46]. Generated events are propagated through a full simulation of the ATLAS detector [47] using Geant4 [48], which describes the interactions of particles with the detector.
A parameterized simulation of the ATLAS calorimeter called Atlfast-II [47] was used for faster detector
simulation of signal samples, and is found to agree well with the full simulation. The effect of multiple
interactions in the same and neighboring bunch crossings (pileup) is modeled by overlaying simulated
minimum-bias events generated with Pythia8.186 using the A14 tune and NNPDF2.3lo PDF set over the
original hard-scattering event.
4 Event reconstruction
Analysis events are recorded during stable beam conditions and must pass detector and data quality requirements for inclusion in the analysis. Each event is required to have a primary vertex that is associated with a minimum of two tracks of transverse momentum p
T> 500 MeV, where the primary vertex is defined as the reconstructed vertex with the largest Σp
2T
of associated tracks [49].
Two identification levels are defined for leptons and jets, referred to as “baseline” and “signal”, with signal objects being a subset of baseline. The baseline leptons are required to pass looser identification and isolation criteria, providing a higher selection efficiency for leptons and jets for use in calculating missing transverse momentum ( p
missT
), resolving ambiguities between overlapping physics objects, and calculating the data-driven estimate of the background arising from fake or non-prompt leptons.
Electron candidates are reconstructed using energy clusters in the electromagnetic calorimeter which are matched to an ID track, and are calibrated in situ using Z → ee decays [50]. Baseline electrons must have p
T> 10 GeV and fall within the ID acceptance, |η| < 2 . 47. The electrons must also satisfy the
“loose likelihood” quality criteria [51]. The trajectory of baseline electrons must be consistent with the primary vertex to suppress electrons originating from pileup. Therefore, the tracks associated with baseline electrons must have a longitudinal impact parameter with respect to the primary vertex ( z
0) such that
| z
0sin θ| < 0 . 5 mm. Signal electrons are required to satisfy the tighter “medium” identification criteria and must be well isolated from additional activity, passing a “tight”, p
T-dependent isolation requirement that imposes fixed requirements on the value of the isolation criteria. The isolation is measured within a cone of ∆R = 0 . 2 of the electron, and the amount of both non-associated calorimeter energy and track p
Tmust be below 6%. Tracks are only considered by the isolation criteria if they are consistent with the primary vertex. For track isolation, the cone size decreases linearly with p
Tabove 50 GeV as the electron’s energy becomes more collimated. The tracks associated with signal electrons must also pass a requirement on the transverse-plane distance of closest approach to the beamline ( d
0) such that |d
0/σ
d0| < 5, where σ
d0is the uncertainty on d
0.
Muon candidates are reconstructed from either ID tracks matched to track segments in the MS or from tracks formed from a combined fit in the ID and MS [52], and are calibrated in situ using Z → µµ and J/ψ → µµ decays [52]. Baseline muons must have p
T> 10 GeV, have |η | < 2 . 4, and pass the impact parameter cut of | z
0sin θ | < 0 . 5 mm. Signal muons must fulfill the “medium” identification criteria [52]
and a “tight” isolation criteria, defined similarly as for electrons but rejecting non-associated calorimeter energy at the level of 15% and non-associated track p
Tat the level of 4%. The size of the track-isolation cone is ∆R = 0 . 3 for muons of p
T= 33 GeV or below and decreases linearly to ∆R = 0 . 2 at p
T= 50 GeV, improving the selection efficiency for higher- p
Tmuons. Signal muons must all pass the impact parameter requirement of |d
0/σ
d0| < 3.
Jet candidates are reconstructed from three-dimensional topological energy clusters [53] using the anti-k
talgorithm [54] with distance parameter R = 0 . 4. The jet energy scale (JES) and resolution (JER) are first calibrated to particle level using MC simulation and then in situ through Z +jet, γ +jet, and multijet measurements [55]. Baseline jets are required to have a p
T> 20 GeV and fall within the full calorimeter acceptance of |η | < 4 . 5. To suppress jets originating from pileup, jets are required to pass the “medium”
working point of the track-based Jet Vertex Tagger [56, 57] if the jet has p
T< 120 GeV and falls within
the ID acceptance of |η| < 2 . 5. Signal jets are required to have |η| < 2 . 4 to ensure full application of the
pileup suppression, and events are rejected if they contain a jet that fails a “loose” quality criteria [58],
reducing contamination from noise bursts and non-collision backgrounds.
The identification of jets containing b -hadrons, called b -jets, is performed using a multivariate discriminant built with information from track impact parameters, the presence of displaced secondary vertices, and the reconstructed flight paths of b - and c -hadrons inside the jet [59, 60]. The identification criteria is tuned to an average identification efficiency of 77% as obtained for b -jets in simulated t t ¯ events, corresponding to rejection factors of 113, 4, and 16 for jets originating from light-quarks and gluons, c -quarks, and τ -leptons, respectively.
To avoid reconstructing a single detector signature as multiple leptons or jets, an overlap removal procedure is applied to baseline leptons and jets. For overlap removal ∆R is calculated using rapidity, rather than η , to ensure the distance measurement is Lorentz invariant with respect to jets that may have non-negligible masses. First, any electron that shares a track with a muon in the ID is removed, as the track is seen to be consistent with segments in the MS. Then, jets are removed if they are within ∆R < 0 . 2 of a lepton, as they have likely formed from an electron shower or muon bremsstrahlung. For the overlap with associated muons, the nearby jet is only discarded if it is associated to less than three tracks of p
T≥ 500 MeV.
Finally, electrons and muons with p
T≤ 50 GeV that are close to a remaining jet are discarded to reject non-prompt or fake leptons originating from hadron decays. They are discarded if they are within a distance of ∆R < 0 . 4 for leptons of 25 GeV or below, with the ∆R decreasing linearly with increasing lepton p
Tdown to ∆R < 0 . 2 for leptons of 50 GeV.
The missing transverse momentum, p
missT
, with magnitude E
missT
, is calculated as the negative vector sum of the transverse momenta of the baseline leptons, jets, and the soft term, the latter given by the sum of transverse momenta of additional low-momentum objects in the event [61]. The soft term is reconstructed from particle tracks in the ID that are associated with the primary vertex but not to any reconstructed analysis objects.
Data events were collected with triggers requiring either two electrons, two muons or an electron plus a muon. The triggers have lepton p
Tthresholds in the range of 8–22 GeV which are looser than the p
Tthresholds required offline to ensure that trigger efficiencies are constant in the relevant phase space. All MC simulation samples emulate the triggers and have MC-to-data corrections applied to account for small differences in lepton identification, reconstruction, isolation and triggering efficiencies, as well as in jet pileup and flavor identification efficiencies.
5 Kinematic discriminants
In most R-parity conserving SUSY models, the LSP is an invisible particle that rarely, if ever, interacts with matter. It is therefore not directly observed by the ATLAS detector, but manifests itself as missing transverse momentum in an event whose particle transverse momenta would otherwise balance. The relative boost of quarks inside the colliding protons makes it impossible to know the true vector of missing momentum, allowing only for an accurate measurement of the transverse component. For SUSY particles with various decay stages the loss of this information can make it difficult to match the decay products and correctly reconstruct the originally-produced particles, resulting in ambiguities in the reconstruction of the
χ ˜
±1
and the ˜ χ
02
.
The RJR technique [20, 21] attempts to resolve these ambiguities by analyzing each event starting from
the laboratory-frame particles and boosting back to the rest frames of the parent particles. Reconstructed
jets, muons, and electrons are used as inputs for the RJR algorithm that determines which leptons come
from the chargino or neutralino decays, assuming a specific decay chain. The ISR jets are selected by
minimizing the invariant mass of the system formed by the potential ISR jets and the sparticle system (consisting of leptons and missing energy vector) in the center-of-mass frame. The only unknowns are the masses and longitudinal momenta of the invisible objects (two neutralinos and a neutrino), and how each individually contributes to the total missing energy. The RJR algorithm determines the smallest Lorentz invariant function which results in non-negative mass parameters for the invisible particles [21].
This search targets ˜ χ
±1
χ ˜
02
signals using a low-mass region with a jet-veto and an ISR region requiring the presence of one or more jets. The emulated Recursive Jigsaw Reconstruction (eRJR) technique emulates the RJR variables using minimal assumptions on the mass of the invisible system and calculates all kinematic variables in the laboratory frame.
The eRJR variables, with original RJR variable names from Ref. [22] in parenthesis, used to select the ISR regions are defined as follows:
• E
missT
( p
IT
), the p
Tof the invisible particles is emulated as the magnitude of the missing transverse momentum.
• p
jetsT
( p
ISRT
), the p
Tof the vector sum of the ISR jets’ momenta. The ISR system in the eRJR technique is the p
Tof the vector sum of signal jets’ four-momenta in the event.
• |∆φ E
missT
, jets
| ( ∆φ
ISR,Emiss
T
), the azimuthal angle between the ISR system and the invisible particles is emulated using the transverse missing momentum, p
missT
, and the vector sum of signal jets’ momenta.
• R E
missT
, jets
( R
ISR), the normalized projection of the invisible system onto the ISR system, representing a ratio of p
missT
to total jet p
T, is emulated as
|pmiss T ·pdjets
T | pjets
T
, where p d
jetsT
is the unit vector of the vector sum of signal jet momenta.
• p
softT
( p
CMT
), the transverse momentum in the frame where the ISR system recoils against the system containing the leptons and the missing energy (CM), is emulated as the magnitude of the p
Tof the vector sum of the four-momenta of the signal jets, leptons, and p
missT
, and is highly correlated to the E
missT
soft term, defined in Section 4.
Similarly, the eRJR variables, with original RJR variable names from Ref. [22] in parenthesis, used in the low-mass regions are defined as follows:
• p
softT
( p
PPT
), the transverse mometum in the center-of mass frame of the protons (PP), is emulated as the magnitude of the p
Tof the vector sum of the four-momenta of the signal leptons and p
missT
, being identical to that of the ISR region except for the jet veto applied to the low-mass region.
• m
3`eff
( H
PPT 3,1
), the scalar sum of the p
Tof the signal leptons and the invisible system (neutrino and LSPs) in the PP frame, is emulated as the scalar sum of the p
Tof the signal leptons and E
missT
.
• H
boost( H
PP3,1
), the scalar sum of the magnitude of the momentum of the signal leptons and the invisible
system (neutrino and LSPs) in the PP frame, is emulated as the scalar sum of the momentum of
the signal leptons and the missing momentum vector (which includes longitudinal and transverse
components), |p
miss| , after applying a boost.
To calculate H
boost, the longitudinal component of the missing momentum vector, p
miss| |, and the boost need to be determined. The p
miss| |variable is calculated as [21]:
|p
miss| || = |p
V,| || |p
missT
| q
(p
V,T)
2+ m
V2(1)
where the p
V,| |is the z -component of the vector sum of four-momenta of the three signal leptons, p
V,Tis the magnitude of the transverse momentum of the vector sum of four-momenta of the three leptons, and m
Vis the mass of the three lepton system. The mass of the vector sum of invisible particles are assumed to be zero and do not appear in the equation. The boost of the system can then be calculated as:
βββ = p
E = p
V+ p
missE
V+ |p
miss| (2)
where p
Vis the vector sum of three-momenta of the three leptons calculated in the laboratory frame. This boost is applied to the three leptons and the p
miss. These new objects are used in the calculation of H
boost. The eRJR technique was validated against the published RJR result [22] and was able to reproduce similar excesses in the laboratory frame as seen in the dataset collected in 2015 and 2016. In SR-low, the exact same data events were selected using the emulated variables as using the RJR variables with similar background expectation. In SR-ISR, because all signal jets are considered part of the ISR system in the eRJR method, additional data events were selected alongside a proportional increase in the number of expected background events, with the significance of the excess in agreement with the RJR search.
The signal significance in both the low-mass and ISR regions is comparable for both techniques. A strong correlation is found between eRJR and RJR variables in loosened signal regions, with only a slight decorrelation seen in p
softT
due to the differing jet selection, leading to the additional SR-ISR events. The eRJR technique provides a simple set of conventional variables in the laboratory frame that can easily be reproduced by the community and future searches.
6 Search strategy
The search is performed in signal regions (SRs) designed to select the targeted ˜ χ
±1
χ ˜
02
signal events while accepting only a small but well-measured number of SM background events. The SM background yields in the SRs are estimated using dedicated control regions (CRs) and affirmed in validation regions (VRs), as described in Section 7. The full set of event selections is summarized in Table 2 and described in detail below. To target leptonically-decaying W and Z bosons from the electroweakinos, events must have exactly three leptons which pass the baseline and signal requirements defined in Section 4. The leptons must have at least one same-flavor opposite-charge (SFOS) pair ( e
+e
−or µ
+µ
−) with an invariant mass of the pair m
``between 75 GeV and 105 GeV, consistent with a Z boson. If there is more than one SFOS pair, the pair chosen is the one that has an invariant mass closest to that of a Z boson.
The leading source of SM background is W Z production, which when decaying fully leptonically has three leptons and E
missT
from a neutrino in the final state. To reduce the W Z contribution, the transverse mass is calculated from the unpaired third lepton and the E
missT
. It is defined as m
T= q
2 p
TE
missT
( 1 − cos (∆φ)) , where ∆ φ is the angular separation between the lepton and p
missT
, and will typically be at or below the W boson mass in SM events where the E
missT
is predominantly from the neutrino of the W decay. The m
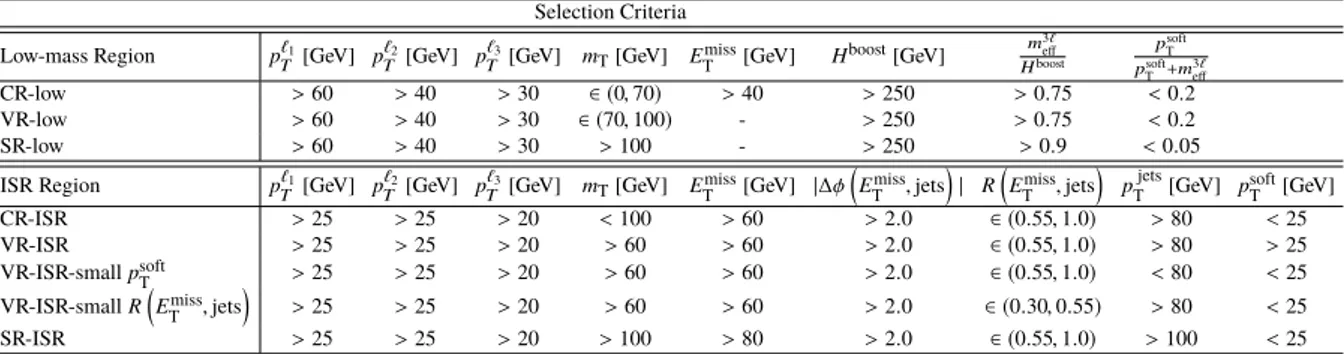
TTable 2: Selection criteria for the low-mass and ISR regions. The variables are defined in the text. In addition, events are required to have three signal leptons, and a b -jet veto is applied. The invariant mass between the two leptons identified as coming from the Z boson decay is between 75 GeV and 105 GeV and the invariant mass of the three leptons is greater than 105 GeV.
Selection Criteria Low-mass Region p`T1[GeV] pT`2[GeV] p`T3[GeV] mT[GeV] Emiss
T [GeV] Hboost[GeV] m
3`
eff Hboost
psoftT psoftT +m3`eff CR-low >60 >40 >30 ∈ (0,70) >40 >250 >0.75 <0.2 VR-low >60 >40 >30 ∈ (70,100) - >250 >0.75 <0.2
SR-low >60 >40 >30 >100 - >250 >0.9 <0.05
ISR Region p`T1[GeV] pT`2[GeV] p`T3[GeV] mT[GeV] Emiss
T [GeV] |∆φ Emiss
T ,jets
| R
Emiss T ,jets
pjets
T [GeV] psoft T [GeV]
CR-ISR >25 >25 >20 <100 >60 >2.0 ∈ (0.55,1.0) >80 <25 VR-ISR >25 >25 >20 >60 >60 >2.0 ∈ (0.55,1.0) >80 >25 VR-ISR-smallpsoft
T >25 >25 >20 >60 >60 >2.0 ∈ (0.55,1.0) <80 <25
VR-ISR-smallR Emiss
T ,jets
>25 >25 >20 >60 >60 >2.0 ∈ (0.30,0.55) >80 <25 SR-ISR >25 >25 >20 >100 >80 >2.0 ∈ (0.55,1.0) >100 <25
calculated in ˜ χ
±1
χ ˜
02
events does not have such a constraint, and the SRs therefore require m
T≥ 100 GeV to reduce the SM W Z background. Additionally, signal events usually have larger values of E
missT
due to the massive but undetected LSPs. The backgrounds where one or more leptons are fake or non-prompt are reduced by targeting the source of the additional leptons. Events containing b -tagged jets are rejected to minimize contributions from the top backgrounds t t ¯ and Wt . In the Z +jets background, a third signal lepton can arise from photon conversion, where the photon comes from the bremsstrahlung of a lepton originating from the Z boson. In this situation all three signal leptons originated from the Z boson, and this background can be reduced by requiring that the invariant mass of the three lepton system m
```be larger than 105 GeV.
The signal regions are split into two different topologies: SR-low, the low-mass region that requires a jet veto, and SR-ISR, the ISR region that requires at least one central jet. Both SRs were optimized for signals with small mass splittings, which can lead to events with lower p
Tleptons or smaller E
missT
in the final state.
The inclusion of recoiling ISR boosts the invisible decay products in the same direction, enhancing the measured E
missT
and improving the discrimination against the lower E
missT
W Z background.
The low-mass signal region requires the p
Tof the first, second, and third leptons (ordered in p
T) to be greater than 60 GeV, 40 GeV, and 30 GeV, respectively, to minimize contributions from backgrounds with fake/non-prompt leptons. Tight selection thresholds on the eRJR variables H
boost,
psoft T psoft
T +m3`
eff
, and
m3`
eff
Hboost
further reduce the W Z contribution in the signal region. The ISR region has a requirement of
E
missT
≥ 80 GeV to reduce the Z +jets background which does not have a source of real E
missT
. The p
Trequirement on the three leptons can then be relaxed to be greater than 25 GeV, 25 GeV, and 20 GeV, ensuring the dilepton triggers are fully efficient. To select the ISR topology in which the system of leptons and E
missT
is recoiling against the ISR jets, the angular separation between the signal jets and p
missT
,
∆φ(E
missT
, jets ) , is required to be greater than 2.0. The ratio between the p
missT
and the total transverse momenta of the jets is required to be 0 . 55 ≤ R(E
missT
, jets ) ≤ 1 . 0 to ensure the majority of transverse momentum along the jet axis is carried by the invisible particles and not by the high- p
Tleptons from the W Z background. A requirement of p
softT
less than 25 GeV further reduces background contamination.
7 Background estimation and validation
The backgrounds in this analysis can be classified into two groups: irreducible backgrounds with at least three prompt leptons in the final state, and reducible backgrounds containing at least one fake or non-prompt lepton. The dominant irreducible background is W Z production which is estimated from MC simulation whose yields are normalized to data in CRs. Other irreducible backgrounds include Z Z , VVV , t¯ tV , and Higgs processes, and are estimated directly from MC simulation due to their small contribution.
The reducible backgrounds can be categorized into the top-quark like t t ¯ , Wt , and WW processes, which mostly consists of non-prompt leptons from heavy-flavor hadron decays, and the Z +jets process, which also accounts for the Z + γ process, with fake and non-prompt leptons coming primarily from photon conversions or misidentified jets. The reducible backgrounds are estimated separately in regions enriched in fake and non-prompt leptons, one targeting top-quark like processes and another targeting other fake/non-prompt sources, usually from Z +jets processes, as described below.
The dominant SM background, W Z , is estimated using MC simulation normalized to data in CRs designed to be kinematically similar but orthogonal to SR-low and SR-ISR. The CRs are designed to be enriched in W Z events while keeping the potential signal contamination small, being less than 10% for all signal models. To achieve this an upper bound is placed on the m
Tof the CRs, targeting events that are likely to have a leptonically decaying W boson and no other sources of E
missT
. Therefore the low-mass CR (CR-low) requires m
T< 70 GeV while the ISR CR (CR-ISR) has a slightly looser requirement of m
T< 100 GeV, benefiting from the boost of the E
missT
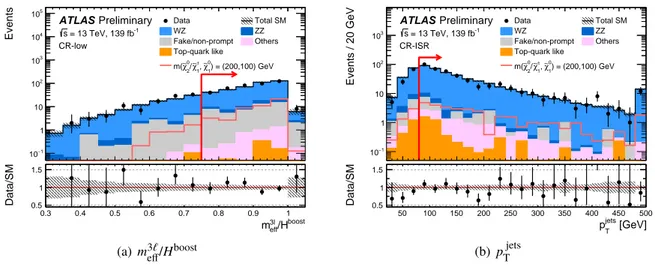
system by the ISR. The other kinematic selections are similar to the corresponding SRs, with some loosened to enhance statistics and reduce signal contamination. Figure 2 shows the background composition in the CR-low and CR-ISR regions, with good agreement seen between data and the background prediction.
obs_x_CRlow_htration1_L3_HT31L3_H31
Events
−1
10 1 10 102
103
104
105
) = (200,100) GeV
0
χ∼1
±, χ∼1 0/ χ∼2
m(
Data Total SM
WZ ZZ
Fake/non-prompt Others Top-quark like
Preliminary ATLAS
= 13 TeV, 139 fb-1
s CR-low
boost 3l/H meff
0.3 0.4 0.5 0.6 0.7 0.8 0.9 1
Data/SM 0.5
1 1.5
(a) m
3`eff
/ H
boostobs_x_CRISR_ptisrn1_L3_pTISR
Events / 20 GeV
−1
10 1 10 102
103
) = (200,100) GeV
0
χ∼1
±, χ∼1 0/ χ∼2
m(
Data Total SM
WZ ZZ
Fake/non-prompt Others Top-quark like
Preliminary ATLAS
= 13 TeV, 139 fb-1
s CR-ISR
[GeV]
jets
pT
50 100 150 200 250 300 350 400 450 500
Data/SM 0.5
1 1.5
(b) p
jetsT
Figure 2: Examples of kinematic distributions after the background-only fit showing the data and the post-fit background in (a) CR-low for m
3`eff
/H
boostand (b) CR-ISR for p
jetsT
. The corresponding CR event selections are applied for each distribution except for the variable shown where the selection is indicated by a red arrow. The first (last) bin includes underflow (overflow). The category Others contains backgrounds from triboson, Higgs boson, tt + X , t Z , 3-top, and 4-top processes. The bottom panel shows the ratio between the data and the post-fit background prediction. The hatched bands indicate the combined theoretical, experimental, and MC statistical uncertainties.
The data-driven fake factor method is used to estimate the fake/non-prompt lepton background associated
with the Z +jets process. The fake factor method uses two levels of lepton identification criteria. The
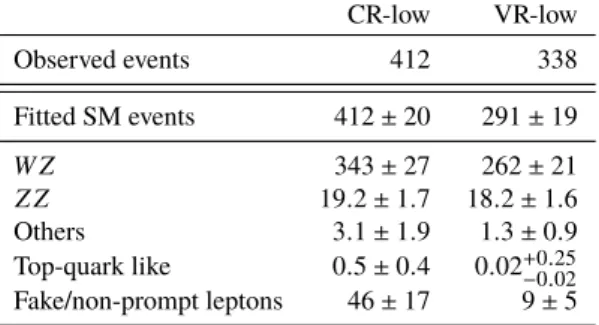
Table 3: The observed and expected yields after the background-only fit in the low-mass CR and VR. The normalization factors of the W Z sample for the low-mass and ISR regions are different and are treated separately in the combined fit. The Others category includes triboson, Higgs boson, and rare top-quark processes. Combined statistical and systematic uncertainties are presented. The individual uncertainties can be correlated and do not necessarily add in quadrature to the total background uncertainty.
CR-low VR-low
Observed events 412 338
Fitted SM events 412 ± 20 291 ± 19
W Z 343 ± 27 262 ± 21
Z Z 19 . 2 ± 1 . 7 18 . 2 ± 1 . 6
Others 3.1 ± 1.9 1.3 ± 0.9
Top-quark like 0 . 5 ± 0 . 4 0 . 02
+0−0.02.25Fake/non-prompt leptons 46 ± 17 9 ± 5
regular identification criteria, “ID”, corresponds to the signal lepton criteria used in the analysis. A reversed identification criteria, “anti-ID”, has one or more of the identification, isolation, or impact parameter criteria inverted relative to signal leptons to obtain a selection enriched in fake leptons. A fake factor is then defined as the ratio of the yield of ID leptons to anti-ID leptons in a given region of phase space. The fake factors are measured in a region dominated by Z +jets events, requiring E
missT
< 40 GeV, m
T< 30 GeV,
|m
``− m
Z| < 15 GeV, and a b -jet veto. The two leptons paired as the Z boson must pass the signal lepton requirements, while the unpaired lepton must satisfy either the ID or anti-ID criteria. Electron and muon fake factors are then measured separately and as a function of lepton p
T. They are validated in a statistically independent region with a similar selection but requiring E
missT
< 40 GeV and 30 < m
T< 50 GeV, defined as such to be closer to the signal region. The derived fake factors are applied to events in the CRs, VRs, and SRs (defined in Table 2), but for which at least one of the signal leptons is replaced by an anti-ID lepton. In both the derivation and application of the fake factors, the prompt lepton and top-quark like backgrounds that have one or more anti-ID leptons are subtracted to avoid double counting.
The top-quark like background contribution is estimated using MC simulation normalized to data in a top-quark dominated CR. The region is constructed using different-flavor, opposite-charge ( e
±e
±µ
∓or µ
±µ
±e
∓) trilepton events with lepton p
Tthresholds of 25 GeV, 25 GeV, and 20 GeV as well as a b -jet veto.
The normalization factors are applied to the same-flavor opposite-charge events in the top-quark like MC simulation.
Four validation regions are designed to check the agreement of the background estimation with data in regions kinematically closer to the SRs, typically targeting the extrapolation from CR to SR of a specific variable. The full VR definitions are summarized in Table 2. The VR definitions are also chosen to keep signal contamination below 10%. A low-mass VR-low is designed to test the extrapolation over m
Tbetween CR-low and SR-low, requiring 70 < m
T< 100 GeV. Three ISR validation regions VR-ISR, VR-ISR-small p
softT
, and VR-ISR-small R E
missT
, jets
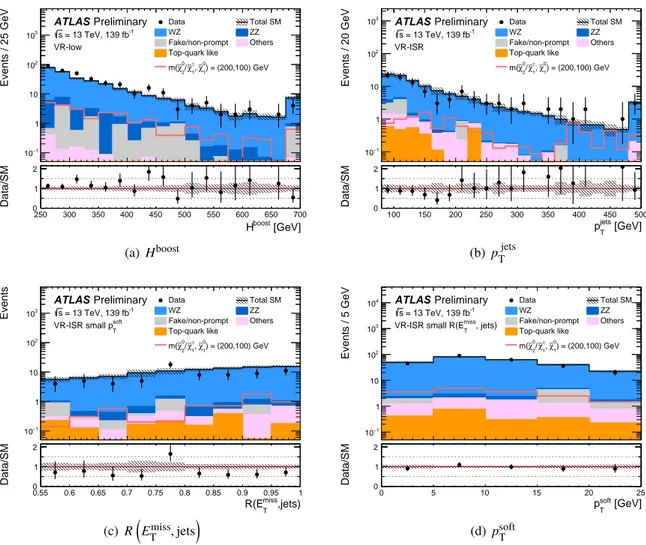
invert different selections to validate the modeling in a varied phase space. The total yields in the CRs and VRs are shown in Table 3 for the low-mass regions and Table 4 for the ISR regions. Figure 3 shows distributions in VR-low, VR-ISR, VR-ISR-small p
softT
, and VR-ISR-small R E
missT
, jets
for the full background prediction. There is generally good agreement seen between the expected background prediction and the observed data. The agreement between data and the prediction seen in VR-low and VR-ISR-small p
softT
is within 2 σ , and good agreement is seen in the shape
of relevant kinematic distributions.
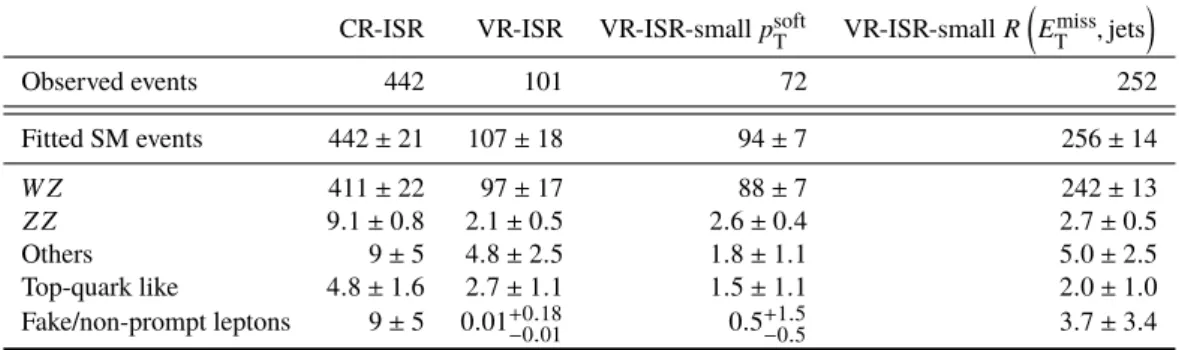
Table 4: The observed and expected yields after the background-only fit in the ISR CR and VRs. The normalization factors of the W Z sample for the low-mass and ISR regions are different and are treated separately in the combined fit. The Others category includes triboson, Higgs boson, and rare top-quark processes. Combined statistical and systematic uncertainties are presented. The individual uncertainties can be correlated and do not necessarily add in quadrature to the total background uncertainty.
CR-ISR VR-ISR VR-ISR-small p
softT
VR-ISR-small R
E
missT
, jets
Observed events 442 101 72 252
Fitted SM events 442 ± 21 107 ± 18 94 ± 7 256 ± 14
W Z 411 ± 22 97 ± 17 88 ± 7 242 ± 13
Z Z 9 . 1 ± 0 . 8 2 . 1 ± 0 . 5 2 . 6 ± 0 . 4 2 . 7 ± 0 . 5
Others 9 ± 5 4 . 8 ± 2 . 5 1 . 8 ± 1 . 1 5 . 0 ± 2 . 5
Top-quark like 4 . 8 ± 1 . 6 2 . 7 ± 1 . 1 1 . 5 ± 1 . 1 2 . 0 ± 1 . 0 Fake/non-prompt leptons 9 ± 5 0 . 01
+0.18−0.010 . 5
+1.5−0.53 . 7 ± 3 . 4
8 Systematic uncertainties
Systematic uncertainties are derived for the signal and background predictions and account for experimental sources related to detector measurements as well as theoretical sources on the expected yields and MC simulation modeling.
Experimental uncertainties reflect the precision of the experimental measurements of jets, electrons, muons, and E
missT
. The jet energy scale (JES) and resolution (JER) uncertainties [55, 62] are derived as a function of jet p
Tand η , and account for dependencies on the pileup conditions and on the flavor composition of jets. The JES reflects the uncertainty on the average jet p
Tmeasurement, varying from about 4% for 20 GeV jets down to 1% above 300 GeV, while the JER reflects the uncertainty on the precision of the jet p
Tmeasurement, varying from about 2% to 0.4% across the same p
Trange. Varying the JES and JER can alter the jet multiplicity of an event, affecting its inclusion into SR-low or SR-ISR regions, as well as affecting the eRJR variables that are dependent on jet and E
missT
kinematics. Similar uncertainties account for the energy scale and resolution of electrons [50] and muons [52], with the muon uncertainties having a negligible impact on the analysis. Variations on the per-object uncertainties are propagated through the E
missT
calculation, with additional uncertainties for the scale and resolution of the soft-term [61, 63].
Additional experimental uncertainties account for differences between data and MC simulation in the efficiency of the identification, reconstruction, isolation requirements, and triggering of electrons [51]
and muons [52], as well as on the identification of pileup jets by the Jet Vertex Tagger [56, 57]. These uncertainties are found to have a negligible effect in both signal regions. An uncertainty is applied on the measured hµi distribution, which is shifted by +14% /− 6% in data before reweighting the hµi in MC simulation to match that of data, and is found to have an effect below 1% in both signal regions. The uncertainty in the combined 2015-2018 integrated luminosity is 1.7%, but has a greatly reduced impact on the background estimation due to the CR normalization procedure. It is derived from calibration of the luminosity scale using x - y beam-separation scans, following a methodology similar to that detailed in Ref. [64], and using the LUCID-2 detector for the baseline luminosity measurements [65].
The theoretical uncertainties account for any mismodeling of the MC simulation, particularly for the
W Z process. They include QCD scale uncertainties on the W Z cross-section, PDF uncertainties, and
obs_x_VRlow_L3_H31
Events / 25 GeV
−1
10 1 10 102
103
) = (200,100) GeV
0
χ∼1
±, χ∼1 0/ χ∼2
m(
Data Total SM
WZ ZZ
Fake/non-prompt Others Top-quark like
Preliminary ATLAS
= 13 TeV, 139 fb-1
s VR-low
[GeV]
boost
H
250 300 350 400 450 500 550 600 650 700
Data/SM 0
1 2
(a) H
boostobs_x_VRISR_L3_pTISR
Events / 20 GeV
−1
10 1 10 102
103
) = (200,100) GeV
0
χ∼1
±, χ∼1 0/ χ∼2
m(
Data Total SM
WZ ZZ
Fake/non-prompt Others Top-quark like
Preliminary ATLAS
= 13 TeV, 139 fb-1
s VR-ISR
[GeV]
jets
pT
100 150 200 250 300 350 400 450 500
Data/SM 0
1 2
(b) p
jetsT
obs_x_VRsmallpTsoft_L3_RISR
Events
−1
10 1 10 102
103
) = (200,100) GeV
0
χ∼1
±, χ∼1 0/ χ∼2
m(
Data Total SM
WZ ZZ
Fake/non-prompt Others Top-quark like
Preliminary ATLAS
= 13 TeV, 139 fb-1
s
soft
VR-ISR small pT
,jets)
miss
R(ET
0.55 0.6 0.65 0.7 0.75 0.8 0.85 0.9 0.95 1
Data/SM 0
1 2
(c) R E
missT
, jets
obs_x_VRsmallRMetJets_L3_pTCM
Events / 5 GeV
−1
10 1 10 102
103
104
) = (200,100) GeV
0
χ∼1
±, χ∼1 0/ χ∼2
m(
Data Total SM
WZ ZZ
Fake/non-prompt Others Top-quark like
Preliminary ATLAS
= 13 TeV, 139 fb-1
s
, jets)
miss
VR-ISR small R(ET
[GeV]
soft
pT
0 5 10 15 20 25
Data/SM 0
1 2
(d) p
softT
Figure 3: Kinematic distributions showing the data and post-fit background in (a) VR-low for H
boost, (b) VR-ISR for p
jetsT
, (c) VR-ISR-small p
softT
for R E
missT
, jets
, and (d) VR-ISR-small R E
missT
, jets for p
softT
. The first (last) bin includes underflow (overflow). The category Others contains backgrounds from triboson, Higgs boson, tt + X , t Z , 3-top, and 4-top processes. The bottom panel shows the ratio between the data and the post-fit background prediction.
The hatched bands indicate the combined theoretical, experimental, and MC statistical uncertainties.
varying α
Swithin its uncertainty. QCD scale uncertainties are evaluated using seven-point variations of the factorization and renormalization scales in the matrix elements. The scales are varied independently upwards and downwards by a factor 2, but without shifting them both in the same direction simultaneously.
PDF uncertainties for the nominal PDF set are evaluated by taking the envelope of the 100 variation replicas and the central values of the CT14nnlo [66] and MMHT2014 NNLO [67] PDF sets. The impact of
± 0 . 001 shifts of α
S, the strong coupling constant, on the acceptance is also considered. The QCD scale
uncertainty is dominant and affects the prediction of the amount of additional radiation, and therefore the jet
multiplicity, within an event. It has an impact of 17% on the yield in the jet-populated SR-ISR region, and
a smaller impact of 3.4% in the jet-vetoed SR-low. The size of the QCD scale uncertainty grows with the
number of jets in an event, but the total uncertainty on the transfer factor is reduced by similarities in the jet
multiplicity distribution in the control and signal regions. Uncertainties on the cross-section are included
for the signals and minor backgrounds whose yields are taken directly from MC simulation, with signal
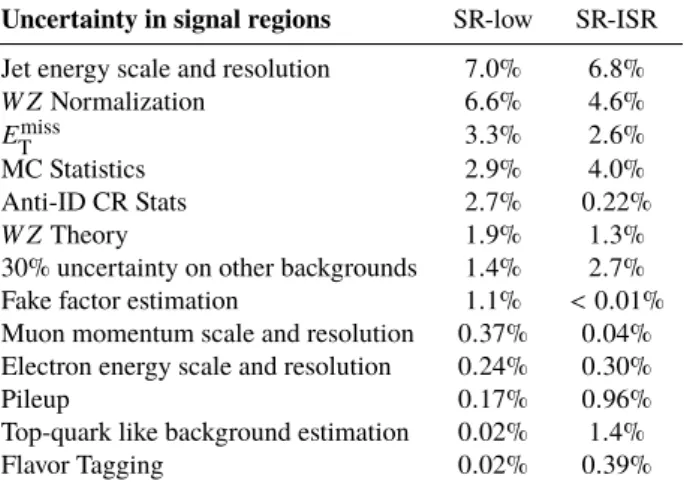
Table 5: Summary of the dominant experimental and theoretical uncertainties on the SM background prediction in the low-mass and ISR signal regions. The individual uncertainties can be correlated, and do not necessarily add in quadrature to the total post-fit background uncertainty.
Uncertainty in signal regions SR-low SR-ISR Jet energy scale and resolution 7 . 0% 6 . 8%
W Z Normalization 6 . 6% 4 . 6%
E
missT
3 . 3% 2 . 6%
MC Statistics 2 . 9% 4 . 0%
Anti-ID CR Stats 2.7% 0.22%
W Z Theory 1 . 9% 1 . 3%
30% uncertainty on other backgrounds 1 . 4% 2 . 7%
Fake factor estimation 1 . 1% < 0 . 01%
Muon momentum scale and resolution 0 . 37% 0 . 04%
Electron energy scale and resolution 0.24% 0.30%
Pileup 0 . 17% 0 . 96%
Top-quark like background estimation 0.02% 1.4%
Flavor Tagging 0 . 02% 0 . 39%
uncertainties varying with ˜ χ
±1
/ ˜ χ
02
mass from 4.3% at 100 GeV up to 11.5% at 750 GeV. Uncertainties on the amount of initial and final state radiation are derived for each signal sample by considering the ten eigenvariations of the A14 [37] tune summed in quadrature, giving uncertainties of 15 to 30%.
The systematic uncertainty on the data-driven fake estimation accounts for statistical uncertainties on the measured fake factors, assumptions made by the fake factor method, and the closure of the method using MC simulation. The number of MC simulation events with prompt leptons, primarily from W Z events, that is subtracted in the fake factor estimation is varied upwards and downwards by the W Z cross-section uncertainty of 5% [68], leading to an uncertainty on the fake estimation of 6.7% for electrons and 15.3%
for muons. The nominal fake estimation is parameterized in lepton p
T, and good agreement is generally seen for other kinematic variables in the fake control and validation regions. A slight dependence on |η| is seen, with typical deviations of 25% for electrons and 21% for muons taken as an additional uncertainty.
The method closure uncertainty derives the fake estimation using Z +jets MC simulation and compares the predictions in the signal region against the direct fake prediction from MC simulation, accounting for potential differences in the fake composition between regions. Good agreement is generally seen given the poorer statistics of fake events in MC simulation, and uncertainties of 12% and 18% are assigned for electrons and muons, respectively. The total impact of the fake factor uncertainties is relatively small in both signal regions given the small contribution from backgrounds with fake leptons.
The dominant uncertainties are summarized in Table 5 for both the SR-low and SR-ISR regions. The largest experimental uncertainties reflect the unknowns of the energy and p
Tcalibration of jets and the measurement of the soft term of the E
missT
. The largest theoretical source is the uncertainty on the QCD
factorization and renormalization scales on the W Z cross-section. The analysis also accounts for the
statistical uncertainty of the MC simulation samples.
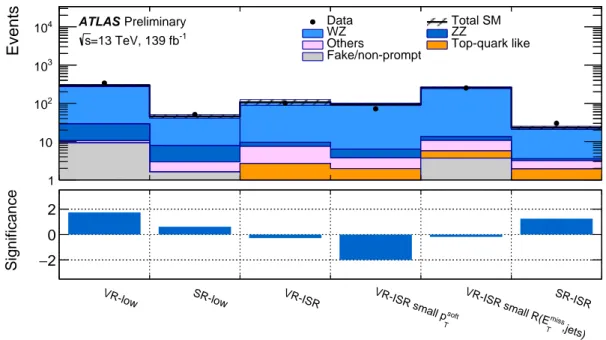
Events
1 10 102
103
104 Data Total SM
WZ ZZ
Others Top-quark like Fake/non-prompt
=13 TeV, 139 fb-1
s
Preliminary ATLAS
VR-low SR-low VR-ISR
soft T
VR-ISR small p
,jets)
miss T
VR-ISR small R(E SR-ISR
Significance 2 −
0 2
Figure 4: The observed data and expected SM background yields in the VRs and SRs. The SM background prediction is derived with the background-only fit configuration, and the hatched band includes the experimental, theoretical, and statistical uncertainties. The bottom panel shows the significance [69] of the differences between the observed and expected yields.
9 Results
The HistFitter package [70] is used to compute the statistical interpretation based on a log-likelihood method [71]. All the systematic uncertainties are treated as Gaussian nuisance parameters in the likelihood.
To determine the background prediction, the control regions are used to constrain the fit parameters assuming no signal events in the CR, referred to as a background-only fit. Normalization factors on the W Z MC simulation are derived from a simultaneous background-only fit of the two orthogonal CRs with all other background processes held constant. The normalization factors are found to be 0 . 84 ± 0 . 07 for CR-low and 0 . 94 ± 0 . 05 for CR-ISR. The two normalization factors are compatible within their uncertainties (described in Section 8), with small differences expected due to the difficulties in accurately modeling higher-order radiation in the electroweak W Z process.
The observed event yields in the low-mass and ISR regions are compared to the fitted background estimation derived from the log-likelihood fits in Table 6 and visualized alongside the validation regions in Figure 4.
The data agrees well with the background estimation in both signal regions, with SR-ISR showing only a small 1 . 27 σ excess of data with respect to the predictions. Kinematic distributions for these SRs are shown in Figures 5 and 6, demonstrating good agreement between data and the background estimation in the SRs and across the boundaries of the SR selections.
As no significant excess is observed, model-independent limits are derived at 95% confidence level (CL)
using the CL
sprescription [72]. An upper limit on the visible cross section of beyond-the-SM processes is
Table 6: The observed and expected yields after the background-only fit in the SRs. The normalization factors of the W Z sample for the low-mass and ISR regions are different and are treated separately in the combined fit. The Other category includes triboson, Higgs boson, and rare top-quark processes. Combined statistical and systematic uncertainties are presented. The individual uncertainties can be correlated and do not necessarily add in quadrature to the total background uncertainty.
SR-low SR-ISR
Observed events 51 30
Fitted SM events 46 ± 5 23 . 0 ± 2 . 2 W Z 38 ± 5 19 . 5 ± 2 . 0 Z Z 4 . 9 ± 0 . 6 0 . 38 ± 0 . 07 Others 1 . 3 ± 0 . 7 1 . 2 ± 0 . 7 Top-quark like 0 . 03
+0.18−0.031 . 9 ± 0 . 8 Fake/non-prompt 1 . 6 ± 1 . 3 0 . 01
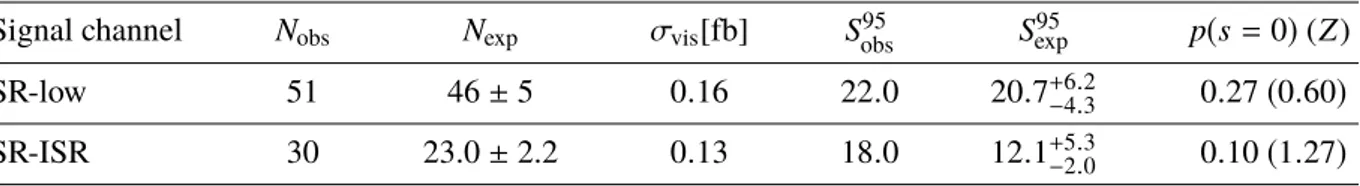
+0.05−0.01Table 7: Summary of the expected background and data yields in SR-low and SR-ISR. The second and third columns show the data and total expected background with systematic uncertainties. The fourth column gives the model-independent upper limits at 95% CL on the visible cross section ( σ
vis). The fifth and sixth columns give the visible number of observed ( S
95obs
) and expected ( S
exp95) events of a generic beyond-the-SM process, where uncertainties on S
exp95reflect the ± 1 σ uncertainties on the background estimation. The last column shows the discovery p -value and Gaussian significance Z assuming no signal.
Signal channel N
obsN
expσ
vis[fb] S
95obs
S
95exp
p(s = 0 ) ( Z ) SR-low 51 46 ± 5 0 . 16 22 . 0 20 . 7
+6−4..230 . 27 ( 0 . 60 ) SR-ISR 30 23.0 ± 2.2 0 . 13 18 . 0 12 . 1
+5−2.0.30 . 10 ( 1 . 27 )
derived for each SR. A log-likelihood fit is performed to the number of observed events in the target SR and the associated CR, and a generic BSM process is assumed to contribute to the SR only. No theoretical or systematic uncertainties are considered for the signal model except the luminosity uncertainty. The observed ( S
95obs
) and expected ( S
95exp
) limits on the number of BSM events are shown in Table 7. Also shown are the observed limits on the visible cross section σ
vis, defined as S
95obs
normalized to the integrated luminosity, which represents the product of the production cross section, acceptance, and selection efficiency of a generic BSM signal. Limits on σ
visare set at 0.16 fb in SR-low and 0.13 fb in SR-ISR. The p -value, representing the probability of the SM background alone fluctuating to the observed number of events, and the associated significance Z are also shown.
Exclusion limits are derived at 95% CL for the ˜ χ
±1
χ ˜
02