from the first four-week science run of KATRIN
M. Aker,1 K. Altenm¨uller,2, 3 A. Beglarian,4 J. Behrens,5, 6 A. Berlev,7U. Besserer,1 B. Bieringer,8 K. Blaum,9 F. Block,5 B. Bornschein,1 L. Bornschein,6 M. B¨ottcher,8 T. Brunst,2, 10 T. S. Caldwell,11, 12 L. La Cascio,5
S. Chilingaryan,4 W. Choi,5 D. D´ıaz Barrero,13 K. Debowski,14 M. Deffert,5 M. Descher,5 P. J. Doe,15 O. Dragoun,16 G. Drexlin,5 S. Dyba,8 F. Edzards,2, 10 K. Eitel,6 E. Ellinger,14 R. Engel,6 S. Enomoto,15 M. Fedkevych,8 A. Felden,6 J. A. Formaggio,18F. M. Fr¨ankle,6 G. B. Franklin,19 F. Friedel,5 A. Fulst,8 K. Gauda,8
W. Gil,6 F. Gl¨uck,6 R. Gr¨ossle,1 R. Gumbsheimer,6 T. H¨ohn,6 V. Hannen,8 N. Haußmann,14 K. Helbing,14 S. Hickford,5 R. Hiller,5 D. Hillesheimer,1 D. Hinz,6 T. Houdy,2, 10 A. Huber,5 A. Jansen,6 L. K¨ollenberger,6 C. Karl,2, 10 J. Kellerer,5 L. Kippenbrock,15M. Klein,6, 5 A. Kopmann,4 M. Korzeczek,5 A. Koval´ık,16B. Krasch,1
H. Krause,6 T. Lasserre,3,∗ T. L. Le,1 O. Lebeda,16 N. Le Guennic,10 B. Lehnert,20 A. Lokhov,8, 7 J. M. Lopez Poyato,13K. M¨uller,6 M. Machatschek,5 E. Malcherek,6 M. Mark,6 A. Marsteller,1 E. L. Martin,11, 12 C. Melzer,1 S. Mertens,2, 10S. Niemes,1 P. Oelpmann,8A. Osipowicz,21D. S. Parno,19A. W. P. Poon,20F. Priester,1
M. R¨ollig,1 C. R¨ottele,1, 6, 5O. Rest,8R. G. H. Robertson,15 C. Rodenbeck,8 M. Ryˇsav´y,16 R. Sack,8 A. Saenz,22 A. Schaller (n´ee Pollithy),2, 10 P. Sch¨afer,1 L. Schimpf,5 M. Schl¨osser,1 K. Schl¨osser,6 L. Schl¨uter,2, 10 M. Schrank,6 B. Schulz,22M. ˇSefˇc´ık,16 H. Seitz-Moskaliuk,5 V. Sibille,18 D. Siegmann,2, 10 M. Slez´ak,2, 10 F. Spanier,6 M. Steidl,6
M. Sturm,1 M. Sun,15 H. H. Telle,13 T. Th¨ummler,6 L. A. Thorne,19 N. Titov,7 I. Tkachev,7 N. Trost,6 D. V´enos,16 K. Valerius,6 A. P. Vizcaya Hern´andez,19 S. W¨ustling,4M. Weber,4 C. Weinheimer,8 C. Weiss,23
S. Welte,1J. Wendel,1 J. F. Wilkerson,11, 12 J. Wolf,5 W. Xu,18 Y.-R. Yen,19 S. Zadoroghny,7 and G. Zeller1 (KATRIN Collaboration)
1Tritium Laboratory Karlsruhe (TLK), Karlsruhe Institute of Technology (KIT), Hermann-von-Helmholtz-Platz 1, 76344 Eggenstein-Leopoldshafen, Germany
2Technische Universit¨at M¨unchen, James-Franck-Str. 1, 85748 Garching, Germany
3IRFU (DPhP & APC), CEA, Universit´e Paris-Saclay, 91191 Gif-sur-Yvette, France
4Institute for Data Processing and Electronics (IPE), Karlsruhe Institute of
Technology (KIT), Hermann-von-Helmholtz-Platz 1, 76344 Eggenstein-Leopoldshafen, Germany
5Institute of Experimental Particle Physics (ETP), Karlsruhe Institute of Technology (KIT), Wolfgang-Gaede-Str. 1, 76131 Karlsruhe, Germany
6Institute for Astroparticle Physics (IAP), Karlsruhe Institute of Technology (KIT), Hermann-von-Helmholtz-Platz 1, 76344 Eggenstein-Leopoldshafen, Germany
7Institute for Nuclear Research of Russian Academy of Sciences, 60th October Anniversary Prospect 7a, 117312 Moscow, Russia
8Institut f¨ur Kernphysik, Westf¨alische Wilhelms-Universit¨at M¨unster, Wilhelm-Klemm-Str. 9, 48149 M¨unster, Germany
9Max-Planck-Institut f¨ur Kernphysik, Saupfercheckweg 1, 69117 Heidelberg, Germany
10Max-Planck-Institut f¨ur Physik, F¨ohringer Ring 6, 80805 M¨unchen, Germany
11Department of Physics and Astronomy, University of North Carolina, Chapel Hill, NC 27599, USA
12Triangle Universities Nuclear Laboratory, Durham, NC 27708, USA
13Departamento de Qu´ımica F´ısica Aplicada, Universidad Autonoma de Madrid, Campus de Cantoblanco, 28049 Madrid, Spain
14Department of Physics, Faculty of Mathematics and Natural Sciences, University of Wuppertal, Gaußstr. 20, 42119 Wuppertal, Germany
15Center for Experimental Nuclear Physics and Astrophysics, and Dept. of Physics, University of Washington, Seattle, WA 98195, USA
16Nuclear Physics Institute of the CAS, v. v. i., CZ-250 68 ˇReˇz, Czech Republic
17Institute for Technical Physics (ITEP), Karlsruhe Institute of Technology (KIT), Hermann-von-Helmholtz-Platz 1, 76344 Eggenstein-Leopoldshafen, Germany
18Laboratory for Nuclear Science, Massachusetts Institute of Technology, 77 Massachusetts Ave, Cambridge, MA 02139, USA
19Department of Physics, Carnegie Mellon University, Pittsburgh, PA 15213, USA
20Institute for Nuclear and Particle Astrophysics and Nuclear Science Division, Lawrence Berkeley National Laboratory, Berkeley, CA 94720, USA
21University of Applied Sciences (HFD) Fulda, Leipziger Str. 123, 36037 Fulda, Germany
22Institut f¨ur Physik, Humboldt-Universit¨at zu Berlin, Newtonstr. 15, 12489 Berlin, Germany
23Project, Process, and Quality Management (PPQ), Karlsruhe Institute of Technology (KIT), Hermann-von-Helmholtz-Platz 1, 76344 Eggenstein-Leopoldshafen, Germany
(Dated: November 11, 2020)
We report on the light sterile neutrino search from the first four-week science run of the KATRIN experiment in 2019. Beta-decay electrons from a high-purity gaseous molecular tritium source are analyzed by a high-resolution MAC-E filter down to 40 eV below the endpoint at 18.57 keV. We consider the framework with three active neutrinos and one sterile neutrino of mass m4. The analysis is sensitive to a fourth mass statem24.1000 eV2 and to active-to-sterile neutrino mixing
arXiv:2011.05087v1 [hep-ex] 10 Nov 2020
ments of neutrino oscillations in the three flavour frame- work have determined all mixing angles and mass split- tings [1]. In 2011, a re-evaluation of the prediction of electron antineutrino spectra emitted by nuclear reactor cores revealed a significant discrepancy between detected and expected fluxes at baselines below 100 m, known as the reactor antineutrino anomaly (RAA) [2]. Moreover, both the GALLEX and SAGE solar-neutrino detectors had earlier independently reported a deficit of electron neutrino flux from 37Ar and 51Cr electron-capture de- cays [3, 4], known as the gallium anomaly (GA). The sig- nificance of these anomalies is debated, mainly due to the difficulty of assessing systematic uncertainties (see [5, 6]
for recent discussions). Nonetheless, these electron neu- trino disappearance data could be explained by assum- ing the existence of a sterile neutrino, i.e. a non-standard neutrino that does not interact weakly, with a mass of the order of 1 eV or larger [7].
The Karlsruhe Tritium Neutrino experiment (KA- TRIN) [8–11], displayed in figure 1, provides high- precision electron spectrum measurement of the tri- tium β-decay, 3H → 3He+ + e− + ¯νe (endpoint E0
= 18.57 keV, half-life t1/2 = 12.32 yr). KATRIN has been designed to improve the sensitivity on the effec- tive mass of neutrinos, mν, down to 0.2 eV (90% con- fidence level). Based on its first four-week science run in spring 2019, KATRIN reported an effective neutrino mass square value of (−1.0 + 0.9−1.1) eV2, leading to an up- per limit of mν < 1.1 eV (90% confidence level) [12].
Using the same data set, it is also possible to limit the mass and mixture of a sterile neutrino. Indeed, a new non-standard neutrino mass state, mainly sterile, would manifest itself as a distortion of the spectrum of the β- decay electrons. The signature would be a kink-like fea- ture, as can be seen with a simulation presented in fig- ure 2 b, standing out on top of the expected smooth tritium β-spectrum (figure 2 a). Previous phenomeno- logical studies have examined the ultimate sensitivity of KATRIN to light sterile neutrinos [13–15]. Moreover, an analysis of the four-week data set from the first sci- ence run was undertaken in [16], although not all the inputs and data necessary for a comprehensive analysis were available yet. In this letter, we report the first re- sult of KATRIN’s search for light sterile neutrinos down to 40 eV below the endpoint.
Experimental Setup.– KATRIN combines a windowless gaseous molecular tritium source (WGTS) [17], with a spectrometer section based on the principle of magnetic
∗Corresponding author: thierry.lasserre@cea.fr
E-filter) [18–21]. Figure 1 gives an overview of the 70 m long experimental setup located at the Karlsruhe Insti- tute of Technology (KIT) in Germany. Source-related components in contact with tritium, displayed in figure 1 a-c, are integrated into the Tritium Laboratory Karlsruhe to enable a closed cycle of tritium [22]. High-purity tri- tium gas is continuously injected at 30 K into the WGTS.
The gas then diffuses to the ends of the source where it is pumped out by a series of turbomolecular pumps. In combination with the 3 K cryotrap (CPS), the flow rate of tritium into the following spectrometer and detector section (figure 1 d-f) is reduced by more than 14 orders of magnitude to suppress source-related background [8].
Electrons are adiabatically guided towards the spectrom- eters by the source magnetic field (BWGTS = 2.52 T) and other superconducting magnets [23] in the pumping section. High-precision spectroscopy is achieved by the MAC-E-filter technique, where electrons of chargeqare guided by the magnetic field and filtered by an electro- static barrier called the retarding potential energy, qU, set by a specific High Voltage (HV) setting. Only elec- trons with enough energy to overcome this barrier are transmitted to the detector section. By varying and pre- cisely monitoring qU the tritium β-decay spectrum is scanned in an integral mode, with an energy resolution
∆E = 2.8 eV at E0. Transmitted electrons are finally counted, as a function ofqU, in a segmented monolithic silicon detector array composed of 148 pixels [24].
Measurements of the tritiumβ-spectrum.– The perfor- mance of the KATRIN systems and integrated beam- line, specified in [9], was established by a sequence of long-term measurements reported in [10, 22, 23, 25, 26].
In this work we use the data from KATRIN’s first high-purity tritium campaign, which ran from April 10 to May 13, 2019, at an average source activity of 2.45·1010 Bq. The averaged column density ρdexp = 1.11·1017 molecules cm−2 of our analyzed data sample is a factor of 5 less than its nominal value. The isotopic tritium purityεT(0.976) is derived from the average con- centration of the tritiated species T2(0.953), HT (0.035), and DT (0.011), continuously monitored using Raman spectroscopy [27].
The integral tritium β-decay spectrum is scanned re- peatedly in a range of [E0−90 eV,E0+50 eV] by applying series of non-equidistant HV settings to the spectrometer electrode system. Each scan takes a net time of 2 h. At each HV set point, the transmitted electrons are counted over time intervals varying from 17 to 576 s. In this search for sterile neutrinos, we analyze a range of scans covering the region from 40 eV below E0 (22 HV set points) to 50 eV above (5 HV set points), as shown in the measurement time distribution in figure 2 c.
FIG. 1. Main components of the KATRIN experiment: a) the rear section, b) the windowless gaseous tritium source, c) the pumping section, d) the pre-spectrometer, e) the main spectrometer, f) the electron detector.
a)
-40 -20 0 20 40
100 101
Count rate (cps)
KATRIN data with 1 error bars 50 3- model
b)
-40 -20 0 20 40
0.98 1
Ratio 3- model
3+1 model 3+1 simulation m
4 = 10.0 eV |U e4|2 = 0.01
c)
-40 -20 0 20 40
Retarding energy - 18574 (eV) 0
25 50
Time (h)
FIG. 2. a) Electron spectrum of experimental dataR(hqUi) over the interval [E0−40 eV, E0+50 eV] from all 274 tri- tium scans and the three-neutrino mixing best-fit model Rcalc(hqUi) (line). The integralβ-decay spectrum extends to E0 on top of a flat backgroundRbg. 1-σstatistical errors are enlarged by a factor 50. b) Simulation of an arbitrary sterile neutrino imprint on electron spectrum. The ratio of the sim- ulated data without fluctuation, including a fourth neutrino of massm4 = 10 eV and mixing|Ue4|2 = 0.01, to the three- neutrino mixing model is shown (red solid line). c) Integral measurement time distribution of all 27 HV set points.
Data Analysis.- We first apply quality cuts to slow con- trol parameters associated with each tritium scan (27 HV set points). This results in the selection of 274 stable scans with an overall scanning time of 521.7 h. We then select the 117 most similar pixels (79% of the sensitive area of the detector) and combine them into a single large effective pixel. The good temporal stability of the scan- ning process is verified by fits to the 274 single scansβ- decay endpoints. The good temporal stability allows us to stack the data from all 274 scans into one single 90-eV- wide spectrum, which is displayed in figure 2a in units of
counts per second (cps). Thanks to the excellent repro- ducibility of the HV set pointsqUl,k over all scans kfor eachl= 1−27 (RMS = 34 mV), we associate the mean HVhqUilover all scanskto each HV set pointl. The re- sulting stacked integral spectrum,R(hqUi), includes 2.03·
106 events, with 1.48·106β-decayelectrons expected be- lowE0and a flat background ensemble of 0.55·106events in the whole scan interval (0.41·106 background events expected below E0). This background originates from the spectrometer and has two major sources: first, the thermal ionization of Rydberg atoms sputtered off the inner spectrometer surfaces by 206Pb-recoil ions follow- ing α-decays of 210Po; second, the secondary electrons induced by α-decays of single 219Rn atoms emanating from the vacuum pumps of the spectrometer. The re- sulting electrons at sub-eV energies are accelerated to qU by the MAC-E-filter. The radon-induced background causes a small non-Poissonian component (see [12] for details). Nonetheless, in comparison to short baseline oscillation experiments [28–30], our search for sterile neu- trinos is performed with a high signal-to-background ra- tio, rapidly increasing from 1 athqUi=E0−12 eV to>70 athqUi=E0−40 eV.
Experimental spectrum modelling.– The modelled ex- perimental spectrum Rcalc(hqUi) is the convolution of the differential β-spectrum Rβ(E) with the calculated response functionf(E− hqUi), in addition to an energy- independent background rateRbg:
Rcalc(hqUi) =As · NT
Z
Rβ(E)·f(E− hqUi)dE
+Rbg , (1)
where As is the tritium signal amplitude. NT denotes the number of tritium atoms in the source multiplied with the accepted solid angle of the setup ∆Ω/4π = (1−cosθmax)/2, with θmax = 50.4◦, and the detector efficiency (0.95).
The differential spectrum Rβ(E) from the super- allowedβ-decay of molecular tritium is given by:
Rβ(E) = G2F·cos2ΘC
2π3 · |Mnucl2 | ·F(E, Z0) (2)
·(E+me)·p
(E+me)2−me2
·X
j
ζj·εj·q
ε2j−m2ν·Θ(εj−mν),
(i. e. a rotational, vibrational, and electronic) state with excitation energyVj, as described in [12]. In addition, our calculations include radiative corrections [11] and we take into account the thermal Doppler broadening at 30 K.
The response functionf(E−hqUi) describes the trans- mission probability of an electron as a function of its sur- plus energyE− hqUi. It depends on the angular spread of electrons and the amount of neutral gas they pass through in the source, where they can undergo inelas- tic scattering processes (see [12] for details).
In the standard three-neutrino framework the effective neutrino mass is defined through m2ν =P3
k=1|Uek|2m2k, whereUis the 3×3 PMNS unitary mixing matrix andmk
is the mass of the neutrinoνk, withk= 1,2,3. According to this framework, later referred to as the null hypothe- sis, the experimental spectrumR(hqUi) is well described by the model of the response functionf and by the back- groundRbg= (293±1) mcps mainly constrained by the 5 HV set points aboveE0. A fit ofAs,E0,Rbg, andm2ν, allowed us to constrain the active neutrino mass to be less than 1.1 eV at 90% confidence level [12].
Sterile Neutrino Search.– We now extend the experi- mental modelling, fit and statistical analysis to constrain both the sterile neutrino mass squaredm24and its mixing
|Ue4|2. In all other respects we apply the same analysis strategy as for our first neutrino mass analysis [12].
In the extension to 3+1 active-sterile neutrinos, the effective neutrino mass can be redefined as m2ν = P|Uek|2m2k(1− |Ue4|2)−1. The electron spectrum,Rβ, is replaced byRβ(E, mν, m4) = (1 − |Ue4|2)Rβ(E, m2ν) +
|Ue4|2Rβ(E, m24), whereU is the extended 4×4 unitary matrix, Rβ(E, m2ν) is the differential electron spectrum (eq. 2) associated to decays including active neutrinos in the final state, and Rβ(E, m24) describes the addi- tional spectrum associated to decays involving a sterile neutrino of massm4. The observable integral spectrum Rcalc is henceforth modeled with six free parameters:
the signal amplitude As, the effective β-decay endpoint E0, the background rate Rbg, the effective active neu- trino mass squaredm2ν, the sterile neutrino mass squared m24, and the mixing parameter |Ue4|2. This extended modelRcalc(hqUi) is then fitted to the experimental data R(hqUi).
In order to mitigate bias, the full analysis is first con- ducted on a Monte Carlo-based (MC) data set before turning to the actual data. For each experimental scan k we generate a “MC twin”, Rcalc(hqUi)k, from its av- eraged slow-control parameters and the measured back- ground rate and endpoint. The “MC twin” analysis al- lows us to verify the accuracy of our parameter infer- ence by retrieving the correct input MC values. This ap-
a “shape-only” fit, bothE0andAsare left unconstrained.
To propagate systematic uncertainties, a covariance ma- trix is computed after performingO(104) simulations of Rcalc(hqUi), while varying the relevant parameters for each calculation according to their likelihood [12, 31–33].
The sum of all matrices encodes the total uncertainties ofRcalc(hqUi) and their HV set point-dependent correla- tions. Theχ2-estimator is then minimized to determine the best-fit parameters, and the shape of theχ2-function is used to infer the uncertainties.
To obtain the sterile neutrino constraints, fits are per- formed on a 50×50 [ log(|Ue4|2), log(m24) ] grid (starting at the null hypothesis), by keeping|Ue4|2 and m24 con- stant and minimizing the χ2 with respect to all other free parameters. A finer mesh does not significantly change our results. The 95% confidence level is given by the contour, where ∆χ2=χ2−χ2min= 5.99, assum- ing Wilk’s theorem [34] for two degrees of freedom. χ2min is the global minimum of all χ2 values obtained in the grid scan. We have verified that the global minimum lies within the physical region defined as|Ue4|2∈[0,0.5] and m24 ≥ 0. The correct coverage of this approach is vali- dated by means of MC simulations, where thousands of experiments were generated for the null hypothesis and a few sterile neutrino signal hypotheses and analyzed in turn.
Results.- The actual fit range [E0−40 eV,E0+50 eV]
is such that statistical uncertainties on|Ue4|2 fully dom- inate over systematic uncertainties in the whole range of m24considered [12, 35].
In our first and main analysis, labelled case I, we con- sider the hierarchical scenariom1,2,3m4, which justi- fies settingmν to its minimum allowable value. In this work we set mν to zero, which is consistent within our sensitivity with the lower limit derived from neutrino os- cillations (0.009 eV, see [1]).
For each pair of (|Ue4|2, m24) a fit compares the ex- perimental spectrum R(hqUi) to the model Rcalc(hqUi) by only considering Asig, Rbg, E0, as free parameters.
The global best fit minimum is found for the valuesm24
= 73.0 eV2, and |Ue4|2 = 0.034. The χ2 difference be- tween this best fit and the null hypothesis is ∆χ2bf = 1.6.
Assuming the null hypothesis, the probability to obtain
∆χ2bf ≥1.6 is 50%, based on the simulation and analy- sis of 2000 pseudo experiments. Therefore, our experi- mental result is consistent with the null hypothesis and there is no evidence for a sterile neutrino signal. Result- ing 95% confidence level exclusion and sensitivity curves in the (|Ue4|2, m24) plane are shown in figure 3. Our results agree well with the sensitivity estimates. Since the data cover only the last 40 eV of the β-spectrum this analysis is only sensitive tom24 <1600 eV2, with a
maximum sensitivity for m24'400 eV2. For smaller m24 the sensitivity decreases due to the reduction of statis- tics and vanishes for m24 ' 2 eV2. For larger m24 the sensitivity rapidly drops due to the narrow interval in which a sterile neutrino could influence the experimen- tal β-spectrum. Case I allows a direct comparison with previous and similar experiments. This work supersedes the Mainz exclusion limit [36] for m24 .1000 eV2 and improves the Troitsk bounds [37] for m24 . 30 eV2, as displayed in figure 3.
10-2 10-1
|U
e4|2 100
101 102 103
m 42 (eV2 )
Mainz 95% C.L. : m2 = 0 eV2 Troitsk 95% C.L. : m2 = 0 eV2
KATRIN sensitivity 95% C.L. : m2 = 0 eV2 KATRIN 95% C.L. : m2 = 0 eV2 KATRIN 95% C.L. : m2 free
KATRIN 95% C.L. : m2 free , (m2 ) = 1 eV2
FIG. 3. 95% confidence level exclusion curves in the (|Ue4|2, m24) plane obtained from the analysis of KATRIN data including statistical and systematic uncertainties. The two solid lines show the expected sensitivity (light grey) and the associated exclusion (blue) for fixed m2ν = 0 eV2 (case I). The dotted line in dark blue illustrates the exclu- sion curve obtained with a free m2ν (case II). Lastly, the dot-dashed line in turquoise displays the intermediate exclu- sion curve with a free m2ν constrained with an uncertainty σ(m2ν) = 1 eV2 (case III). First KATRIN results supersede the Mainz exclusion limit [36] and improve Troitsk bounds [37]
form24 <30 eV2.
In a second analysis, called case II, we consider a more generic scenario where m2ν is treated as a free and and unconstrained parameter in the fit. Figure 3 shows the resulting 95% confidence level exclusion curves in the (|Ue4|2,m24) plane, only deviating from the upper limit of case I form24<60 eV2. For low mixing,|Ue4|2.0.3, and smallm24<10 eV2, them2ν fitted values are in excellent agreement with our standard neutrino mass analysis [12].
As complementary information, called case III, we dis- play in figure 3 the intermediate exclusion curve that is obtained whenm2ν is treated as a nuisance parameter in the fit, using a Gaussian pull term with the expectation m2ν = 0 eV2and a Gaussian uncertaintyσ(m2ν) = 1 eV2. Comparison with neutrino oscillation experiments.- At this stage it is interesting to compare our results (case I) with short baseline neutrino oscillation experiments mea-
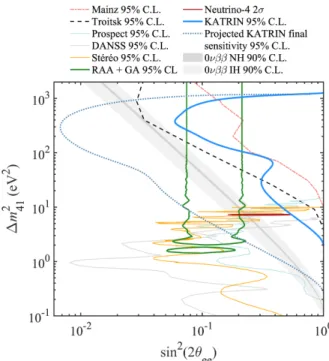
FIG. 4. 95% confidence level exclusion curves in the (sin2(2θee),∆m241) plane obtained from the analysis of KA- TRIN data with fixed mν = 0. The green contour delim- its the 3+1 neutrino oscillations allowed at 95% confidence level by the reactor and gallium anomalies [2]. KATRIN data improve the exclusion of the high ∆m241 values with respect to DANSS, PROSPECT, and St´er´eo reactor spectral ratio measurements [28–30]. Mainz [36] and Troitsk [37] exclusion curves [38] are also displayed for comparison. An estimation of KATRIN’s final sensitivity (1000 days at nominal column density) is represented by the dotted line. The light (dark) gray bands delimit the exclusions from 0νββexperiments, for the case of inverted and normal hierarchies (the extension of the bands reflects the uncertainties of the parameters of the PMNS matrix [1]).
suring the electron (anti-)neutrino survival probability P(∆m241,sin2(2θee)) [7]. To relate the obtained re- sults to KATRIN, the mass splitting can be written as
∆m241 ' m24 −m2ν. According to the measured neu- trino oscillation parameters, this approximation is valid within 2·10−4eV2, the main difference being due to the unknown mass hierarchy and the amplitude of the mixing between active and sterile neutrinos [16]. For the analy- sis case I we simply have ∆m241'm24. Furthermore KA- TRIN is directly sensitive to |Ue4|2 whereas oscillation experiments measure sin2(2θee) = 4|Ue4|2(1 − |Ue4|2).
These first KATRIN data exclude the high ∆m241solution of the reactor and gallium anomalies, for ∆m241values be- tween 100 and 1000 eV2, as depicted in figure 4. Our data also improve the exclusion of DANSS, PROSPECT, and St´er´eo reactor spectral ratio measurements [28–30] for
∆m241 & 10 eV2. The Neutrino-4 hint of large active- sterile mixing [39] is at the edge of our current 95% con-
ground rate of 130 mcps, and design systematic uncer- tainties [9]. KATRIN results will be complementary to short baseline reactor neutrino experiments, improving the global sensitivity for ∆m241&5 eV2.
If sterile neutrinos with|Ue4| 6= 0 are Majorana parti- cles, they will contribute to the effective mass mββ =
|PUei2mi| relevant for 0νββ [2, 43, 44]. Considering m4 m1,2,3 we have the active neutrino contribution tomββ within the ranges 0.01 to 0.05 eV (0 to 0.005 eV) for the inverted (normal) ordering. Our current and fu- ture constraints on Ue4 and m4 can then be confronted with the latest constraints of 0νββ experiments [45, 46], as shown in Figure 4.
Conclusion and outlook.– We have presented an initial search for signatures of a sterile neutrino admixture (3+1 framework) using the first four-week science run of the KATRIN experiment. This search comprises 1.48·106 β-decay electrons and 0.41·106 background events be- low E0, with a signal to background ratio of up to 70.
The analysis is sensitive to mass valuesm4 ranging from about 2 to 40 eV. No significant sterile neutrino signal is observed and exclusion limits on the parameters|Ue4|2 and m4 are obtained. Our best sensitivity is for masses around 20 eV, excluding|Ue4|2&2·10−2. Our result im- proves with respect to bounds set by the previous direct kinematic experiments Mainz and Troitsk. This search is complementary to reactor oscillation experiments and improves their constraints for ∆m241&10 eV2, excluding also a sizable fraction of the allowed parameters of the reactor and gallium anomalies. Our result shows the po- tential of KATRIN to probe the sterile neutrino hypoth- esis with the data collected for determining the active neutrino mass mν. KATRIN will significantly improve its statistics in the next 5 years and further reduce its systematics and background. A large fraction of the re- actor and gallium anomalies’ region of interest will be probed to shed light on the existence of sterile neutrino admixtures.
ACKNOWLEDGMENTS
We acknowledge the support of Helmholtz Association, Ministry for Education and Research BMBF (5A17PDA, 05A17PM3, 05A17PX3, 05A17VK2, and 05A17WO3), Helmholtz Alliance for Astroparticle Physics (HAP), Helmholtz Young Investigator Group (VH-NG-1055), and Deutsche Forschungsgemeinschaft DFG (Research Training Groups GRK 1694 and GRK 2149, and Grad- uate School GSC 1085 - KSETA) in Germany; Ministry of Education, Youth and Sport (CANAM-LM2011019, LTT19005) in the Czech Republic; Ministry of Sci- ence and Higher Education of the Russian Federa- tion under contract 075-15-2020-778; and the United States Department of Energy through grants DE-FG02- 97ER41020, DE-FG02-94ER40818, DE-SC0004036, DE- FG02-97ER41033, DE-FG02-97ER41041, DE-AC02- 05CH11231, DE-SC0011091, and DE-SC0019304, and the National Energy Research Scientific Computing Cen- ter.
D83, 073006 (2011).
[3] W. Hampel et al. (GALLEX), Phys. Lett. B 420, 114 (1998).
[4] J. Abdurashitovet al., Phys. Rev. C80, 015807 (2009).
[5] J. M. Berryman and P. Huber, Phys. Rev. D101, 015008 (2020).
[6] J. Kostensalo, J. Suhonen, C. Giunti, and P. Srivastava, Phys. Lett. B795, 542 (2019).
[7] C. Giunti and T. Lasserre, Annual Review of Nuclear and Particle Science69, 163–190 (2019).
[8] A. Osipowicz et al. (KATRIN), (2001), arXiv:hep- ex/0109033.
[9] J. Angriket al., KATRIN design report, FZKA scientific report (2005).
[10] M. Arenz et al. (KATRIN), JINST 13 (04), P04020 (2018).
[11] M. Kleesieket al., Eur. Phys. J. C79, 204 (2019).
[12] M. Akeret al.(KATRIN), Phys. Rev. Lett.123, 221802 (2019).
[13] A. S. Riis and S. Hannestad, JCAP02, 011 (2011).
[14] J. Formaggio and J. Barrett, Phys. Lett. B 706, 68 (2011).
[15] A. Esmaili and O. L. Peres, Phys. Rev. D 85, 117301 (2012).
[16] C. Giunti, Y. Li, and Y. Zhang, JHEP05, 061.
[17] R. G. H. Robertson, T. J. Bowles, G. J. Stephenson, D. L. Wark, J. F. Wilkerson, and D. A. Knapp, Phys.
Rev. Lett. 67, 957 (1991).
[18] V. M. Lobashev and P. E. Spivak, Nucl. Instrum. Meth- ods A240, 305 (1985).
[19] A. Picard et al., Nucl. Instrum. Methods Phys. Res. B 63, 345 (1992).
[20] C. Krauset al., Eur. Phys. J. C40, 447 (2005).
[21] V. N. Aseevet al., Phys. Rev. D84, 112003 (2011).
[22] F. Priester, M. Sturm, and B. Bornschein, Vacuum116, 42 (2015).
[23] M. Arenz et al. (KATRIN), JINST 13 (08), T08005 (2018).
Particle Physics47, 065002 (2020).
[27] M. Akeret al.(KATRIN), Sensors20, 4827 (2020).
[28] M. Danilov (DANSS), (2019), European Physical Society Conference on High Energy Physics, EPS-HEP2019, 10- 17 July 2019, Ghent, Belgium.
[29] J. Ashenfelter and Others (PROSPECT), Phys. Rev.
Lett.121, 251802 (2018).
[30] H. Almaz´anet al.(STEREO), Phys. Rev. D102, 052002 (2020).
[31] R. J. Barlow, Statistics: a guide to the use of statisti- cal methods in the physical sciences, Manchester physics series (Wiley, Chichester, 1989).
[32] G. D’Agostini, Nucl. Instrum. Methods Phys. Res. A 346, 306 (1994).
[33] M. Akeret al.(KATRIN), Eur. Phys. J. C80, 264 (2020).
[34] S. Wilks, Annals Math. Statist.9, 60 (1938).
[35] M. Akeret al.(KATRIN), under preparation.
[36] C. Kraus, A. Singer, K. Valerius, and C. Weinheimer, Eur. Phys. J. C73, 2323 (2013).
[37] A. I. Belesevet al., JETP Letters97, 67–69 (2013).
[38] C. Giunti, M. Laveder, Y. F. Li, and H. W. Long, Phys.
Rev. D87(2013).
[39] A. Serebrovet al.(Neutrino-4), Pisma Zh.Eksp.Teor.Fiz.
109, 209 (2019).
[40] P. Adamsonet al.(Daya Bay and MINOS+), Phys. Rev.
Lett.125, 071801 (2020).
[41] I. S. Yeo et al., Journal of Physics: Conference Series 888, 012139 (2017).
[42] T. Abrah˜ao et al. (Double Chooz), (2020), arXiv:2009.05515 [hep-ex].
[43] J. Barry, W. Rodejohann, and H. Zhang, JHEP07, 091.
[44] C. Giunti and E. Zavanin, JHEP07, 171.
[45] A. Gandoet al.(KamLAND-Zen), Phys. Rev. Lett.117, 082503 (2016), [Addendum: Phys.Rev.Lett. 117, 109903 (2016)].
[46] M. Agostiniet al.(GERDA), (2020), arXiv:2009.06079 [nucl-ex].
![FIG. 2. a) Electron spectrum of experimental data R(hqU i) over the interval [E 0 −40 eV, E 0 +50 eV] from all 274 tri-tium scans and the three-neutrino mixing best-fit model R calc (hqU i) (line)](https://thumb-eu.123doks.com/thumbv2/1library_info/3995842.1540070/3.918.99.431.284.652/electron-spectrum-experimental-interval-scans-neutrino-mixing-model.webp)