• Keine Ergebnisse gefunden

Investigation of the pp → K + nΣ + reaction at the magnetic spectrometer

N/A
N/A
Protected

Academic year: 2021

Aktie "Investigation of the pp → K + nΣ + reaction at the magnetic spectrometer"

Copied!
101
0
0

Wird geladen.... (Jetzt Volltext ansehen)

Volltext

(1)

Investigation of the pp → K ++ reaction at the magnetic spectrometer

ANKE-COSY

Inaugural-Dissertation zur

Erlangung des Doktorgrades

der Mathematisch-Naturwissenschaftlichen Fakult¨at der Universit¨at zu K¨oln

vorgelegt von Yury Valdau

aus Sosnowy Bor (Rußland)

Forschungszentrum J¨ ulich

2009

(2)

Berichterstatter: Prof. Dr. H. Str¨oher

Prof. Dr. A. Zilges

Tag der m¨ undlichen Pr¨ ufung: 20 Oktober 2009

(3)

Contents

1 The physics case 9

1.1 Introduction . . . . 9

1.2 Experimental data on K + production in pp collisions . . . 11

1.2.1 Inclusive K + production data . . . 11

1.2.2 Bubble chamber data . . . 13

1.2.3 The pp → K + pΛ reaction . . . 13

1.2.4 The pp → K +0 reaction . . . 17

1.2.5 The pp → K ++ reaction . . . 19

1.2.6 Other hyperon production channels . . . 22

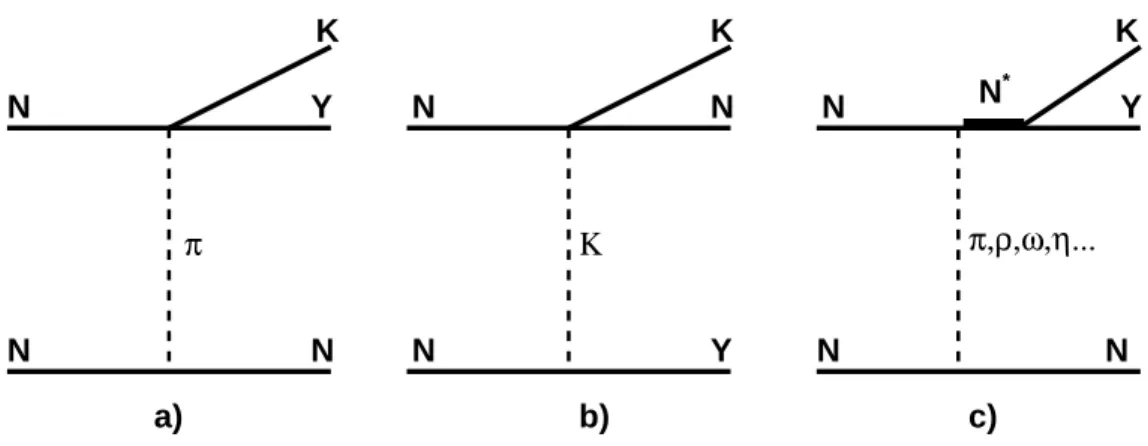
1.3 Theoretical models for the different K + production channels . 23 1.3.1 Meson exchange model . . . 24

1.3.2 Resonance model . . . 25

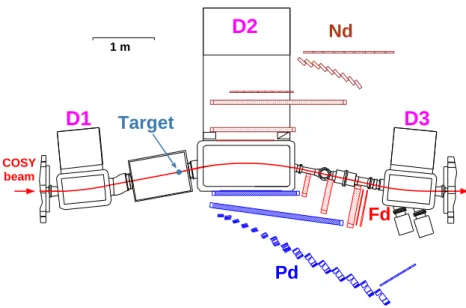
2 Experimental setup 27 2.1 The ANKE magnetic spectrometer . . . 27

2.2 Detection systems . . . 30

2.2.1 Positive side detection system . . . 30

2.2.2 Forward detection system . . . 31

2.2.3 Other detection systems not used in analysis . . . 32

2.3 Electronics, online triggers and data acquisition system . . . . 33

2.4 Experimental conditions during datataking . . . 34

3 Data analysis 37 3.1 Detector positions . . . 37

3.2 Experimental methods . . . 40

3.2.1 Time of flight . . . 40

3.2.2 Delayed veto technique . . . 42

3.2.3 Vertical angle cut . . . 44

3.2.4 Track selection and neighbouring counter analysis . . . 45

3.2.5 Momentum reconstruction . . . 46

3.2.6 Time calibrations . . . 47

(4)

3.3 Particle identification . . . 49

3.3.1 K + identification . . . 49

3.3.2 Identification of protons in the Fd correlated with K + 51 3.3.3 Identification of the particle in the Sd correlated with K + 54 3.4 Efficiencies . . . 55

3.4.1 Efficiencies of the MWPCs . . . 56

3.4.2 Efficiencies of the range telescopes . . . 56

3.5 Normalisation . . . 58

3.5.1 Proton-proton elastic scattering . . . 59

3.5.2 The Schottky method . . . 60

4 Extraction of the cross sections 63 4.1 Phenomenological models used in theanalysis . . . 63

4.2 Inclusive K + spectra . . . 65

4.3 Analysis of the K + p correlation events . . . 69

4.4 Analysis of the K + π + correlation events . . . 74

4.5 Extracted total cross sections . . . 77

5 Conclusions 84

6 Outlook 85

A Summary of measurements at different experimental facilities 87

(5)

Zusammenfassung

Die vorliegende Doktorarbeit beschreibt Messungen der pp → K ++ - Reaktion in Schwellenn¨ahe. Die Motivation f¨ ur diese Arbeit liegt im Wesent- lichen im Fehlen von Daten zur Σ + -Hyperon Produktion in pp Kollisio- nen und insbesondere in neuen Messungen der pp → K ++ Reaktion durch die COSY11 Kollaboration. In diesem mit einem Neutrondetektor durchgef¨ uhrten Experiment wurde ein ¨ uberraschend hoher Σ + Wirkungs- querschnitt, der nur schwierig mit Isospin- ¨ Uberlegungen in Einklang zu brin- gen ist, gefunden.

Das in dieser Doktorarbeit beschriebene Experiment wurde mit dem ANKE Detektor am COSY bei vier Energien nahe der Schwelle durchgef¨ uhrt.

Es beruht auf der fast untergrundfreien K + -Identifikation ¨ uber den Nachweis verz¨ogerter K + -Zerfallsprodukte sowie dem Umstand, dass unterhalb der pp → K + nΛπ + Schwelle nur der Σ + → nπ + Zerfall zur K + π + Produktion beitr¨agt. Deshalb erm¨oglicht der Nachweis von K + π + -Paaren eine eindeutige Identifikation der pp → K ++ Reaktion ohne Neutrondetektor.

Die Analyse von drei simultan gemessenen Spektren wurde durchgef¨ uhrt,

um nach Hinweisen auf einen m¨oglicherweise hohen Σ + - Wirkungsquerschnitt

zu suchen. Alle bei den Experimentenergien erlaubten K + -Produktions-

kan¨ale tragen zu inklusiven K + - sowie K + p-Korrelationsspektren bei. In

den inklusiven K + - Verteilungen sind die Beitr¨age der verschiedenen Produk-

tionskan¨ale aufsummiert und k¨onnen nur durch theoretische Modelle unter-

schieden werden. In den K + p-Korrelationsspektren werden nicht nur Signale

von prim¨ar erzeugte Protonen, sondern auch durch Protonen aus Hyperon-

zerf¨allen verzeichnet. Demnach tragen Ereignisse aus Σ + → pπ 0 Zerf¨allen

zur fehlenden K + p Masse bei. Die K + π + -Korrelationen lassen die Identifika-

tion der Σ + Reaktionskan¨ale und eine Absch¨atzung des totalen Wirkungs-

querschnittes zu. Diese Methode wurde erfolgreich auf existierende ANKE-

Daten von August 2003 angewendet und f¨ uhrte zu einer Publikation in einem

referierten Journal. Die Analyse der experimentellen Daten von September

2007 f¨ uhrt zu folgenden Ergebnissen:

(6)

• Die totalen pp → K ++ Wirkungsquerschnitte sind bei den vier Experimentenergien um zwei Gr¨oßenordnungen kleiner als die durch COSY11 ver¨offentlichten.

• Die totalen Λ- und Σ 0 -Wirkungsquerschnitte wurden aus K + p invariant- fehlender-Masse Spektren extrahiert und sind im Einklang mit dem Weltdatensatz, wenn man von dem Datenpunkt f¨ ur Σ 0 bei niedrigster Energie absieht, der mit technischen Problemen behaftet ist.

• Der inklusive doppelt differentielle Wirkungsquerschnitt wurde aus K + - Daten extrahiert und wird durch ein verbessertes Model, welches die totalen Wirkungsquerschnitte aus K + p- und K + π + - Analysen ber¨ uck- sichtigt, beschrieben.

Die in dieser Doktorarbeit dargestellen neuen experimentellen Ergeb-

nisse vervollst¨andigen und verbessern die Datenbasis im Bereich der Pro-

duktion von leichten Hyperonen und erlauben so die ¨ Uberpr¨ ufung weiterer

theoretischer Modelle. Der nat¨ urliche n¨achste Schritt w¨are eine Ausweitung

dieser Studien auf differentielle Observablen.

(7)

Abstract

This thesis describes measurements of the pp → K ++ reaction near threshold. The work was largely motivated by the lack of data for Σ + hyperon production in pp collisions and, in particular, by recent measurements of pp → K ++ by the COSY11 collaboration. The experiment performed by this group using a neutron detector reported surprisingly high Σ + cross sections that are hard to reconcile with isospin considerations.

The experiment discussed in the thesis has been performed at the ANKE- COSY facility at four close-to-threshold energies. It relies on the almost background-free K + identification using the delayed-veto technique and the fact that below the threshold for pp → K + nΛπ + there is no source of the K + π + correlations other than the Σ + → nπ + decay. Thus, the detection of K + π + pairs allows one to identify the pp → K ++ reaction without the need for a neutron detector.

The analysis of three simultaneously measured spectra has been carried out, searching for any signal from a possible high Σ + cross section. All the K + production channels allowed at the energy of the experiment contribute to the K + inclusive and K + p correlation spectra. In the K + inclusive distri- butions, signals from the different production channels are summed and can only be isolated using theoretical models. In the K + p correlation spectra, there are not only signals from the direct reaction protons but also protons from hyperon decays can be observed. Thus, the signal from Σ + → pπ 0 decay contributes to the K + p missing mass. The study of the K + π + corre- lations allows one to identify the Σ + reaction channels and to estimate the total production cross section. This method has been successfully applied to existing ANKE data collected in August 2003 and resulted in a publication a refereed journal. Analysis of experimental data collected in September 2007 yielded following results:

• The pp → K ++ total cross sections measured at four energies are

two orders of magnitude smaller then those reported by COSY11.

(8)

• The Λ and Σ 0 total cross sections extracted from K + p missing mass spectra are found to be in agreement with the world data, except for lowest energy data point for Σ 0 , where there were technical problems.

• The inclusive double differential cross sections extracted from the K + data are described by a refined model that uses total cross sections as obtained from the K + p and K + π + analyses.

The new experimental results presented in the thesis complete and sig-

nificantly improve the database for light hyperon production, thus allowing

one to test further theoretical models. The natural next step would be to

extend these studies towards differential observables.

(9)

Chapter 1

The physics case

Several times in the evolution of physics people have believed that the smallest building blocks of nature have been discovered. Nowadays it is accepted that these building blocks are the quarks (q) that are confined in the mesons (q q) and baryons (qqq) and that interact between each other through ¯ the exchange of gluons (g). The gluons are field bosons in the Quantum Chromo Dynamics (QCD), the theory of strong interactions. Within the framework of QCD the quarks have spin-half (fermions) and carry colour charge (“red”, “green” and “blue”) whereas the gluons have integer spins.

Currently it is believed that there are six types of quarks with non-integral values of electric charge (2/3 for u,c and t and − 1/3 for the d,s and b) and that these form the basis of all the types of particle. The presence of the s, c, t or b quark in the particle define the flavour quantum number.

In a framework of standard model, the proton and neutron, which are the elements of nature that we see around us, consist of two combinations of u and d quarks (proton = uud, neutron = udd). Thus, the production of particles with additional types of quark (strange quark s for example) in the final state particles may shed light on the structure of the nucleons and the dynamics of the strong interactions.

Strangeness production in proton-proton collisions is the subject of the present thesis.

1.1 Introduction

Since the first observation of K mesons in a Wilson cloud chamber in

1944 [1], strange particles have attracted significant attention of the particle

physics community. The first investigations of all varieties of strange parti-

cles, called V particles due to their characteristic trace in the cloud chamber,

(10)

have been carried out using cosmic rays [3]. Due to their relatively small production cross sections, even under excellent experimental conditions the accumulation of information about any type of the strange particles took a lot of time.

Even before studies with particle accelerators had become available, the strangeness quantum number was introduced by Gell-Mann and Nishijima [2]

in 1955 for the classification of a variety of particles known at that time. The basic principles of particle classification used up to now were then already developed. More detailed investigations of strangeness production became possible only after the development of more powerful accelerators.

Strangeness is a quark flavor which is produced, either from the vacuum, or from the quark-antiquark sea in the nucleons. The studies of strangeness production therefore deepen our understanding of the internal structure of the baryons. The easiest way to produce an s¯ s pair via an N N collision is the N N → K + N Λ reaction, which has a threshold at a proton beam energy of T p = 1.58 GeV. The K + N Λ final state is also interesting due to the presence of the two baryons N and Λ, the interaction of which can be studied to test the validity of the SU (3) flavour symmetry [4]. Furthermore, there are indications that excited states of the nucleons, for example the S 11 (1650), which later decay to the hyperon and kaon [5, 6], have a significant influence on strangeness production.

Strangeness is conserved in the strong interaction and, since there are no baryons with positive strangeness, the low energy K + -nucleon total cross section is small. As a consequence, K + mesons produced in the interaction have long mean free paths in the nuclear matter. Thus, studies of subthresh- old strangeness production (T N < 1.58 GeV) in pA [7] and AA [8] interaction are of special interest. In such cases kaons, which originate from the high density phase of the reaction, are not absorbed. This means that K + mesons produced in pA or AA interactions can carry information about the produc- tion mechanism, high energy components of the nuclear wave function, and possible cooperative phenomena in the nucleus.

A significant database on strangeness production in pp, pA and AA in- teractions now exists. Inclusive K + production in pA interactions has been extensively studied at CELSIUS [9], SATURNE [10], and ANKE [11] under different kinematical conditions. The ANKE pA → K + X programme has led to the accumulation of a large amount of experimental data on kaon pro- duction on different targets and a determination of the strength of the K + N potential [11]. The analysis of K + d correlation data shows the first evidence for a cluster production mechanism at subthreshold energies [12].

The production of K + , K and K 0 mesons in AA-collisions has been stud-

ied by KaoS [13] and FOPI [14] at GSI (Darmstadt). In these experiments

(11)

kaons are used as a probe of the high density nuclear matter produced in AA collision. It was found that the K + /K ratio is enhanced in heavy-ion collisions as compared to pp collisions [13]. This, and many other experi- mental results obtained with different beams and targets, have significantly improved our knowledge of the mechanisms of strangeness production and the understanding of matter in different phases.

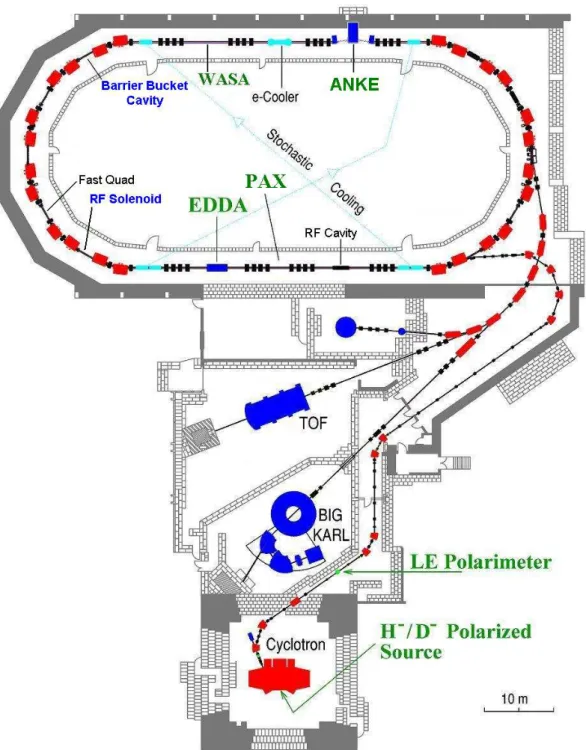
This thesis presents an investigation of associated strangeness produc- tion in proton-proton collisions close to threshold. In Chapter 1.2 existing experimental data and theoretical models for the K + production in pp in- teractions are discussed. In Chapter 2 the COoler-SYnchrotron COSY and the ANKE magnetic spectrometer are described. The experimental tech- niques and analysis procedures used to obtain the experimental results are explained in Chapter 3. The procedure for extracting total cross sections and additional observables are presented in the Chapter 4. The Conclusions and Outlook are given in Chapters 5 and 6, respectively.

1.2 Experimental data on K + production in pp collisions

The total cross section for K + production in pp collisions is relatively low, which puts significant requirements onto the quality of the proton beam. The main investigations of the different K + production reaction channels have therefore been carried out at modern accelerators, such as SATURNE [15]

and COSY [16]. In the close-to-threshold regime (T thr = 1.58 GeV) there are three main K + production channels, viz. pp → K + pΛ, pp → K +0 , and pp → K ++ . The available experimental data on these three channels are discussed in Sec. 1.2.3, 1.2.4, and 1.2.5, respectively. The data on the heavy hyperon channels and four body final states with an additional π show even smaller total cross sections than those of the three body final states with light hyperons [17]. Nevertheless, one of the measurements presented in this thesis was performed slightly above the threshold for Λπ production, and therefore some details of the four body final states are presented in Sec. 1.2.6.

1.2.1 Inclusive K + production data

A number of experiments has been performed that measured inclusive

K + momentum spectra [18,19,20,15]. The experimental distributions for in-

clusive data of course contain contributions from all the strangeness produc-

tion channels that are allowed at that particular energy. The most accurate

measurements of the K + inclusive spectra were undertaken at the magnetic

(12)

Figure 1.1: The K + missing mass spectra measured at 2.3 GeV [15] compared to simulations from Ref. [22]. The K + were measured at an emission angle of 8.3 . The figure is taken from Ref. [22].

spectrometer SPES 4 at SATURNE, Saclay [15]. High resolution K + mo- mentum spectra studies were performed at 2.3 and 2.7 GeV at several K + detection angles in order to investigate the pΛ final state interaction (FSI) and search for a strange exotic dibaryon (S = − 1). Although the exotic dibaryon was not found, the K + missing mass spectra led to estimates of the scattering length and effective range parameter of the pΛ system [21].

In Ref. [22], the authors performed an analysis of all the available K +

inclusive momentum spectra, trying to isolate the contributions of the indi-

vidual hyperons by using the K + missing mass spectra. Any K + momentum

spectrum measured at some fixed laboratory angle can be converted into a

missing mass spectrum using the corresponding Jacobian. The thresholds of

individual channels can be identified in the missing mass spectra, allowing

one to investigate threshold effects. Thus, by analysing measured missing

mass spectra on the basis of simple phase space simulations, with the inclu-

sion of a pΛ final state interaction in the K + pΛ channel, it was possible to

estimate the total cross sections of individual final states contributing to the

spectra. However, the inherent uncertainty in such an analysis is relatively

large, since the K + missing mass spectra are integrated over a very small

region of phase space. In addition, the total cross sections of the Σ + and

(13)

Σ 0 production are superimposed on the much bigger contribution from the pp → K + pΛ reaction. This makes the extraction of Σ cross sections very dependent on the models used for the pp → pK + Λ reaction. It is therefore hard to draw very firm conclusions about Σ production from such data. A comparison of the simulations with the inclusive K + spectra measured at 2.3 GeV is presented in Fig. 1.1.

1.2.2 Bubble chamber data

The bubble chamber experiments that were done at relatively high ener- gies and suffer from low statistics and poor resolution [5, 23]. In most of the measurements only the total cross sections of the well identified three and four body reaction channels have been estimated. A compilation of the total cross sections for the different reaction channels, measured at relatively high energies with bubble chambers, is presented in Ref. [23]. However, some dif- ferential observables with low statistics have also been published at relatively high energy (5.13 GeV) [5]. The deviation of the measured differential mass spectra for pp → K + pΛ and pp → K +0 from pure phase space was in- terpreted as indications for strong final state interactions and the significant influence of resonances in the production mechanism.

More detailed investigations of the three lightest hyperon production channels have been carried out using counter techniques at the COSY storage ring.

1.2.3 The pp → K + pΛ reaction

The pp → K + pΛ reaction is the most investigated of all the different K + production channels. Before COSY began operation, only one data point from a bubble chamber experiment was available in the threshold region [24].

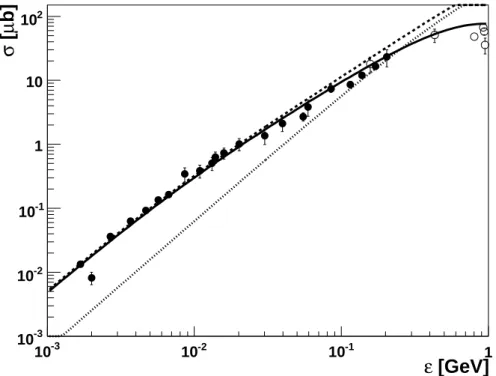
The COSY11 [25, 16, 26] and COSY-TOF [27, 6] collaborations performed series of measurements of the total cross section for Λ production at different energies. COSY11 measured close to threshold by reconstructing the Λ in the K + p missing mass distribution, whereas COSY-TOF performed exclusive measurements of the reaction channel, registering all the particles in the final state. The dependence of the total cross section on the excess energy ε is presented in Fig. 1.2.

The analysis of the available experimental data on the pp → K + pΛ reac-

tion using a simple phase space model indicates the presence of a strong pΛ

final state interaction [29]. The parameters of the pΛ final state interaction

(FSI) are, however, poorly known [21] due to the absence of high quality pΛ

scattering data. Values of the singlet (a s ) and triplet (a t ) scattering lengths

(14)

[GeV]

ε

10 -3 10 -2 10 -1 1

b] µ [ σ

10 -3

10 -2

10 -1

1 10 10 2

Figure 1.2: The total cross sections of the pp → K + pΛ reaction as a function of excess energy. Measurements performed at COSY are shown by closed circles [25, 16, 26, 27, 6, 28]; open circles represent results from other experi- mental facilities [24,23]. The parametrisation of the three body K + pΛ phase space with a constant matrix element is shown by the dotted line, the same dependence after correction for the pΛ FSI by the dashed line. The three body phase space corrected for the final state interaction and matrix element energy dependence is shown by the solid line [29].

have been determined using the 378 Λp scattering events reported in Ref. [30], leading to the following parameters:

a s = − 1.8 { +2.3 −4.2 fm and a t = − 1.6 { +1.1 −0.8 fm. (1.1) The corresponding effective range parameters vary from 0 to 16 fm. This shows that the parameters of the pΛ FSI are not accurately determined by the experimental data and can vary in different analyses.

The authors of Ref. [29] proposed to parameterise the energy dependence

of the total cross section in terms of pure three-body phase space with a con-

stant matrix element and strong final state interaction implemented using the

(15)

Jost function. In their later analysis [31] this parametrisation was improved by using an energy dependent matrix element. The results of these parame- terisations are compared with the experimental data in Fig. 1.2. Using this parametrisation the Λ total production cross section can be determined with a precision of ∼ 10% for excess energies up to 1 GeV.

Very little is known up to now about the production mechanism and most of differential observables have only been presented in terms of PhD theses;

for details see Appendix A. Dalitz plots and their corresponding projections measured at 2.75 and 2.85 GeV at COSY-TOF are presented in Refs. [27, 6].

The analysis of Dalitz plots performed in Ref. [6] and continued in Ref. [32]

leads to the conclusion that the production of the K + pΛ final state proceeds via different N resonances (N (1650), N (1710) and N(1720)). Furthermore, it was found in Ref. [32] that the contributions of the different resonances to the production mechanism changes with beam momentum. On the basis of the Dalitz plot analysis it was concluded [6] that close-to-threshold Λ production take place via π exchange and that the pΛ final state interaction has a significant influence on all the observed distributions [6]. In Ref. [32]

it is suggested that up to the excess energy of 282 MeV the contribution of the higher partial waves is very small, though the measured angular spectra show some anisotropy for all three final particles. The parameters of the partial wave analysis of angular distributions measured by COSY-TOF are collected in Appendix. A.

There is very little information on polarisation observables for the pp → K + pΛ reaction in the close-to-threshold regime. From high energy experi- ments it is known that

• the Λ produced are polarised perpendicular to the production plane and that the polarisation is negative;

• the polarisation increases linearly with the transverse momentum p T of the Λ hyperon;

• the Λ polarisation is almost independent of the proton beam momen- tum from 12 to 200 GeV/c.

The Λ polarisation at 2.75 GeV/c has been measured as a function of the momentum transfer [27]. In addition there are more measurements of the Λ polarisation performed with the COSY-TOF detector that have been reported in PhD theses [33, 34, 35, 36, 37, 38]. The effect of Λ polarisation is still not explained by theoretical models.

There is only one measurement of the D N N parameter using polarised

proton beams of 3.67 and 2.94 GeV/c performed by the DISTO collabora-

tion [39, 40]. The result of the measurements at 3.67 GeV/c as a function of

(16)

0.0 0.5 1.0 x F

-0.4 0.0 0.4

D NN

DISTO 3.67 GeV/c (exclusive) DISTO 3.67 GeV/c (semi-inclusive)

-1.0 -0.5 0.0 0.5 1.0

x F -1.0

-0.5 0.0 0.5 1.0

D NN

p

p

p

p

p

p p

p

π π

K + K +

K + K +

K +

K + Λ

Λ

Λ

Λ →

p

p

p

p

Figure 1.3: Left panel: Values of the polarisation transfer parameter D N N

as a function of Feynman x F measured for the ~pp → K + p~ Λ reaction at 3.67 GeV/c [39]. Results for the exclusive and semi-inclusive analysis dis- cussed in Ref. [39] are presented by circles and diamonds, respectively. Right panel: Theoretical calculations of D N N for the various exclusive Λ produc- tion mechanisms. The Feynman diagrams indicate the dominant exchange contribution for the positive versus negative x F . The D N N calculated with only π exchange is shown by the dashed line, K exchange solid line, combi- nation of both together with the Λp FSI dash-dotted. The figures are from Ref. [39].

the Feynman variable x F (x F = p /p maxΛ is a Λ longitudinal momenta as a fraction of maximally allowed value) is presented in Fig. 1.3. The sensitivity of D N N to the production mechanism is illustrated in Fig. [39], where the calculations of Ref. [41] are shown. Large and positive values of D N N for x F > 0 would indicate the dominance of π exchange, while negative values would be attributed to the dominance of K + exchange. The negative val- ues of D N N measured at two energies by the DISTO collaboration clearly suggest that K + exchange is the most important production mechanism for the pp → K + pΛ reaction [39]. This result is, however, in contradiction to the conclusion based on the analysis of the Dalitz plots measured by the COSY-TOF collaboration [6]. Furthermore, measurements of the D N N pa- rameter have been performed at 2.75 and 2.95 GeV/c with the COSY-TOF detector and reported in a PhD thesis [42]. The observed value of D N N is consistent with zero for the full range of x F , which would be consistent with a dominance of π exchange in the production mechanism.

The pp → K + pΛ reaction has been intensively studied. The total pro-

duction cross section is known with an accuracy of 10% for excess energies

up to 1 GeV. The strength of the pΛ final state interaction can be estimated

using unpolarised data on the total cross sections and measured K + missing

(17)

mass spectra. However, additional measurements with polarised beam are needed in order to separate the singlet and triplet components of the FSI.

The production mechanism is still not understood; two independent measure- ments of the D N N parameter contradict each other, and no firm conclusions about dominant exchange mechanism can be drawn. Most of the differential observables, shown in various COSY-TOF PhD theses, deviate from a phase space behaviour.

1.2.4 The pp → K +0 reaction

[GeV]

ε

10 -3 10 -2 10 -1 1

b] µ [ σ

10 -3

10 -2

10 -1

1 10 10 2

Figure 1.4: Energy dependence of the pp → K +0 total cross section as a function of excess energy. Measurements performed at COSY are shown by the closed squares [16, 26, 28] while the open squares were obtained at other experimental facilities [24, 23]. The parametrisation of the three body K +0 phase space with the constant matrix element is shown by the dotted line; the model corrected for the energy dependent matrix element is shown by the solid line [29].

The second K + production channel in the threshold region is the pp →

(18)

Figure 1.5: The ratio R(Λ/Σ 0 ) as a function of excess energy in compari- son with the ratio of parameterisations for the corresponding channels from Ref. [31]. The figures is taken from Ref. [31].

K +0 reaction. This also can be identified directly using K + p correlations.

The energy dependence of the total cross section of Σ 0 production was in- vestigated in COSY energy range in Refs. [26, 16, 28]. An analysis of the experimental data performed in Ref. [31] and shown in Fig. 1.4 suggests that the energy dependence follows a simple phase space approximation with a slowly varying matrix element. There is no indication for any significant fi- nal state interaction. There are, in addition, several data points measured with the COSY-TOF spectrometer and presented in PhD theses [27, 33, 35].

Although these generally agree with the common trend, they are not shown in Fig. 1.4 but are given in Table A.11.

There are no data on differential observables for the Σ 0 reaction channel available in the COSY energy range. However, data collected with a bub- ble chamber at 5.13 GeV indicate the influence of resonances, but no firm conclusion about any pΣ 0 FSI was made [5].

The ratio R(Λ/Σ 0 ) of the Λ and Σ 0 production cross section in the close- to-threshold region was investigated by the COSY11 collaboration [26, 16].

Rather surprisingly it was found that close to threshold this ratio is as large

as 28 [16] while at higher energies it is about 3 [23]. This strong variation

of the ratio was investigated within several theoretical models [43, 44, 45].

(19)

Assuming that Λ and Σ 0 hyperons are produced solely via K exchange, and ignoring final state interactions, the ratio of the total cross sections σ Λ /σ Σ 0 is proportional to the ratio of coupling constants g 2 KNΛ /g KNΣ 2 0 [44]. Although values of g KNΛ and g KNΣ 0 are not known precisely, the SU(6)-symmetry predicts this ratio to be 27. This number is in fair agreement with the experimental observation [16]. On the other hand, all the models stress the importance of pΛ FSI [44, 46] and require π exchange for the description of the experimental data [6]. In contrast, experimental data from DISTO collected with a polarised proton beam [39] support the dominance of the K exchange for the pp → K + pΛ production mechanism.

The phenomenological analysis of the Λ/Σ 0 ratio presented in Ref. [31]

is able to describe simultaneously the ratio of total cross sections and the energy dependence of the total cross sections. This analysis uses three-body phase space for Λ and Σ 0 hyperons with slow varying matrix elements and a strong Λp FSI for the description of the ratio. The quality of the description is shown in Fig. 1.5.

1.2.5 The pp → K ++ reaction

Experimental data on the only charged hyperon production channel pp → K ++ are scarce. Due to the presence of the neutron in the final state, iden- tification of the Σ + hyperon via a missing mass is only possible if the neutron is detected in coincidence with the K + . However, there is a possibility to identify the K ++ final state using K + π + coincidences because, below the threshold for pp → K + nΛπ + , there is no source of K + π + correlations other than pp → K ++ , where the Σ + → nπ + decay has a branching ratio (BR) of 48.3% [47]. This method, which relies on the excellent K + identification using the delayed veto technique, has been developed for Σ + identification at ANKE [28].

The first published measurements of the Σ + hyperon production cross sec- tion close to threshold were performed by the COSY11 collaboration using a neutron detector [48]. The authors reported extraordinarily high Σ + produc- tion cross sections at excess energies of 13 and 60 MeV, i.e. , T p = 1.826 and 1.958 GeV, respectively, that were almost as high as those for Λ production at these two beam energies [48].

The COSY11 measurements initiated a study of ANKE data to try to

find evidence for their surprisingly high Σ + production cross sections. A

simultaneous analysis of three spectra measured at 2.16 GeV was under-

taken [28]. The signal from the Σ + hyperon channel was searched in the K +

inclusive spectra, the K + p missing mass spectra, and the K + π + correlation

spectra. In the K + inclusive double differential cross section, the signal from

(20)

[GeV]

ε

10 -2 10 -1 1

b] µ [ σ

10 -3 10 -2 10 -1 1 10 10 2

[GeV]

T p

1.6 1.8 2 2.2 2.4 2.6 2.8 3

b] µ [ σ

10 -3 10 -2 10 -1 1 10 10 2

Figure 1.6: The pp → K ++ total production cross section as a function of excess energy (left panel) and proton beam energy (right panel). The data points from Ref. [48, 28] and Ref. [23] are shown by the closed and open tri- angles, respectively. In the left panel, numerical calculations of the Σ + total cross section from Ref. [49] are shown by the dash-dotted line, the three-body phase space with the constant matrix element and parametrisation for the pp → K ++ from Ref. [50] are shown by dotted and solid lines, respectively.

In the right panel, the parameterisations for the energy dependence of Λ and Σ 0 total cross sections [31] are shown by solid and dashed lines, respectively.

The red hatched area in the right panel indicates the range of σ(Σ + ) allowed by the triangle inequality resulting from isospin invariance (see text).

Σ + production should be observed on top of the Λ and Σ 0 contributions,

which can be calculated using a model and normalised to the corresponding

total cross sections. The Σ + hyperon decay has a BR of 52% to pπ 0 [47], so

that some contribution from this reaction channel should also be observed

in the measured K + p missing mass spectrum. The pp → K ++ reaction

channel can be cleanly identified using K + π + coincidences that arise due to

the Σ + → nπ + decay (BR 48.3%). The beam energy of 2.16 GeV is above

the Λπ + threshold. However, from the literature it is known that the to-

tal cross section of the pp → K + nΛπ + reaction at the much higher energy

2.88 GeV is only about 4% of the Σ + cross section [17]. Assuming phase

space distributions, it is then expected that at 2.16 GeV this contribution

should be less than 2%. The K + π + analysis shows that the Σ + and Σ 0 total

cross sections are roughly equal at ε ≈ 128 MeV [28]. Furthermore, the Σ +

total cross sections reported by COSY11 collaboration at much smaller ex-

cess energies are more than an order of magnitude larger than those found at

ANKE. Taken at face value, the two sets of measurements can only be con-

(21)

sistent if there is a very large threshold anomaly. Two more data points on Σ + production obtained with the COSY-TOF detector and reported in PhD theses [37, 38] (See Table A.11) show moderate values of σ(Σ + ) at ε = 96 and 129 MeV, which might support the existence of a threshold anomaly (see Fig. 1.6). The investigation of a possible threshold anomaly was one of the principal motivations for the measurements [51] which are the basis of the present thesis.

The ratios of the total cross sections R(Σ +0 ) = σ(pp → K ++ )/σ(pp → K +0 ) measured close to threshold are 230 ± 70 and 90 ± 40 at 1.826 and 1.958 GeV, respectively [48,52]. Model independent limits on R(Σ +0 ) can be obtained from the isospin relation that link the different Σ production channels, the amplitudes for which satisfy:

f (pp → K ++ ) + f (pp → K 0+ ) + √

2f(pp → K +0 ) = 0 (1.2) This leads to the following triangle inequality between the total cross sections:

hp σ(pp → K 0+ ) − p

2σ(pp → K +0 ) i 2

6 σ(pp → K ++ ) 6 hp

σ(pp → K 0+ ) + p

2σ(pp → K +0 ) i 2

(1.3) Now at ε ≈ 129 MeV (T p = 2.16 GeV), σ(pp → K 0+ ) [53] is nearly equal to σ(pp → K +0 ) [48] so that the inequality predicts that R(Σ +0 ) <

6 at this excess energy. The COSY11 results exceed this limit by more than an order of magnitude, though they were obtained closer to threshold where no other K 00 data have been published.

The COSY11 result on the pp → K ++ total cross section initiated a lot of theoretical activity. In principle, most of the theoretical models for the hyperon production in pp interaction predict not only Λ and Σ 0 cross section but also that for the Σ + [44, 46, 41]. However, most of these models were developed before the COSY11 data were published, and they were only tested against the high energy data that were available at that time [23]. Close to threshold most of the models predicted a phase-space-like behaviour, which is not in conflict with our experimental result at ε = 129 MeV [28] but is in striking disagreement with the COSY11 result at ε = 13 and 60 MeV [48].

The meson exchange model of Ref. [44] suggests that the ratio R(Σ +0 )

depends on the type of interference between the K + and π + exchange mech-

anisms. In the case of destructive interference, supported by the analysis

of the available Λ and Σ 0 experimental data, the ratio is R(Σ +0 ) ∼ 3,

while in the case of constructive interference it is ∼ 1/3 [44]. In the res-

onance model of Ref. [46] it is believed that ρ and η exchanges dominate

(22)

Σ production in pp interactions at low energies, though this model slightly underestimates the Σ + total cross section at ε = 356 MeV [23].

The pp → K ++ reaction is a very good channel for the investigation of the role of ∆ isobars that decay into K + Σ + [54]. Due to charge conservation, N resonances cannot contribute to this reaction channel. This is in contrast to Λ and Σ 0 production, where N resonances probably play an important role.

The authors of Ref. [49] found that ∆ ++∗ (1620)1/2 formation, excited via ρ exchange, gives the overwhelmingly dominant contribution to Σ + pro- duction close to threshold. In addition to this previously ignored resonance, a strong nΣ + FSI, with parameters taken from the pΛ FSI [31], was included in the calculations. A comparison of their numerical results with the data on the Σ + production cross sections in the COSY energy range is presented in Fig. 1.6. The slight underestimation of the two lowest data points is at- tributed to the interference term between π and ρ exchange, which was not included in the calculation. This model was published before the ANKE data [28] were available.

Another resonance model that describes both scenarios of energy depen- dence of the total cross section has been published recently [50]. The inclusion of only the ∆ ++ (1920) and π exchange allows one to describe the high energy data together with the one ANKE point, while the inclusion of an additional

++∗ (1620) resonance allows one to describe the very high close-to-threshold data from COSY11. It is found also that a strong nΣ + FSI would not help to describe the near threshold data within only the ∆(1920) model [50]. It is concluded that the ∆(1620) is indispensable for a good reproduction of the COSY11 data [50]. The comparison of the parametrisation from Ref. [50]

with the experimental data is also shown in the Fig. 1.6.

In order to resolve the inconsistency between the available experimental data [48, 28] a new experiment has been scheduled and performed at COSY- ANKE [51]. This is the topic of present thesis.

1.2.6 Other hyperon production channels

It is natural to try to separate the remaining hyperon production channels into those with three and four body final states. The hyperons produced in three body final states, such as pp → K + pΣ(1385), pp → K + pΛ(1405) [56]

and pp → K + pY (1480) [55], are of special interest due to their unknown

nature and quark structure. But, due to the relatively high masses of these

hyperons, the experimental data discussed in this thesis are collected at en-

ergies that are well below the thresholds for those hyperon channels. Thus,

we shall not go here into the details of these production channels.

(23)

The available experimental data on the pp → K + pΛπ 0 , pp → K + nΛπ + and pp → K +0 π 0 reactions from Ref. [23] are presented in Fig. 1.7. The total cross sections are an order of magnitude smaller than those for the light hyperons at these energies. Therefore, in the analysis of the experimental data discussed in this thesis, effects from four body reaction channels were not considered.

[GeV]

T p

1 2 3 4 5 6 7

b] µ [ σ

10 -3

10 -2

10 -1

1 10 10 2

Figure 1.7: The total cross section for pp → K + pΛπ 0 (squares), pp → K + nΛπ + (circles), and pp → K +0 π 0 (triangles) from Ref. [23] as a function of the proton beam momentum. The parametrisation for the pp → K +0 reaction from Ref. [31] is shown by the solid line.

1.3 Theoretical models for the different K + production channels

Meson exchange [44] and resonance [46] models are commonly used in

the description of hyperon production close to threshold. The Feynman

diagrams for the two types of model are presented in Fig. 1.8. Most of the

(24)

N

N N

N

N

N Y

K K

Κ

N

N N

K

a) b) c)

Y

Y

N *

π π,ρ,ω,η...

Figure 1.8: The Feynman diagrams used in the meson exchange (a,b) and resonance (c) models.

models try to describe different hyperon production channels using the same set of parameters and formalism. However, there are very few models that predict differential and polarised observables; most of them do not go beyond a calculation of total cross sections.

1.3.1 Meson exchange model

The meson exchange models generally use the exchange of π and K mesons for the total cross section calculations. The corresponding Feyn- man diagrams are presented in Fig. 1.8a,b. Within this model the total cross section can be calculated using the following equation [57]

σ = 1 2 9 π 3 q 2 s

Z

dt ds 1

q K

√ s 1 | M (t, s 1 ) | 2 , (1.4) where q is the momentum of the incident proton in the centre-of-mass (CM) system, s is the square of the CM total energy, t is the square of the four- momentum carried by the pion, s 1 is the square of the centre-of-mass energy in the pΛ system, q K is the kaon momentum in the KΛ CM subsystem, and M(t, s 1 ) is the matrix element of the reaction.

In case of the simple one-pion-exchange model, the absolute square of the matrix element is given by:

| M (t, s 1 ) | 2 = g N N π 2 t

(t − µ 2 ) 2 F (t) | A π 0 p→ΛK (s 1 ) | 2 , (1.5)

(25)

where µ is the pion mass, g N N π is the N N π coupling constant, A π 0 p→ΛK (s 1 ) is the π 0 p → ΛK reaction amplitude, and F (t) = (Λ 2 π − µ 2 )/(Λ 2 π − t) is a form factor that depends explicitly on the Λ π cut-off mass.

The π 0 p → ΛK amplitude is determined by the total cross section:

| A π 0 p→ΛK (s 1 ) | 2 = 2 4 πs 1

q π

q K

σ π 0 p→ΛK (s 1 ), (1.6) with q π and q K being the pion and K + momentum, respectively. By tak- ing the values of σ π 0 p→ΛK (s 1 ) from experimental data, the effects of possi- ble N resonances are automatically implemented in the calculation. The g N N π coupling constant and Λ π cut-off mass are parameters of the model, determined using an N N potential (for example Bonn-NN potential [58]) and from data on pion production in pp interactions. By isospin symmetry, σ π 0 p→ΛK = σ π + n→Σ 0 K and this is applied in order to obtain relations between the Λ and Σ 0 channels.

Although the formulae for one pion exchange are simple, most of the meson exchange models used for the description of experimental data exploit π and K exchange simultaneously [41, 44]. For kaon exchange, a formalism similar to that for pion exchange is valid but, due to the poor quality of the KN → KN data, the parameters are far more uncertain. In the close-to- threshold regime, the effect of the pΛ FSI must be taken into account. The authors of Ref. [44] treat final state interaction effects in a careful way, using the J¨ ulich and Nijmegen Y N potentials. Predictions of both models, after implementation of initial state interactions, describe the experimental data on Λ and Σ 0 total cross sections close to threshold reasonably well. It is found that Λ production is dominated by the K exchange, while in Σ 0 production K and π exchanges have comparable strength. The large R(Λ/Σ 0 ) ratio, observed experimentally near threshold, cannot be explained purely by FSI effects. It is concluded that only a destructive interference between K and π production mechanisms can lead to the observed Σ 0 production suppression close to threshold.

1.3.2 Resonance model

In resonance models the strangeness is produced via the exchange of dif- ferent mesons π, η, ω, ρ with an explicit inclusion of baryon resonance excita- tion. The generic Feynman diagram corresponding to the resonance model is presented in Fig. 1.8c. Reference [46] includes the following ingredients:

• All resonances that are experimentally observed to decay into the hy-

peron and kaon. For example, in the case of pp → K + pΛ, it includes

the N (1650), N (1710) and N (1720).

(26)

• Kaon exchange is not included in the model.

• Resonances are treated as elementary particles but their widths enter the propagators.

• No final state interaction is included in the model.

The model describes the experimental data for different hyperon channels Λ, Σ 0 and Σ + at high energies very well, while in the near-threshold region the description of the Λ total cross section gets worse due to the neglect of pΛ FSI.

A similar type of models for the prediction of the total cross section for

the pp → K ++ reaction is presented in Ref. [49,50]. But the authors there

introduce in addition the previously ignored ∆ isobars and FSI in order to

obtain a better description of the experimental data.

(27)

Chapter 2

Experimental setup

The experiment has been carried out at the COoler-SYncrotron (COSY–

J¨ ulich) [59], which provides polarised and unpolarised proton and deuteron beams with momenta up to 3.7 GeV/c to external and internal target sta- tions. COSY is equipped with electron and stochastic cooling systems that can be used in the energy ranges of 40 − 183 MeV and 830 − 2830 MeV, respectively. Usage of the cooling systems reduces the beam momentum res- olution from a typical value of 4 p/p = 10 −3 down to 4 p/p = 10 −4 with only a moderate loss of beam intensity. A sketch of the COSY layout is presented in Fig. 2.1. A typical unpolarised COSY proton beam intensity is of the order of ∼ 10 10 particles per spill with a revolution frequency of ∼ 10 6 Hz.

The intensity of the polarised proton beam is about a factor five smaller than unpolarised one.

2.1 The ANKE magnetic spectrometer

The ANKE magnetic spectrometer [60] is placed in an internal target

position of COSY. It can be equipped with either unpolarised cluster [61],

polarised gas [62] or solid strip targets [63], which allow experimentalists

to perform studies of elementary and nuclear reactions with polarised and

unpolarised proton and deuteron beams up to the maximum momentum

available at COSY. The unpolarised cluster target provides areal target den-

sities of the order of 3 − 5 × 10 14 cm −2 , which lead to typical luminosities of

6 − 8 × 10 30 s −1 cm −2 . The polarised gas target makes possible double po-

larised experiments with luminosities of up to 10 29 s −1 cm −2 [64]. The ANKE

magnetic spectrometer consists of three dipole magnets (See Fig. 2.2). The

D1 and D3 magnets are used, respectively, to direct the COSY beam onto

the target from the non-disturbed COSY orbit and to return it back. The

(28)

Figure 2.1: The COoler-Synchrotron COSY-J¨ ulich

(29)

D1

D2

D3

1 m

COSY beam

Pd

Nd

Fd Target

Figure 2.2: The magnetic spectrometer ANKE.

deflection angle of the COSY beam is determined by the beam momentum and field (B) settings in the spectrometer magnet. The D2 magnet has a maximum field of 1.57 T, a maximum deflection angle of 10.6 and a vertical gap of 200 mm. The spectrometer has an angular acceptance ± 3 − 5 in the vertical and ± 10 − 18 in the horizontal directions, depending upon the particle momentum. Depending on the conditions of the experiment, the se- lected field and beam momentum, D2 is movable in the horizontal direction perpendicular to the beam trajectory. The shift of the D2 axis with respect to the COSY axis determines the ANKE deflection angle and is set using a linear drive.

A target chamber is placed in front of the spectrometer magnet. De- pending on the experimental requirements, a solid strip target, a spectator detector or a storage-cell for the polarised internal gas target can be in- stalled in the target chamber. The polarised gas target or the cluster-jet target and their catcher systems can be supplied to the target chamber. The typical transverse size of the cluster target used in the present experiment was ≈ 10 mm (FWHM) in the region of the beam-target interaction.

The D2 magnet deflects positively charged particles to the positive and

forward detector systems, placed on the right hand side of the beam, and

negatively charged particles to the so-called negative detector system. The

energy and angle of the spectator proton from the proton-deuteron interac-

tion can be simultaneously measured using a dedicated spectator detector,

installed close to the interaction point. It is therefore possible to perform

measurements on the quasi–free neutron target [65] and to identify precisely

(30)

the coordinates of the interaction point in the case of measurements with an extended storage cell target.

2.2 Detection systems

The positive and forward detector systems, used in presented analysis, are discussed in Sec. 2.2.1 and Sec. 2.2.2, respectively. The ANKE magnetic spectrometer is also equipped with negative and spectator detector systems presented in Sec. 2.2.3.

2.2.1 Positive side detection system

The positive side detection system (Pd) consists of 23 start and 21 stop scintillator counters for time-of-flight measurements and two multi-wire pro- portional chambers [60]. All the counters in the positive detector are read out by photomultipliers from both sides.

The start signals are provided by plastic scintillator counters mounted on the D2 magnet exit window. In order to reduce multiple scattering effect, which are especially significant for the low momentum particles, start coun- ters have different thicknesses depending on the counter number. Counters 1 and 2 are only 0.5 mm thick, numbers 3 , 4 , 5 are 1 mm, and numbers 6 to 23 are 2 mm. All start counters have a height of 270 mm and a width of 50 mm and together cover the full geometrical acceptance of the positive detector.

All the ANKE stop counters have dimensions 100 × 10 mm and a height in the range of 520 − 1000 mm, depending on the counter number. The first 15 stop counters are part of the range telescopes used for measurements of the K + decay products. These allow the inclusive identification of low momentum K + in the subthreshold solid strip target measurements. The last six stop counters are part of the so-called side-wall detector. They are mounted on the platform and can be placed either in the gap between the fifteen telescope and the forward hodoscope or behind the forward hodoscope for energy loss measurements.

The first side (start) multi-wire proportional chamber (MWPC) is placed close to the ANKE start counters, the second (stop) side multi-wire propor- tional chamber is connected to the D2 magnet and moves together with D2.

Both chambers have a similar structure and size, optimised for the ANKE

acceptance. Each of the chambers consists of three planes with two planes

of wires inclined by ± 23 with respect to the vertical direction and one with

vertically aligned wires. The two side multi-wire proportional chambers al-

(31)

MWPC1 MWPC2

Gas 70% Ar+ 30% CO 2

N planes 3 3

N wires 512 768

wire spacing [mm] 2.54 2.54 size [mm] 350 × 1300 600 × 1960

Table 2.1: Parameters of the Sd MWPC.

low momentum reconstruction with a resolution of the order of ∼ 2% (σ).

The parameters of the side chambers are summarised in Tab. 2.1.

The ANKE magnetic spectrometer is equipped with 15 range telescopes for inclusive low momentum K + identification. Each of the telescopes is placed in the focal plane of the spectrometer magnet and is suited for the identification of certain kaon momentum. A range telescope consists of a stop counter, ˇ Cerenkov (only telescopes 7 − 15) counter, passive degrader made of copper, energy loss counter (∆E), and veto counter. The thicknesses of the passive degraders are chosen such that the K + deposit the maximum amount of energy in the ∆E counter and stop either at the edge of it or in the second degrader. The decay products are then registered in the veto counter.

The procedure of the K + identification using the delayed veto technique is described in detail in Sec. 3.2.2

2.2.2 Forward detection system

The ANKE forward detection system (Fd) consists of two multi-wire pro- portional chambers (MWPCs), one drift chamber (DC), and a scintillator hodoscope [66]. It is placed close to the beam pipe and is suited for high momentum heavy (proton and heavier) particle identification in the forward direction. The acceptance of the Fd detector is limited by the size of the thin (0.5 mm) forward window (240 × 212 mm) made from aluminium.

The counter hodoscope consists of two layers of plastic scintillators (8 and 9 counters) shifted with respect to each other by half the size of a counter.

Six counters in the first and second layer of the hodoscope have dimensions of 80 × 20 × 360 mm. Counters number 1 − 2 and 1 − 3 in the first and second layer of the hodoscope have thicknesses 15 mm and variable width of 40 and 60 mm in the first and 40, 50 and 60 mm in the second layer, respectively.

Depending on the experimental requirements, the scintillator hodoscope can

be equipped with ˇ Cerenkov light counters for proton-deuteron separation, or

an additional layer of plastic scintillator (typically the side-wall is used) for

(32)

energy-loss measurements.

MWDC1 MWPC2 MWPC3

Gas 80% Ar +20%C 2 H 6 85% CF 4 + 15% C 2 H 6

N planes X 3 2 2

N planes Y 4 2 2

wire spacing [mm] 10 2.06 2.06

size [mm] 330 × 320 428 × 458 548 × 538 Table 2.2: Parameters of the chambers used in the Forward Detector.

The parameters of the FD chambers used at ANKE are presented in Table 2.2. Each of the FD proportional chambers consists of four wire and two strip planes. The strip planes, used as active cathodes, are combined with either two vertical (X) or two horizontal (Y ) wire planes into the one module. Each proportional chamber contains two modules, one with vertical and one with horizontal wire planes. The dimensions of the chambers are optimised for the ANKE acceptance, which is limited by the ANKE D2 forward window. The ANKE forward drift chamber is placed close to the magnet and, together with the third proportional chamber, to a large extent determines the momentum resolution. It consists of seven wire planes with 10 mm spacing combined into two modules. The first module consists of three planes of vertically oriented wires, while the second module contains four planes with wires inclined by 30 . The complete set of the ANKE FD chambers provides ∼ 1% (σ) momentum resolution for protons in the forward detector.

2.2.3 Other detection systems not used in analysis

A so-called negative detector (Nd) is used for the identification of nega- tively charged particles [67]. It comprises a set of 20 start and 22 stop coun- ters for time-of-flight measurements, two multi-wire proportional chambers for momentum reconstruction and background suppression, and a set of 11 Cerenkov counters for pion background suppression in the high momentum ˇ region.

For experiments with a quasi-free neutron target [65] and for measure-

ments with an extended polarised gas target, ANKE can be equipped with a

set of silicon vertex telescopes. Each of these consists of two or three silicon

strip detectors read out from both sides. The vertex telescopes, together

with their electronics, are mounted in the vacuum chamber at distances of

(33)

2 − 3 cm from the interaction point. They provide angle and energy measure- ments of low momentum protons and deuterons, allowing the determination of the coordinates of the interaction point and the initial quasi-free neutron momentum.

2.3 Electronics, online triggers and data acquisition system

The structure of an individual scintillator readout channel is presented in Fig. 2.3. In order to compensate for the dependence of the time shapers on

Linear fan-out

Linear fan-out

CF discriminator CF discriminator

QDC Qu

TDC Tu

QDC Qb TDC Tb Mean

timer Tm

TDC Tm

Trigger PM

Up

PM Bottom

scintillator

Figure 2.3: Structure of an individual scintillator counter readout channel.

the signal amplitudes, every time signal from the counter is read out through a constant fraction (CF) discriminator system. For the online trigger, fast time signals, mean timers (T m ean), independent of the position of the hit in the counter T mean = (T up + T bottom )/2, are used. A typical time resolution in the mean timer for the ANKE stop counters is on the order of 50 ps (σ). In general, from every counter two amplitudes Q up and Q bottom and three time signals T up , T bottom and T mean are read out.

To select particles in the Sd on the trigger level, dedicated time-of-flight

VME based modules are employed. Using one TOF module a common time-

of-flight gate (length variable from 3 to 23 ns) between a single stop counter

and sixteen adjustable start counters can be set. Thus, kaons in the Sd

detector can be selected by time-of-flight already at the trigger level. The

start counters for the coincidence with a certain stop counter (start-stop

combinations) are chosen on the basis of the simulation to register particles

with ϑ < 12 .

(34)

For the online K + identification using the ANKE range telescopes, a delayed veto trigger is used. In this trigger, cuts on the time difference between T mean measured in the stop and the corresponding veto counter are applied.

In the forward detector, a coincidence trigger between two layers of the hodoscope has been used to reduce the combinatorial background. In this trigger a coincidence between the counter in the first layer and two counters in second layer is requested.

The multi-crate ANKE DAQ supports CAMAC, Fastbus and VME read- out systems [60]. Each individual crate is read out by an INTEL-PC running under UNIX (Net-BSD). Data from individual subsystems are transferred via Fast-Ethernet to the event-builder, a PC which creates events and writes experimental data onto a hard disk. In order to synchronise the readout of the individual sub-systems, each readout system has a synchronisation module developed for this purpose. Individual synchronisation modules are interfaced by a ring-like synchronisation bus. This DAQ was developed by Zentralinstitut f¨ ur Electronic (ZEL FZ-J¨ ulich) for experiments at COSY and is capable of writing to disk ∼ 50% of events with an input trigger rate of up to 10kHz.

The digitisation of the signals as well as their storage on disk requires some time. Therefore every detection system has a so-called dead-time during which signals from the detectors cannot be accepted. In order to estimate the dead-time correction, scaler signals are used at ANKE. The scaler system is a separate system, which monitors the rate from the beam-target interaction region using signals from stop counters 2 to 5. One can draw a straight line between this group of counters and the target so that the rate in the counters is directly proportional to the luminosity and depends weakly on the background conditions. Counting the number of scaler signals accepted by the DAQ and the total number of hits in the scalers one can estimate the corresponding DAQ dead-time. Coincidences between stop counters 2 − 3, 4 − 5 and 2 − 5 form three different scaler signals which are read out with a frequency of 10 Hz.

2.4 Experimental conditions during data taking

The experiment discussed in this thesis was performed in September

2007 [51]. The main modification in the detector setup before the data taking

was the implementation of a new detector support system which is connected

(35)

with the D2 magnet. The procedure for determining the detector position using measurements carried out in August 2007 is discussed in Sec. 3.1.

For all five beam energies, the momentum compaction factor was deter- mined and the Schottky spectra have been monitored during the whole data taking. It was therefore possible to determine the luminosity and average beam momentum with some confidence (see Sec. 3.5.2).

Fd(L1&L2) TOF Veto P1

&

P3.2

So 13 + ) P3.3 T1

T2 T3.2

T3.3

Figure 2.4: Trigger scheme used in the experiment

Momentum T p LA1 α P1 P2 P3.2 P3.3

GeV/c GeV mm degree

2.546 1.775 278.9 8.038 4 1 1024 64 2.600 1.826 274.2 7.870 2 1 1024 64 2.700 1.920 263.1 7.577 4 1 1024 64 2.740 1.958 266.1 7.466 4 1 1024 64 2.806 2.020 258.2 7.289 8 1 1024 64

Table 2.3: Summary of experimental conditions selected for measurements with different beam momenta. Trigger pre-scaling factors P1, P2, P3.2 and P3.3 were used in the experiment. The α and LA1 are the deflection angle and linear drive positions, respectively.

In this experiment four different triggers with different pre-scaling factors have been used (Fig. 2.4).

• First trigger (T1) - suited for the selection of K + p pairs using the

(36)

K + time-of-flight in the Sd and two-layer coincidence in Fd. It was pre-scaled (P1) during data taking due to the high count rate.

• Second trigger (T2) - suited for the clean K + identification using the delayed veto technique for the measurements of K + inclusive spectra and K + π + coincidences.

• Third trigger (T3.2 and T3.3) - a combined normalisation trigger used for the measurements of pp elastic scattering and π + production for the relative energy monitoring. Both of these triggers were pre-scaled (pre- scalings P3.2 and P3.3) to reduce the accepted count rate to roughly 10% of the total trigger rate.

Pre-scaling factors (see Table 2.3) were changed from energy to energy in order to reduce the data-acquisition system (DAQ) dead time to below 30%.

Due to the failure in the veto counter readout channel number seven the delayed veto trigger (T2) efficiency for this telescope was significantly reduced. The telescope efficiencies determined for this experimental data are presented in Sec. 3.4.2.

During data taking at 1.826 GeV, due to a mistake in the preparation

of the K + p coincidence trigger (T1), events with the delayed veto trigger

(T2) mask were written with the wrong trigger identification number. As a

consequence, the efficiency of the trigger T1 and T2 intersect in the data is

not known. This effect, which is only present at 1.826 GeV, could only be

clarified by further analysis of K + p coincidence data and it means that the

results for Σ 0 production at this energy must be in some doubt.

Abbildung

Figure 1.1: The K + missing mass spectra measured at 2.3 GeV [15] compared to simulations from Ref
Figure 1.2: The total cross sections of the pp → K + pΛ reaction as a function of excess energy
Figure 1.5: The ratio R(Λ/Σ 0 ) as a function of excess energy in compari- compari-son with the ratio of parameterisations for the corresponding channels from Ref
Figure 1.6: The pp → K + nΣ + total production cross section as a function of excess energy (left panel) and proton beam energy (right panel)
+7

Referenzen

ÄHNLICHE DOKUMENTE

Columns headed Au show the difference in horizontal velocity between the Atlantic layer, taken as the mean of stations C1 and C2, and Mediterranean layer, the mean of C5 and C6,

Monetary policy in the standard New Keynesian model is characterized by a Taylor Rule, whereby the nominal interest rate is set to equal a target, comprised of the sum of targets

Perusal of some of the references given by Maddala and Greene, among them Grunfeld and Griliches (1960) and Griliches and Wallace (1965), suggested that Boot and de Wit only provide

It also provides numbers on the median duration, the median investment size, and our measure for firm scale, which is the average number of simultaneous

Authigenic, cold seep-related carbonates are widely distributed in the sediments and on the seafloor of the Cascadia accretionary prism (Kulm et al., 1986).. Hydrate

Secondly, the idea is to lift the problem of finding action min- imizers in a fixed homotopy class to the universal cover ˜ M of M.. On ˜ M the task will then be to find

The e ffi ciency for triggering an event passing all of the other selection requirements is 99.0 ± 0.1%, estimated using signal Monte Carlo simulation corrected by scale

Figure 19: Comparison of NLO pQCD cross sections calculated with the CT10 PDF set, the fitted PDF set using HERA data only and the one using HERA data and the ATLAS jet data with R