(will be inserted by the editor)
The Gerda experiment for the search of 0νββ decay in 76 Ge
K.-H. Ackermann 13 , M. Agostini 14 , M. Allardt 3 , M. Altmann 13,a , E. Andreotti 5,18 , A.M. Bakalyarov 12 , M. Balata 1 , I. Barabanov 10 , M. Barnab´ e Heider 6,14,b , N. Barros 3 , L. Baudis 19 , C. Bauer 6 ,
N. Becerici-Schmidt 13 , E. Bellotti 7,8 , S. Belogurov 11,10 , S.T. Belyaev 12 , G. Benato 19 , A. Bettini 15,16 , L. Bezrukov 10 , T. Bode 14 , V. Brudanin 4 , R. Brugnera 15,16 , D. Budj´ aˇ s 14 , A. Caldwell 13 , C. Cattadori 8 ,
A. Chernogorov 11 , O. Chkvorets 6,c , F. Cossavella 13 , A. D‘Andragora 1,d , E.V. Demidova 11 , A. Denisov 10 , A. di Vacri 1,e , A. Domula 3 , V. Egorov 4 , R. Falkenstein 18 , A. Ferella 19 , K. Freund 18 , F. Froborg 19 , N. Frodyma 2 , A. Gangapshev 10,6 , A. Garfagnini 15,16 , J. Gasparro 5,f , S. Gazzana 6,1 ,
R. Gonzalez de Orduna 5,g , P. Grabmayr 18,p , V. Gurentsov 10 , K. Gusev 12,4,14 , K.K. Guthikonda 19 , W. Hampel 6 , A. Hegai 18 , M. Heisel 6 , S. Hemmer 15,16 , G. Heusser 6 , W. Hofmann 6 , M. Hult 5 , L.V. Inzhechik 10,h , L. Ioannucci 1 , J. Janicsk´ o Cs´ alty 14 , J. Jochum 18 , M. Junker 1 , R. Kankanyan 6 ,
S. Kianovsky 10 , T. Kihm 6 , J. Kiko 6 , I.V. Kirpichnikov 11 , A. Kirsch 6 , A. Klimenko 4,10,6 , M. Knapp 18,g , K.T. Kn¨ opfle 6 , O. Kochetov 4 ,
V.N. Kornoukhov 11,10 , K. Kr¨ oninger 13,i , V. Kusminov 10 , M. Laubenstein 1 , A. Lazzaro 14 , V.I. Lebedev 12 , B. Lehnert 3 , D. Lenz 13,g , H. Liao 13 ,
M. Lindner 6 , I. Lippi 16 , J. Liu 13,j , X. Liu 17 , A. Lubashevskiy 6 ,
B. Lubsandorzhiev 10 , A.A. Machado 6 , B. Majorovits 13 , W. Maneschg 6 , G. Marissens 5 , S. Mayer 13 , G. Meierhofer 18,k , I. Nemchenok 4 ,
L. Niedermeier 18,g , S. Nisi 1 , J. Oehm 6 , C. O’Shaughnessy 13 , L. Pandola 1 , P. Peiffer 6,l , K. Pelczar 2 , A. Pullia 9 , S. Riboldi 9 , F. Ritter 18,m , C. Rossi Alvarez 16 , C. Sada 15,16 , M. Salathe 6 , C. Schmitt 18 , S. Sch¨ onert 14 ,
J. Schreiner 6 , J. Schubert 13,g , O. Schulz 13 , U. Schwan 6 , B. Schwingenheuer 6 , H. Seitz 13 , E. Shevchik 4 , M. Shirchenko 12,4 , H. Simgen 6 , A. Smolnikov 6 , L. Stanco 16 , F. Stelzer 13 , H. Strecker 6 , M. Tarka 19 , U. Trunk 6,n , C.A. Ur 16 , A.A. Vasenko 11 , S. Vogt 13 , O. Volynets 13 , K. von Sturm 18 , V. Wagner 6 , M. Walter 19 , A. Wegmann 6 , M. Wojcik 2 , E. Yanovich 10 , P. Zavarise 1,o , I. Zhitnikov 4 , S.V. Zhukov 12 , D. Zinatulina 4 , K. Zuber 3 , G. Zuzel 2
1
INFN Laboratori Nazionali del Gran Sasso, LNGS, Assergi, Italy
2
Institute of Physics, Jagiellonian University, Cracow, Poland
3
Institut f¨ ur Kern- und Teilchenphysik, Technische Universit¨ at Dresden, Dresden, Germany
4
Joint Institute for Nuclear Research, Dubna, Russia
5
Institute for Reference Materials and Measurements, Geel, Belgium
6
Max Planck Institut f¨ ur Kernphysik, Heidelberg, Germany
7
Dipartimento di Fisica, Universit` a Milano Bicocca, Milano, Italy
8
INFN Milano Bicocca, Milano, Italy
9
Dipartimento di Fisica, Universit` a degli Studi di Milano e INFN Milano, Milano, Italy
10
Institute for Nuclear Research of the Russian Academy of Sciences, Moscow, Russia
11
Institute for Theoretical and Experimental Physics, Moscow, Russia
12
National Research Centre “Kurchatov Institute”, Moscow, Russia
13
Max-Planck-Institut f¨ ur Physik, M¨ unchen, Germany
14
Physik Department and Excellence Cluster Universe, Technische Universit¨ at M¨ unchen, Germany
15
Dipartimento di Fisica e Astronomia dell‘Universit` a di Padova, Padova, Italy
16
INFN Padova, Padova, Italy
17
Shanghai Jiaotong University, Shanghai, China
18
Physikalisches Institut, Eberhard Karls Universit¨ at T¨ ubingen, T¨ ubingen, Germany
19
Physik Institut der Universit¨ at Z¨ urich, Z¨ urich, Switzerland Received: date / Accepted: date
arXiv:1212.4067v1 [physics.ins-det] 17 Dec 2012
Abstract The Gerda collaboration is performing a search for neutrinoless double beta decay of 76 Ge with the eponymous detector. The experiment has been in- stalled and commissioned at the Laboratori Nazionali del Gran Sasso and has started operation in Novem- ber 2011. The design, construction and first operational results are described, along with detailed information from the R&D phase.
Keywords neutrinoless double beta decay · germa- nium detectors · enriched 76 Ge · Cherenkov muon veto
PACS 23.40.-s β decay; double β decay; electron and muon capture · 27.50.+e mass 59 ≤ A ≤ 89 · 29.30.Kv X- and γ-ray spectroscopy · 29.40.Ka Cherenkov detectors · 14.60.St Non-standard-model neutrinos, right-handed neutrinos, etc.
1 Introduction
The Gerda experiment (GERmanium Detector Ar- ray [1]) is a search for the neutrinoless double beta (0νββ) decay of 76 Ge. The observation of such a de- cay would prove that lepton number is not conserved, and that the neutrino has a Majorana component [2]. A discovery of 0νββ decay would have significant implica- tions on particle physics and other fields, including cos- mology [3]. The importance of the topic has stimulated the development of several experimental approaches to the search for 0νββ decay on a number of isotopes which undergo double beta decay. For recent reviews on the state of knowledge concerning double beta decay
a
deceased
b
Present Address: CEGEP St-Hyacinthe,Qu´ ebec, Canada
c
Present Address: Laurentian University, Sudbury, Canada
d
Present Address: Brookhaven National Laboratory, Upton (NY), USA
e
Present Address: Department of Neurosciences and Imaging, University “G. dAnnunzio” di Chieti-Pescara, Italy
f
Present Address: Nat. Physical Laboratory, Teddigton, UK
g
now in private business
h
Present Address: Moscow Institute of Physics and Technol- ogy, Russia
i
Present Address: II. Physikalisches Institut, U. G¨ ottingen, Germany, and Department Physik, U. Siegen, Germany
j
Present Address: Kavli IPMU, University of Tokyo, Japan
k
Present Address: T ¨ UV-S ¨ UD, M¨ unchen, Germany
l
Present Address: Karlsruhe Institute of Technology (KIT), Karlsruhe, Germany
m
Present Address: Robert Bosch GmbH, Reutlingen, Ger- many
n
Present Address: Photon-Science Detector Group, DESY
o
Present Address: University of L’Aquila, Dipartimento di Fisica, L’Aquila, Italy
p
Corresponding Author, email: grabmayr@uni-tuebingen.de
and on running or planned experiments, see Refs. [4,5, 6, 7, 8].
The experimental signature for 0νββ decay is a line in the summed electron energy spectrum appearing at the Q-value for the reaction, Q ββ . The experimental result is a measurement of, or a limit on, the half life, T 1/2 , for the process. Within the three neutrino model and assuming the existence of a significant Majorana component a positive observation of 0νββ decay would possibly give access to the neutrino mass hierarchy as well as information on the absolute values of the neu- trino masses. The latter is only possible with knowledge of the nuclear matrix elements, M 0ν , as discussed in Ref. [9, 10, 11,12, 13]. The statements on the mass also require an understanding of whether the 0νββ process is solely due to the Majorana nature of the neutrino, or whether additional new physics processes beyond the Standard Model contribute. A recent review of the par- ticle physics implications of a discovery of 0νββ decay was given in Ref. [14].
Nuclides that are potentially 0νββ emitters will de- cay via the Standard Model allowed 2νββ decay. Both reactions are second order weak interactions, and there- fore have extremely long half lives. Values have been di- rectly measured for 2νββ decay in about ten cases and these are in the range 10 19 –10 21 yr [5]. The half lives for 0νββ decay, assuming the process exists, are expected to be substantially longer. Consequently, 0νββ decay experiments must be sensitive to just a few events per year for a source with a mass of tens to hundreds of kilograms. Backgrounds must typically be reduced to the level of one event per year in the region of inter- est (ROI), an energy interval of the order of the energy resolution around Q ββ .
Experiments looking for 0νββ decay of 76 Ge operate germanium diodes normally made from enriched mate- rial, i.e. the number of 76 Ge nuclei, the isotopic frac- tion f 76 , is enlarged from 7.8 % to 86 % or higher. In these type of experiments, the source is equal to the detector which yields high detection efficiency. Addi- tional advantages of this technique are the superior en- ergy resolution of 0.2 % at Q ββ =2039 keV compared to other searches with different isotopes and the high radiopurity of the crystal growing procedure. Disad- vantages are the relatively low Q ββ value since back- grounds typically fall with energy and the relative dif- ficulty to scale to larger mass compared to e.g. experi- ments using liquids and gases. There is a considerable history to the use of 76 Ge for the search for 0νββ decay.
After initial experiments [15], the Heidelberg-Moscow
( HdM ) collaboration [16] and Igex [17] were the driv-
ing forces in this field setting the most stringent lim-
its. In 2004 a subgroup of the HdM collaboration [18]
claimed a 4σ significance for the observation of 0νββ de- cay with a best value of T 1/2 =1.19·10 25 yr; the quoted 3 σ range is (0.69 − 4.19) · 10 25 yr. To scrutinize this re- sult, and to push the sensitivity to much higher levels, two new 76 Ge experiments have been initiated: Majo- rana [19] and Gerda [1]. The latter has been built in the INFN Laboratori Nazionali del Gran Sasso (LNGS) at a depth of 3500 m w.e. (water equivalent). Whereas Majorana further refines the background reduction techniques in the traditional approach of operating ger- manium detectors in vacuum, Gerda submerses bare high-purity germanium detectors enriched in 76 Ge into liquid argon (LAr) following a suggestion by Ref. [20];
LAr serves simultaneously as a shield against external radioactivity and as cooling medium. Phase I of the experiment is currently taking data and will continue until a sensitivity is reached which corresponds to an exposure of 15 kg·yr with a background index (BI) of 10 −2 cts/(keV·kg·yr) [1]). This will be sufficient to make a strong statement on the existence of 0νββ decay in
76 Ge for the best value given in Ref. [18]. Phase II of Gerda is planned to acquire an exposure of 100 kg·yr at a BI of 10 −3 cts/(keV·kg·yr). For pure Majorana exchange and the case that no signal is seen, this will constrain the effective neutrino mass hm ββ i to less than about 100 meV with the precise value depending on the choice of matrix elements [21].
The Gerda experiment is described in detail in the following sections. An overview of experimental con- straints and the design is presented first. This is fol- lowed by a description of the Ge detectors. Then, the experimental setup, electronic readout, data acquisition (DAQ) and data processing are described. As Gerda Phase I has been fully commissioned and has started data production, the main characteristics of its perfor- mance are given in the final section.
2 Design and general layout
The experimental challenge is to have nearly background free conditions in the ROI around Q ββ . Typically, back- ground levels are quoted in units of counts per keV per kilogram per year, cts/(keV·kg·yr), since the number of background events roughly scales with the detector mass, energy resolution and running time. Defining ∆ as the width of the ROI where a signal is searched for, the expected background is the BI multiplied by ∆ in keV and the exposure in kg·yr. Gerda has set the goal to keep the expected background below 1 event. For
∆ = 5 keV and exposures mentioned above, this implies a BI of 0.01 and 0.001 cts/(keV·kg·yr), respectively, for the two phases of Gerda .
The main feature of the Gerda design is to oper- ate bare Ge detectors made out of material enriched in
76 Ge ( enr Ge) in LAr. This design concept evolved from a proposal to operate Ge detectors in liquid nitrogen (LN 2 ) [20]. It allows for a significant reduction in the cladding material around the diodes and the accompa- nying radiation sources as compared to traditional Ge experiments. Furthermore, the background produced by interactions of cosmic rays is lower than for the tra- ditional concepts of HdM , Igex or Majorana due to the lower Z of the shielding material. Other background sources include neutrons and gammas from the decays in the rock of the underground laboratory, radioactivity in support materials, radioactive elements in the cryo- genic liquid (intrinsic, such as 39 Ar and 42 Ar, as well as externally introduced, such as radon) as well as inter- nal backgrounds in the Ge diodes. These backgrounds were considered in the design and construction phase of Gerda and resulted in specific design choices, selection of materials used and also in how detectors were han- dled.
Natural Ge ( nat Ge) contains about 7.8% 76 Ge, and could in principle be used directly for a 0νββ decay ex- periment. Indeed, the first searches for 0νββ decay used natural Ge detectors [15]. Enriched detectors allow for a better signal-to-background ratio and also yield re- duced costs for a fixed mass of 76 Ge in the experiment.
The improvement in signal-to-background ratio origi- nates from two sources: (i) many background sources, such as backgrounds from external gamma rays, are ex- pected to scale with the total mass of the detector; and (ii) the cosmogenic production of 68 Ge and 60 Co in the Ge diodes occurs at a higher rate for nat Ge than for
enr Ge. The lower overall cost is due to the fact that the high cost of enrichment is more than offset by the cost of producing the extra crystals and diodes required for
nat Ge detectors.
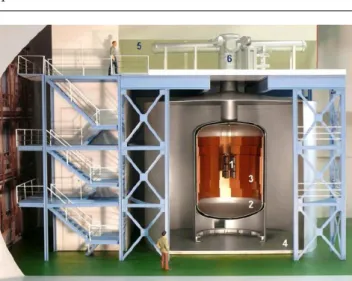
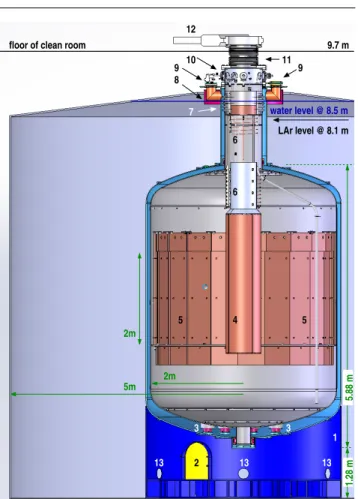
Fig. 1 shows a model of the realized design: the core
of the experiment is an array of germanium diodes sus-
pended in strings into a cryostat filled with LAr. The
LAr serves both as cooling medium and shield. The
cryostat is a steel vessel with a copper lining used pri-
marily to reduce the gamma radiation from the steel
vessel. The cryostat is placed in a large water tank,
that fulfills the functions of shielding the inner vol-
umes from radiation sources within the hall, such as
neutrons, as well as providing a sensitive medium for
a muon veto system. A similar experimental setup has
been proposed previously in Ref. [22]. The detectors
are lowered into the LAr volume using a lock system
located in a clean room on top of the water tank. A
further muon veto system is placed on top of the clean
room in order to shield the neck region of the cryostat.
Fig. 1 Artists view (Ge array not to scale) of the Gerda experiment as described in detail in the following sections:
the germanium detector array (1), the LAr cryostat (2) with its internal copper shield (3) and the surrounding water tank (4) housing the Cherenkov muon veto, the Gerda building with the superstructure supporting the clean room (5) and the lock (6, design modified). Various laboratories behind the staircase include the water plant and a radon monitor, control rooms, cryogenic infrastructure and the electronics for the muon veto.
These installations are supported by a steel superstruc- ture. All components are described in the subsequent sections.
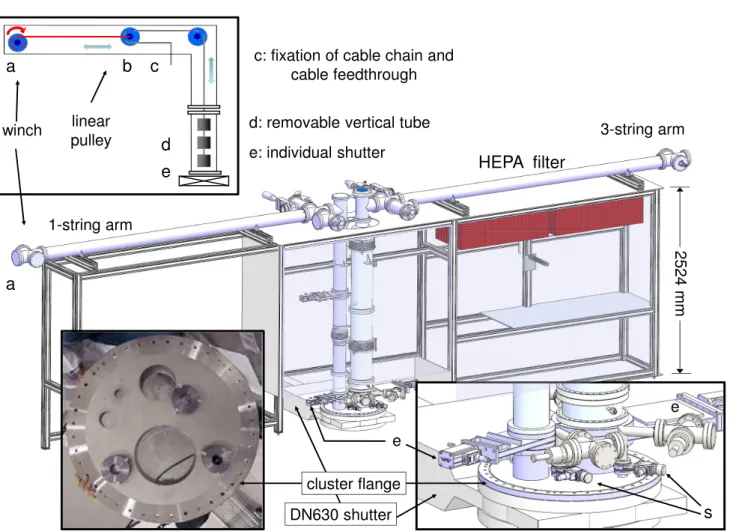
2.1 Auxiliary installations
The Gerda detector laboratory (GDL), located under- ground at LNGS, has been used for R&D for Gerda as well as for auxiliary tests. It is a grey room equipped with a clean bench, a glove box and wet chemistry for etching. Ge diodes submerged in LN 2 or LAr can be characterized in a clean environment without any ex- posure to air. The detector handling described in sec. 3 and now adopted for Gerda was developed in GDL.
The Liquid Argon Germanium ( LArGe ) appara- tus was installed inside GDL to investigate properties of LAr, such as the scintillation light output. It is used for studies of background suppression in germanium de- tectors by observing the coincident scintillation light of the liquid argon [23] and to exploit the LAr scintillation light pulse shape properties to recognize the interacting particle [24]. LArGe is a 1 m 3 low-background cop- per cryostat with a shield consisting of (from outside to inside) 20 cm polyethylene, 23 cm steel, 10 cm lead and 15 cm copper. The inner walls are covered with a reflector foil with a wavelength shifter coating. The shifted light is detected by nine 8” ETL 9357 photo- multiplier tubes (PMTs) from Electron Tubes Limited
(ETL) [25]. Calibration sources ( 228 Th, 226 Ra, 60 Co,
137 Cs) have been placed in- and outside of the cryostat and the event rejection by pulse shape discrimination and scintillation light detection were studied [26]. As a consequence of these measurements Gerda decided to implement a LAr scintillation light veto for Phase II.
LArGe has also been used to understand the back- ground coming from the decay of 42 Ar.
In addition to GDL, screening facilities at LNGS, in particular GeMPI [27] and Gator [28], have been used extensively. Additional screening facilities have been used at different locations, including Heidelberg, Geel, and Baksan.
Finally, many of the institutes in the Gerda collab- oration have laboratories which have been extensively used in R&D and testing related to the experiment.
2.2 Monte Carlo simulations
A full Monte Carlo simulation of the Gerda experi- ment and of many of the related R&D facilities has been setup in the form of a general and flexible framework based on Geant4 [29,30], which is called MaGe [31].
MaGe has been widely used for Gerda -related simula- tions and background studies. Conversely, most of the experimental test stands provided experimental data that were used to validate and benchmark MaGe . A detailed simulation of the LArGe setup is also avail- able within MaGe .
A few specific Gerda -related simulations were run using other codes than MaGe . In particular, a dedi- cated simulation code was developed to estimate the residual background in the detector array due to exter- nal γ-rays, produced either in the surrounding rocks or in the cryostat volume [32]. The simulation code SHIELD [33] was used to optimize the shielding re- quired for the transportation of GeO 2 enriched in 76 Ge from the enrichment plant to the underground stor- age site [34]. Neutron spectra and fluxes produced by αs from the 228 Th calibration sources via the (α,n) reactions were calculated through the SOURCES-4A code [35].
3 The germanium detectors
This section describes the germanium detectors that
represent the core of the Gerda experiment. For Phase I
all eight detectors from the former HdM and Igex ex-
periments [16,17] were refurbished and redeployed. For
Phase II new material amounting to 50 kg enr GeO 2 and
34 kg of dep GeO 2 was purchased. The dep Ge, material
depleted in 76 Ge below 0.6 %, was used to check the
p
+n
+groove
[ 58 , 80 ]
[ 68 , 108 ]
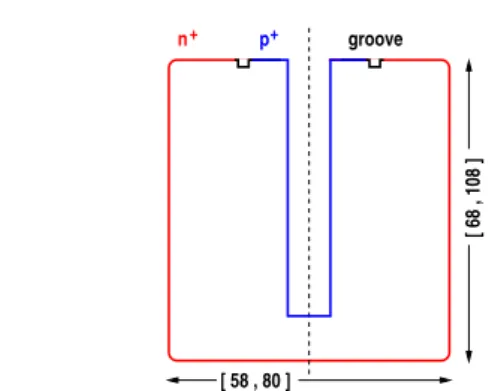
Fig. 2 Schematic drawing of a
enrGe diode currently oper- ated in Gerda . The ranges of dimensions for the eight detec- tors are given in units of mm. The masses range from 0.98 to 2.9 kg.
supply chain and methods of Phase II diode produc- tion [36]. The production and characterization of the new detectors is ongoing.
Phase I detectors are based on standard p-type HPGe detector technology from Canberra Semiconductor NV, Olen [37]. Standard closed-end coaxial detectors have a
“wrap around” n + conductive lithium layer (∼ 1 mm) that is separated from the boron implanted p + contact by a groove; the groove region is usually passivated.
The detector geometry for one of the enriched detec- tors is shown schematically in Fig. 2. In normal DC coupled readout, the p + surface (∼ 1 µm) is connected to a charge sensitive amplifier and the n + surface is bi- ased with up to +4600 V. In the alternative readout scheme with AC coupling, the n + contact is grounded and the p + contact biased with negative high voltage (HV). The analog signal is still read out from the p + contact but coupled with a HV capacitor to the ampli- fier.
Operation of bare HPGe detectors in cryogenic liq- uids is a non-standard technique. The success of Gerda depends strongly on the long-term stability of the Ge detectors operated in LAr.
3.1 Prototype detector testing in LAr and in LN 2 Before deploying the enriched detectors in LAr, bare
nat Ge detectors built with the same technology as the Phase I detectors were used for tests in GDL. A long- term study of the leakage current (LC) of bare detectors operated in LN 2 and LAr under varying γ-irradiation conditions was performed. Irradiation of a first proto- type detector in LAr with γ’s resulted in a continuous increase of the LC (see Fig. 3, left).
The ionizing radiation created the expected bulk current in the detector (∼40 pA), observed as a step at the start of the γ-irradiation at t ∼2 d. This was
then followed by a continuous increase of the LC. After about one day of irradiation, at t ∼3.5 d, the source was removed and the LC stabilized at a higher value than prior to the irradiation (∆LC ≈30 pA). No increase of the LC was observed with the same detector assembly in LN 2 after one week of irradiation.
The process is reversible as the LC was partly re- stored by irradiation with the same source but without applying HV; the LC was completely restored to its initial value by warming up the detector in methanol baths. These measurements are the first observation of γ-radiation induced leakage current increase for detec- tors of this design operated in this way. The γ-radiation induced LC was measured for different HV bias values, source-detector configurations and HV polarities [38, 39]. Measurements with three prototype detectors using different sizes of groove passivation (large area, reduced and none) were performed. It was found that reducing the size of the passivation layer strongly suppresses the γ-radiation induced LC (see Fig. 3, right). The most likely explanation is that the LC increase is induced by the collection and trapping of charges produced by the ionization of LAr on the passivated surface of the detec- tor. No γ-radiation induced LC increase was observed with the prototype without passivation layer.
For all stability measurements [39], the detectors were biased above their nominal operation voltage. The LC, continuously monitored with high accuracy, was at a few tens of pA for each detector, similar to the values measured at the detector manufacturer. Detectors with no passivation layer showed the best performance in LAr. Consequently, all Gerda Phase I detectors were reprocessed without the evaporation of a passivation layer. Our positive results on the long-term stability of Ge detectors in LAr and LN 2 contradict the statements made in Ref. [40].
3.2 Phase I detectors
The enriched Phase I detectors ANG 1-5 from the HdM and RG 1-3 from the Igex collaborations were origi- nally produced by ORTEC. In addition, six detectors made of nat Ge are available from the GENIUS-TF ex- periment [41]. They have been stored underground and therefore their intrinsic activity is low. Thus, they have been used in the commissioning phase of Gerda . De- tails of the characterization of the enriched detectors before they were dismounted from vacuum cryostats in 2006 are reported in Ref. [42].
The Phase I detectors, enr Ge and nat Ge, were mod-
ified at Canberra, Olen [37], in the period from 2006
to 2008. The detector ANG 1 had a previous repro-
cessing at the same manufacturer in 1991. The work
0 2 4 6 8 10 0
25 50 75 100 125 150 175 200
days
leakage current (pA)
0 1 2 3 4 5 6 7 8
0 25 50 75 100 125 150 175 200 200
days
leakage current (pA)
LAr
LN2 γ irradiation
Prototype 3 (without passivation layer)
Prototype 2 (reduced passivation layer) Prototype 1 (full passivation layer)
Fig. 3 Left: γ-radiation induced leakage current (LC) of the first prototype operated in LAr. Right: γ-radiation induced LC for 3 prototype detectors with different passivation layers.
was performed according to the standard manufacturer technology, however the passivation layer on the groove was omitted. Leakage current and capacitance of each detector were measured in LN 2 at the manufacturer site after the reprocessing [39].
The detector dimensions after the reprocessing, the operating bias determined in the LAr test bench of GDL and with the abundance of 76 Ge measured ear- lier are reported in Table 1. A total of ∼300 g was removed from the detectors during reprocessing result- ing in 17.7 kg enriched diodes for Phase I. The active masses of the detectors were assessed at typically ∼87 % by comparing γ-ray detection efficiencies to Monte Carlo simulations of the diodes with dead layer thicknesses varied [39]. This assessment will be refined with in-situ Gerda data.
Cosmogenically produced isotopes 68 Ge and 60 Co can lead to an internal contamination that represents a background in the region of interest. The detectors are always stored at an underground facility to avoid ex- posure to cosmic rays. This applies also for the repro- cessing steps, where the detectors were stored under- ground at the HADES facility [43], located at a depth of about 500 m w.e. at a distance of 15 km from the de- tector manufacturer. The total exposure above ground was minimized to ∼5 days [39]. At the start of Phase I in November 2011, the estimated BI contribution from the cosmogenically produced 60 Co is on average about (1 − 2) · 10 −3 cts/(keV·kg·yr). The bulk of the 60 Co activity comes from the production before the under- ground installation of the detectors for the HdM and Igex experiments. The contribution from 68 Ge is neg- ligible since it decayed away.
The mounting scheme of the detectors has compet- ing requirements. It must have a low mass to minimize
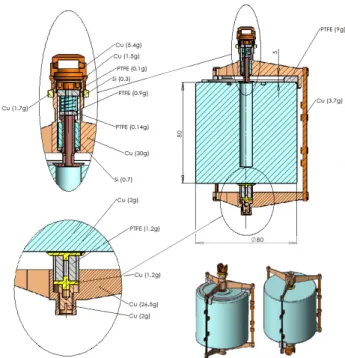
sources of radiation near to the detectors. However, the construction must be sufficiently sturdy to provide safe suspension. It must support the cables for detector bias and readout. Furthermore, the diodes must remain elec- trically isolated from all other materials. The chosen support design is depicted in Fig. 4 where the con-
Fig. 4 Drawing of a Phase I detector assembly. The signal
contact is realized by a conical copper piece (“Chinese hat”)
that is pushed by a silicon spring onto the p
+contact (in-
set left top). High voltage is applied to the n
+contact by
a copper strip (not shown) pressed by a copper disc which
in turn is electrically insulated by a PTFE cylinder (inset
bottom left). The force to achieve good electrical contact is
actuated through a copper screw. Masses and dimensions of
the assembly are given for the RG3 detector.
Table 1 Characteristics of the Phase I enriched and natural detectors. The isotopic abundances for
76Ge, f
76, of the ANG- type detectors are taken from Ref. [44]; those for RG-type detectors are from Ref. [45]; the natural abundance [46] is taken for GTF detectors. The numbers in parentheses in the last column give the 1σ-uncertainties (for details see Table 2).
detector serial nr. diam. length total operat. abundance
name ORTEC (mm) (mm) mass (g) bias (V) f
76ANG 1
?) 58.5 68 958 3200 0.859 (13)
ANG 2 P40239A 80 107 2833 3500 0.866 (25)
ANG 3 P40270A 78 93 2391 3200 0.883 (26)
ANG 4 P40368A 75 100 2372 3200 0.863 (13)
ANG 5 P40496A 78.5 105 2746 1800 0.856 (13)
RG 1
†) 28005-S 77.5 84 2110 4600 0.8551 (10)
RG 2
†) 28006-S 77.5 84 2166 4500 0.8551 (10)
RG 3
†) 28007-S 79 81 2087 3300 0.8551 (10)
GTF 32 P41032A 89 71 2321 3500 0.078 (1)
GTF 42 P41042A 85 82.5 2467 3000 0.078 (1)
GTF 44 P41044A 84 84 2465 3500 0.078 (1)
GTF 45 P41045A 87 75 2312 4000 0.078 (1)
GTF 110 P41110A 84 105 3046 3000 0.078 (1)
GTF 112 P41112A 85 100 2965 3000 0.078 (1)
?
) produced by Canberra, serial nr. b 89002.
†
) as different types of measurements vary, an uncertainty of 2 % is taken in evaluations.
tacting scheme is shown as well. In order to reach the background goals of Gerda , the amount of material is minimized. Only selected high radiopurity materials were used: copper (∼80 g), PTFE (∼10 g), and silicon (∼1 g). The results of the γ ray spectroscopy measure- ments (see sec. 6), combined with Monte Carlo simula- tions give an upper limit on the BI contribution from the detector support of ≤ 10 −3 cts/(keV·kg·yr).
One of the prototype detectors was mounted in a support of the Phase I design to test the electrical and mechanical performance. This confirmed the mounting procedure, the mechanical stability, the signal and HV contact quality, and the spectroscopic performance of this design. During this test, the energy resolution was the same as was achieved previously when the same detector was mounted in a standard vacuum cryostat, i.e. ∼2.2 keV full width at half maximum (FWHM) at the 1332 keV spectral line of 60 Co.
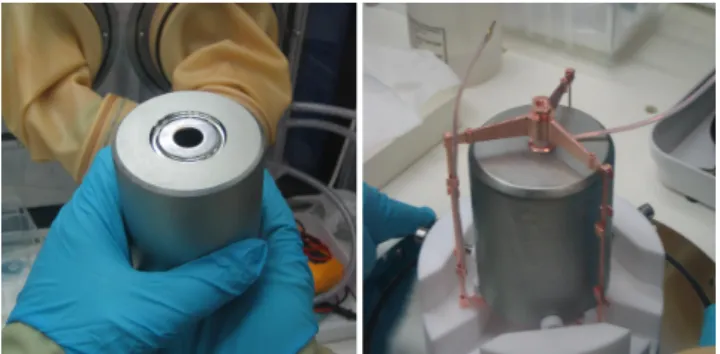
Fig. 5 shows one of the Phase I detectors before and after mounting in its custom made support structure.
The Phase I detectors were mounted in their final low- mass supports in 2008 and their performance parame- ters (leakage current, counting efficiency, energy resolu- tion) were measured in LAr as a function of bias volt- age [39]. The detector handling was performed in GDL entirely within an environment of N 2 gas. The LC of the majority of the detectors was at the same level as mea- sured at the detector manufacturer after reprocessing.
The detectors ANG 1, ANG 3 and RG 3 showed high LCs even after successive thermal cycling and required additional reprocessing to reach an acceptable perfor- mance. Spectroscopic measurements were performed, as
described in Ref. [47], with the preamplifier mounted in a gaseous Ar environment in the neck of the LAr cryo- stat. The energy resolutions of the Phase I detectors was between 2.5 and 5.1 keV (FWHM) for the 1332 keV spectral line of 60 Co. An improvement of the energy res- olution of the detectors was observed after polishing the diode surface in the location of the HV contact.
Since November 2011 all the enriched Phase I de- tectors have been inserted into the Gerda cryostat.
Fig. 5 Left: A Phase I detector after reprocessing at Can- berra, Olen. The conductive lithium layer (n
+contact) and the boron implanted bore hole (p
+contact) are separated by a groove. Right: The detector is mounted upside down in a low-mass holder (groove no longer visible).
3.3 Phase II detectors
In order to increase the active mass a new set of en-
riched germanium detectors is currently in production
Table 2 The relative number of nuclei for the different isotopes is shown for the different detector batches. The isotopic composition of the depleted material is the average of measurements by the collaboration and ECP; that for natural germanium is given for comparison.
germanium isotope
detector batch Ref. 70 72 73 74 76
natural [46] 0.204(2) 0.273(3) 0.078(1) 0.367(2) 0.078(1) HdM – ANG 1 [55] 0.0031(2) 0.0046(19) 0.0025(8) 0.131(24) 0.859(29)
Igex [45] 0.0044(1) 0.0060(1) 0.0016(1) 0.1329(1) 0.8551(10) Gerda depleted 0.225(2) 0.301(3) 0.083(1) 0.390(5) 0.006(2) Gerda Phase II
?) [48] 0.0002(1) 0.0007(3) 0.0016(2) 0.124(4) 0.874(5)
Majorana [56] 0.00006 0.00011 0.0003 0.0865 0.914
?