ATL-PHYS-PUB-2009-083 14July2009
ATLAS NOTE
July 14, 2009
Data-Driven Determination of t ¯t Background to Supersymmetry Searches in ATLAS
The ATLAS collaboration
Abstract
The Standard Model process of t ¯t production is one of the most important backgrounds to searches for Supersymmetry (SUSY) at the Large Hadron Collider (LHC) at CERN. We describe new and more detailed results on a method to estimate the contribution of t ¯t! b¯blνlq ¯q events in SUSY searches with large missing transverse energy, multijets and veto against leptons with the first 200 pb 1 of integrated luminosity of the ATLAS experiment.
The performance of this method is evaluated with Monte Carlo data simulated at 10 TeV centre-of-mass energy.
1 Introduction
High energy jets, missing transverse energy (ETmiss) and possibly leptons are the typical signature of R- parity conserved SUSY events at the LHC. The observation of an excess of events with these signatures with respect to the Standard Model (SM) prediction may manifest the presence of SUSY. Due to the poor knowledge of SM cross-sections, parton distribution functions, underlying event and parton showering at the LHC energy scale, as well as insufficient knowledge of the detector itself, a reliable prediction of the SM backgrounds should be derived mainly from the experimental data with reduced reliance on Monte Carlo simulations.
In ATLAS the searches for a SUSY signal in events with a multijet and ETmisssignature are classified according to the number of reconstructed leptons (electrons or muons): the search with one reconstructed lepton is referred to as the one-lepton mode, and the search applying a veto against leptons is referred to as the no-lepton mode.
In this note we present a method to estimate the so-called semi-leptonic top (t ¯t!b¯blνlq ¯q, l=e, µ, τ) background in the no-lepton mode. This method is similar to the estimation of di-leptonic top (t ¯t!b¯blνllνl) in the one-lepton mode [1].
Monte Carlo simulations show that the t ¯t contribution to the SM background in the no-lepton mode is about 65 % and the dominating contribution is the t ¯t!b¯blνlq ¯q process mainly coming from the events with a tau lepton (57 %) and events with a not identified electron or muon (24 %). The remainder are events with an electron or muon outside of the detector acceptance (11 %) and events with non-isolated leptons (8 %).
Several data-driven t ¯t background estimation methods have been proposed [1]. Semi-leptonic top background in the no-lepton mode can be estimated by reversing the transverse mass1) cut (so-called mT-method) and by explicit reconstruction of the tau–jet (only the t ¯t!b¯bτντq ¯q component can be estimated).
The method described in this note is based on the following steps. A data-like sample for this study is constructed from a mixture of Monte Carlo samples of t ¯t, W, Z and SUSY events, mixed according to their cross-sections. A sample enriched in semi-leptonic top events (seed sample) is extracted from the data-like sample by requiring one isolated lepton (electron or muon) and other kinematic criteria, described in section 4.
The seed sample is used to estimate the following components of the t ¯t!b¯blνlq ¯q background:
t ¯t!b¯bτντq ¯q events where the tau lepton is in the same kinematic region (transverse momentum, pseudorapidity and isolation) as the leptons of the seed events. This fraction of the t ¯t background is reproduced by replacing the electron or muon of the seed event with a tau lepton and simulating the tau lepton decay.
t ¯t!b¯beνeq ¯q and t ¯t!b¯bµνµq ¯q events where the lepton is in the same kinematic region as the leptons of the “seed sample”, but not identified. This contribution is reproduced by treating the lepton of the seed event as if it had not been identified.
The events constructed from the seed sample events by replacing the identified lepton with a tau or with a non-identified lepton is referred to as the control sample.
The two components estimated in this analysis constitute about 55 % of the total semi-leptonic top background. The remaining components include the following:
1)The transverse mass mTis defined by
m2T=2
jpTjETmiss pTpmissT
where pTis the transverse momentum of the lepton and pmissT is the missing-transverse-energy two-vector.
t ¯t!b¯bτντq ¯q events with the tau lepton outside of the kinematic region of the seed event leptons,
t ¯t!b¯beνeq ¯q and t ¯t!b¯bµνµq ¯q events with the lepton outside of the kinematic region of the seed sample leptons.
These components are not directly estimable by this method. Here, we choose to account for them by applying a scale factor, calculated from Monte Carlo simulation of t ¯t events, to the estimated event yield derived from the seed sample.
2 The no-lepton mode SUSY selection
We consider the following definition of the no-lepton mode selection. Events with a reconstructed elec- tron or muon with transverse momentum pT>20 GeV and pseudorapidityjηj<2:5 are vetoed. At least four jets with pT >50 GeV andjηj<2:5 are required, at least one of them must have pT >100 GeV.
The transverse sphericity ST2)should be larger than 0.2 to discriminate against di-jet events, the missing transverse energy ETmissis required to be larger than 80 GeV and larger than 0:2Me f f, where Me f f is the effective mass, defined as a scalar sum of transverse momenta of the four leading jets, transverse mo- menta of all identified leptons and ETmiss. In order to suppress QCD background, the minimal value of the difference in azimuthal angle between the ETmissvector and each of the three highest-pT jets∆φ(j;ETmiss) should be larger than 0.2. The kinematic space defined by the above selection is referred to the as the signal region. The definitions of the variables and objects used are given in [2].
3 Monte Carlo Data Samples
The Monte Carlo data samples used in this study are produced for pp collisions with a center-of-mass energy of 10 TeV. The t ¯t events are generated with MC@NLO [3], [4] (hard processes), parton showering and fragmentation are simulated by the HERWIG+Jimmy generator [5], [6]. The value of 172.5 GeV is used for the top quark mass. The production of W and Z bosons (plus jets) is simulated by ALPGEN [7], interfaced to HERWIG for showering and fragmentation processes. The masses of SUSY particles for mSUGRA bulk region point SU3 and mSUGRA low mass point SU4 [2] are calculated with ISAJET [8]
and the event samples are generated using HERWIG. The response of the ATLAS detector is simulated with a GEANT4-based [9] program.
4 Seed Sample selection
The seed sample selection is designed to maximize the number of t ¯t!b¯blνlq ¯q events, while minimizing contamination from other SM processes and, possibly, from SUSY production. An additional require- ment is that the efficiency of the seed sample selection should be weakly dependent on the ETmissin order to get an unbiased prediction of the background. This requirement is driven by the procedure of normal- ization, described in Section 8. The efficiency of the seed sample selection is estimated in the low ETmiss region, where the contribution of SUSY events is expected to be small, and is applied to the high ETmiss regions.
2)The transverse sphericity is defined as:
ST 2λ2
(λ1+λ2)
whereλ1andλ2are the eigenvalues of the 22 sphericity tensor Si j=∑kpkipk j. The tensor is computed using all jets with
jηj<2:5 and pT>20 GeV.
The events of the seed sample are required to satisfy the following criteria: three or more jets with pT >50 GeV and one isolated lepton with pT >20 GeV (electron or muon). To isolate t ¯t!b¯blνlq ¯q events the reconstructed mass of the hadronically decaying top quark mhadtop has been used. The method of reconstructing the mass of the top quark in t ¯t!b¯blνlq ¯q event is described in [1], and is based on the reconstruction of the longitudinal momentum of the neutrino assuming that the leptonic W has decayed into the observed lepton and has produced all the measured ETmiss. The mass of the top quark decaying leptonically is reconstructed by combining the lepton, the neutrino and whichever jet gives the closest reconstructed mass to the mass of a top quark. The hadronically decaying W is formed from the remaining jets, choosing the jet pair with invariant mass closest to the mass of the W-boson.
Finally, the hadronic top quark is reconstructed by combining the W with whichever remaining jet gives the reconstructed mass mhadtop closest to top mass. For the events with the ETmiss and lepton momentum incompatible with W-boson decay hypothesis the mhadtop is set to zero. mhadtop is required to be within 65 GeV of the top mass.
5 Estimation of t ¯t!b¯bτντq ¯q contribution
The t ¯t!b¯bτντq ¯q events are produced at half the rate of the t ¯t!b¯blνlq ¯q events, where l stands for muon or electron. Taking into account this ratio the number of the t ¯t!b¯bτντq ¯q events in the signal region can be estimated from the sample with one reconstructed electron or muon.
To take into account the additional ETmiss and jet, each seed event is used to generate t ¯t!b¯bτντq ¯q events. The reconstructed lepton is replaced with a tau lepton and 1000 tau decays are generated using the TAUOLA package [10]. Pions, kaons and photons in hadronic tau decays are considered as a single additional jet (“true tau jet”). A lepton produced in the leptonic tau decay is considered as an identified lepton if it is produced in the allowed kinematic region (transverse momentum pT >20 GeV, pseudo- rapidity jηj<2:5 and distance to the closest jet in theη–φ plane∆R>0:4). The reconstructed initial missing transverse energy is combined with the neutrinos from the tau decay. The SUSY no-lepton mode selection is applied to the resulting sample with recalculated selection variables. To correct for the lepton identification efficiencyε, each event is then re–weighted with the factor of 1=ε. The lepton efficiency is estimated from a t ¯t Monte Carlo sample and parametrized as a function of the lepton momentum and pseudorapidity.
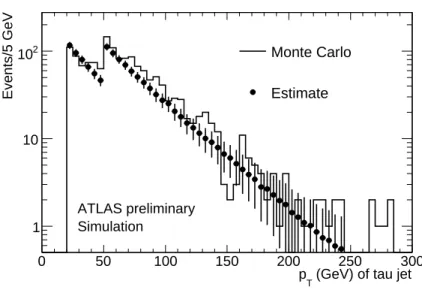
In order to check the simplifying hypotheses of this approach we compared the distribution of the transverse momentum of the “true tau jet” in the control sample to the distribution of the transverse mo- mentum of a jet matching the tau lepton in the Monte Carlo truth in the events from the signal region.
The result is shown in Fig. 1. Reasonable agreement is observed in the shape of the distribution, therefore at this time no attempt has been made to simulate the detector response to the ”true tau jet”. An uncer- tainty arising from possible defective modeling in this area is included in the systematic uncertainties (Section 9).
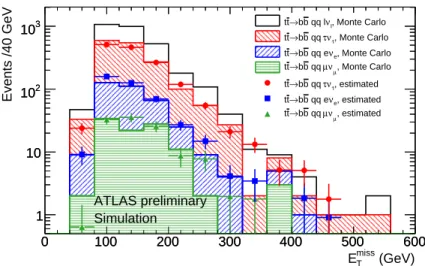
Finally, we compare the distribution of ETmissin the signal sample with the estimate derived from the data-like sample, see Fig. 2.
6 Estimation of the t ¯t background with non-identified leptons
6.1 Lost electron
The lost electron is defined as an electron with transverse momentum pT >20 GeV, withjηj<2:5 and
∆R>0:4, not identified by ATLAS electron identification algorithm [11] or rejected by the electron criteria used in no-lepton SUSY search [2]. The electron reconstructed by a standard ATLAS algorithm [11] with the “medium” purity cuts is required to have the transverse isolation energy in a cone of
(GeV) of tau jet pT
0 50 100 150 200 250 300
Events/5 GeV
1 10
102 Monte Carlo
Estimate
Simulation
ATLAS preliminary
Figure 1: The distribution of transverse momentum of a jet produced by a tau lepton decay in t ¯t!b¯bτντq ¯q events. The open histogram shows Monte Carlo events with exactly one tau lepton produced in W boson decay, passing the no-lepton SUSY selection. The circles show the estimate from the control sample (only t ¯t component), produced from the seed sample without cut on mhadtop. Both histograms are shown before cuts on∆φ(j;ETmiss), Me f f, and ST. Monte Carlo events (corresponding to an integrated luminosity of 1.6 fb 1) are generated by MC@NLO. The step at pT =50 GeV is caused by the events with the tau jet transverse momentum exceeding value 50 GeV. These events have higher probability to pass the no-lepton mode SUSY selection due to requirement of 4 jets with pT>50 GeV. The error bars show only the statistical uncertainty of the Monte Carlo sample.
(GeV)
miss
ET
0 100 200 300 400 500 600
Events /40 GeV
1 10 102
103
0 100 200 300 400 500 600
1 10 102
103 tt→bb qq lνl, Monte Carlo
, Monte Carlo ντ
τ qq b
→b t t
, Monte Carlo νe
qq e b
→b t t
, Monte Carlo νµ
µ qq b
→b t t
, estimated ντ
τ qq b
→b t t
, estimated νe
qq e b
→b t t
, estimated νµ
µ qq b
→b t t
Simulation ATLAS preliminary
Figure 2: Distribution of transverse missing energy (ETmiss) of t ¯t!b¯blνlq ¯q events produced by MC@NLO (corresponding to an integrated luminosity of 1.6 fb 1) passing the no-lepton mode selection (open histogram) and fractions of events with a tau lepton (left hatching), a lost electron (right hatching) and a lost muon (horizontal hatching), compared to the estimate of these fractions from the data-like sample. The control sample used for the estimations is derived from the seed sample (only t ¯t component) created without applying the cut on mhadtop.
∆R=0:2 smaller than 10 GeV. The lost electron in the process t ¯t!b¯beνeq ¯q is still visible in the detector as a reconstructed jet (“electronic jet”). The “electronic jet” reconstructed along with the electron in the seed events is used as a replacement for this electron. Then the ETmissis recalculated taking into account the difference between transverse momenta of the reconstructed electron and the “electronic jet”. The weight 1εε is applied to the event, reflecting the ratio of lost and identified electrons. Finally, the no- lepton mode selection cuts are applied.
6.2 Lost muon
Lost muons (defined similarly to the lost electrons) are mainly located in the region close toη=0, where a gap in muon chamber coverage has been left open for services, and in the region of transition between Barrel and End Cap parts of the Muon Spectrometer, 1<jηj<1:3, where a muon crosses fewer muon chambers.
The ATLAS ETmissalgorithm [12] combines the transverse momenta of reconstructed objects (muons, electrons, jets and photons) taking into account the energy losses in the cryostat material and non- associated clusters. For the calculation of the muon contribution (muon term) the ETmissalgorithm uses so called combined and stand-alone muons reconstructed by a standard ATLAS muon reconstruction algorithm [13]. Additional muon reconstruction algorithm is used for muons in the transition region, and calorimetric muons [14] are used in thejηj<0:1 region.
As the definition of a muon used by SUSY selection differs from the definition used in the calculation of ETmiss, care has to be taken for a fraction of events with the muon missed by the SUSY selection cuts but present in the calculation of ETmiss.
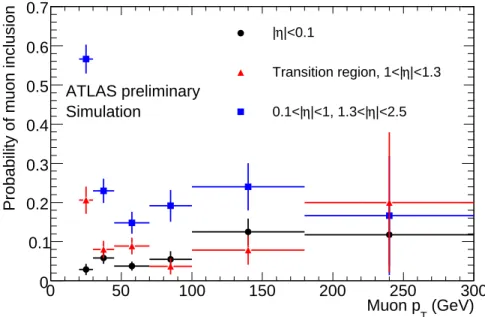
The probability that the lost muon is included into ETmiss as a function of the muon momentum is shown in Fig. 3. This probability is calculated as a fraction of events with the ETmiss muon term consistent with the generated momentum of the lost muon among the t ¯t!b¯blνlq ¯q events passed the
SUSY selection. The inclusion probability is shown separately for the muons lost in the regionjηj<0:1, in the transition region, and in the rest of the Muon Spectrometer. The overall probability of the lost muon to be recovered by the ETmissalgorithm is about 5 % and 10 % for thejηj<0:1 region and transition region respectively, and about 30 % for the other parts of the Muon Spectrometer.
(GeV) Muon pT
0 50 100 150 200 250 300
Probability of muon inclusion
0 0.1 0.2 0.3 0.4 0.5 0.6 0.7
|<0.1 η
|
|<1.3 η Transition region, 1<|
|<2.5 η
|<1, 1.3<|
η 0.1<|
Simulation
ATLAS preliminary
Figure 3: The probability of a muon which has not been found by the SUSY selection to be included in the ETmissestimation as a function of transverse momentum. The plot shows separately the probability for events with a muon lost in thejηj<0:1 region (circles), in the transition region (triangles) and in the rest of the Muon Spectrometer (squares).
To estimate the contribution of t ¯t events with a lost muon, each seed event with an identified muon is used to produce a pair of events, one with the muon included into ETmiss and one with the muon not included into ETmiss. The muon inclusion probability shown in Fig. 3 is used to estimate the relative weight of each event in the pair. In addition, the weighting correction due to the muon identification efficiency is applied and the no-lepton mode requirements are imposed to the resulting events.
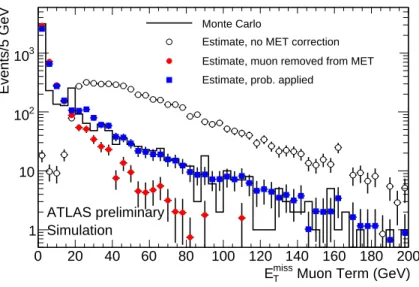
Figure 4 shows the comparison of the distribution of the muon term of ETmissin the signal region with three estimates – no correction to the original ETmiss of the seed events (implying that the lost muon is always recovered by ETmissalgorithm), with muon momentum added to ETmiss(lost muon is never recov- ered by ETmissalgorithm) and by applying the muon inclusion probability as above. The best description of the muon term of ETmiss is obtained with the muon inclusion probability. This treatment is still not perfect at low values of the muon ETmissterm, but the discrepancy in this range has a negligible effect on the estimation of the total ETmissdistribution, since the contribution of the muon term is small.
The ETmissdistribution of the t ¯t!b¯bµνµq ¯q events in the signal region compared to this estimate is shown in Fig. 2.
7 Purity of the Control Sample and Efficiency of the mhadtop cut
As described above, the events of the seed sample are used to generate a control sample which consists of the contribution of t ¯t!b¯bτντq ¯q events and events with a lost electron or muon.
Muon Term (GeV)
miss
ET
0 20 40 60 80 100 120 140 160 180 200
Events/5 GeV
1 10 102
103
Monte Carlo
Estimate, no MET correction Estimate, muon removed from MET Estimate, prob. applied
Simulation
ATLAS preliminary
Figure 4: Distribution of the muon component of ETmiss for t ¯t!b¯bµνµq ¯q events produced by MC@NLO (corresponding to an integrated luminosity of 1.6 fb 1) passing the no-lepton SUSY search requirements except the cuts on∆φ(j;ETmiss), Me f f, and ST (open histogram). Open circles show the estimate from the data-like sample with unchanged ETmiss, which corresponds to all lost muons having been recovered by ETmissalgorithm. Filled circles show the estimate from the data- like sample with the muon momentum added to ETmiss (all lost muons are not recovered by ETmiss algorithm) and squares show the estimate obtained applying the muon inclusion probability shown in Fig. 3.
In addition to t ¯t!b¯blνlq ¯q events, other SM events and possibly SUSY events are present in the seed sample, increasing the number of events in the control sample and, as a consequence, the background estimate. We consider the following sources of the control sample contamination: t ¯t!b¯bτντq ¯q events with leptonic tau decay, t ¯t!b¯blνllνl events with one not identified lepton, W production in association with jets, and SUSY events. The contributions of QCD and Z boson (plus jets) production are found to be negligible in the control sample.
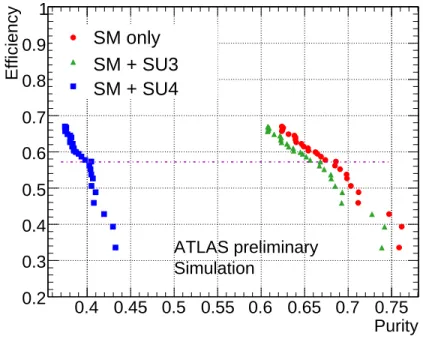
Figure 5 shows the efficiency of the mhadtop cut as a function of the purity of the control sample.
The purity is calculated assuming the SM contribution only and with the presence of SUSY signals corresponding to mSUGRA points SU3 or SU4. [2]
The efficiency is calculated as the ratio of the number of events in the control sample derived from the seed sample created with and without the mhadtop cut. A mhadtop window of 65 GeV has been chosen which corresponds to an efficiency of 57 %.
Purity 0.4 0.45 0.5 0.55 0.6 0.65 0.7 0.75
Efficiency
0.2 0.3 0.4 0.5 0.6 0.7 0.8 0.9 1
SM only SM + SU3 SM + SU4
Simulation
ATLAS preliminary
Figure 5: Efficiency of the mhadtop cut versus purity of the resulting control sample as the mhadtop window is changed in the range 30 – 320 GeV. Circles correspond to a sample with no SUSY signal, squares include also SU3 events, and triangles include SM sources and SU4 events. The horizontal line marks the point chosen in the analysis, mhadtop window of 65 GeV.
The contribution of SM processes other than t ¯t!b¯blνlq ¯q is estimated from the Monte Carlo sim- ulation and subtracted from the control sample. The uncertainty of this contribution, dominated by the uncertainty from the Monte Carlo, is considered as one of the sources of systematic uncertainty, see Section 9.
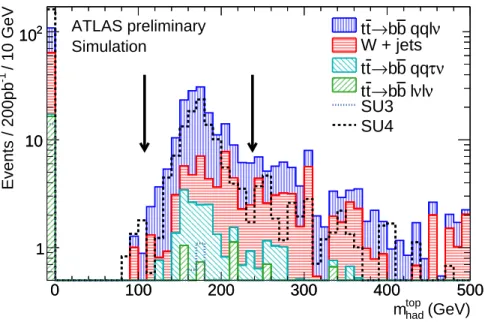
Figure 6 shows the distribution of mhadtop of the seed sample before the cut on this variable. Each seed event is re-weighted accordingly to its contribution to the control sample. The SUSY events contaminat- ing the control sample are rejected when reconstructing the longitudinal momentum of the neutrino. The ETmissand lepton momentum for those events failing mhadtop cut are incompatible with the W-boson decay hypothesis. The surviving SU4 peak around the top mass is due to the hadronic top quark reconstruction which selects the configuration closest to the top mass.
(GeV)
had
mtop
0 100 200 300 400 500
/ 10 GeV-1 Events / 200pb
1 10 102
0 100 200 300 400 500
1 10
102 tt→bb qqlν
W + jets ν τ qq b
→b t t
ν νl l b
→b t tSU3 SU4 Simulation
ATLAS preliminary
Figure 6: Distribution of the hadronic top mass for events of the seed sample before the cut on this variable. Each seed event is re-weighted according to its contribution to the control sample.
The histograms are normalized to a luminosity of 200 pb 1. The arrows show the chosen window for the hadronic top mass. The SM contributions are shown by the hatched histograms (stacked).
The SUSY contribution for the SU3 and SU4 mSUGRA points are overlaid. The entries at mhadtop=0 correspond to the events with the ETmissand lepton momentum incompatible with W-boson decay hypothesis.
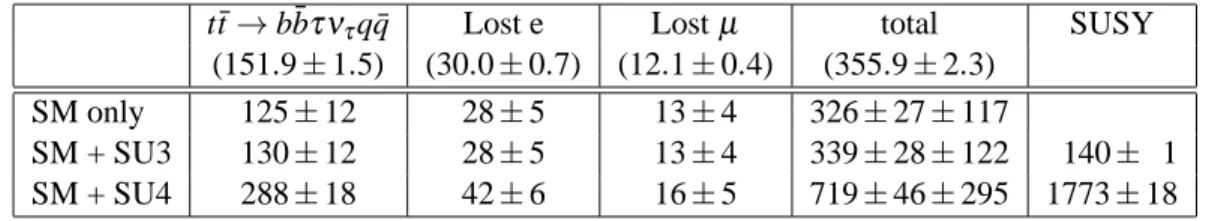
Table 1: Monte Carlo estimate of the number of t ¯t events surviving the no-lepton mode selection for an integrated luminosity of 200 pb 1(numbers in brackets) compared to the results of the data- driven method described in this note. The method is applied to the data-like sample constructed as a combination of generated SM processes only and with the addition of mSUGRA points SU3 and SU4. Individual contributions of estimated backgrounds (t ¯t!b¯blνlq ¯q, with a lost electron or muon) are also shown. The “total” is estimated as a sum of the individual contributions mul- tiplied by RMC=1:8. The last column shows the number of SUSY events passing the no-lepton SUSY selection. Uncertainties are only statistical, except for the “total” column, where the first uncertainty is statistical and the second is systematic.
t ¯t!b¯bτντq ¯q Lost e Lostµ total SUSY (151:91:5) (30:00:7) (12:10:4) (355:92:3)
SM only 12512 285 134 32627117
SM + SU3 13012 285 134 33928122 140 1
SM + SU4 28818 426 165 71946295 177318
8 Results
In order to estimate the number of t ¯t events in the signal region from the control sample one has to take into account the efficiency εseed of the mhadtop cut used for the selection of the seed sample. The normalization factor 1=εseed is applied to the control sample distribution to compensate the contribution of the t ¯t!b¯blνlq ¯q events rejected by the mhadtop cut. This normalization factor is estimated from the low-ETmissregion (80 GeV<ETmiss<120 GeV), where the contribution of the SUSY process is expected to be small.
In contrast to the other data-driven methods described in [1] and [15], we do not compare the control sample to the data-like sample in the signal region for low ETmiss. The normalization factor is estimated by comparing two control samples: one is produced from the seed sample created without applying the mhadtop cut, and the second is produced from the seed sample created with mhadtop cut.
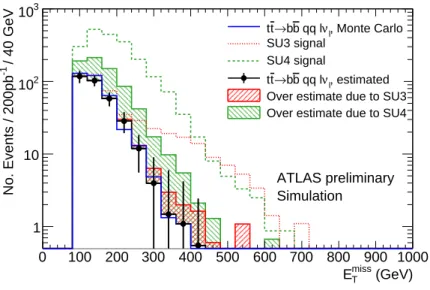
Figure 7 compares the normalized distribution of ETmiss in the control sample to the Monte Carlo prediction for the t ¯t!b¯blνlq ¯q process in the signal region. Due to the possible presence of a SUSY signal in the seed sample, the method could give a larger estimate of background than the true value. First, the SUSY events can enter the seed sample, and, second, the presence of SUSY events can increase the normalization factor. However, the over-estimate of the background is much less than the SUSY signal itself.
The estimated numbers of t ¯t events in the signal region in the presence of different SUSY signals compared to the true number are shown in Table 1. The total number of t ¯t!b¯blνlq ¯q events is estimated as a sum of the individual contributions multiplied by factor RMC, which takes into account categories of t ¯t!b¯blνlq ¯q background not estimated by this method.
9 Systematic Uncertainties
The following sources of systematic uncertainties have been considered:
Jet energy scale and resolution. The effect is estimated by varying the global jet energy scale by 5 % and the jet energy resolution by 10 %. These uncertainties were propagated to ETmiss. For the part of the ETmissnot associated with the reconstructed jets and leptons we apply an uncertainty of 20 %.
(GeV)
T
Emiss
0 100 200 300 400 500 600 700 800 900 1000 / 40 GeV-1 No. Events / 200pb
1 10 102
103
Simulation
ATLAS preliminary , Monte Carlo νl
qq l b
→b t t
SU3 signal SU4 signal
, estimated νl
qq l b
→b t t
Over estimate due to SU3 Over estimate due to SU4
Figure 7: Distribution of transverse missing energy in t ¯t events passing the no-lepton SUSY search cuts. The open histogram (solid line) shows the Monte Carlo estimate, circles show the result of the data-driven estimation. The shaded histograms show the increase of data-driven estimates in the presence of a SUSY signal (SU3 and SU4) and the dashed lines show the SUSY signal stacked on top of the t ¯t background.
Subtraction of the SM contamination of the control sample. The contributions of W , t ¯t!b¯bτντq ¯q and di-leptonic t ¯t events are the dominant contaminations of the control sample. The Monte Carlo uncertainty for W boson production in association with jets, simulated by ALPGEN, used in this study is 40 %, derived by considering variations of the matrix element-parton shower matching parameters. The same number is used for the uncertainty of the cross-section of t ¯t!b¯bτντq ¯q and di-leptonic t ¯t contributions generated by MC@NLO.
Monte Carlo uncertainty of the normalization factor RMC, the factor which takes into account categories of t ¯t!b¯blνlq ¯q background not estimated by this method. This uncertainty is estimated by comparing MC@NLO to ALPGEN generators.
Statistical and systematic uncertainty of the normalization factor. The statistical error on the nor- malization factor takes into account the limited expected statistics of the control sample in the normalization region. The systematic uncertainty of the normalization factor takes into account the presence of W (plus jets), t ¯t!b¯bτντq ¯q and di-leptonic t ¯t events in the normalization region for both the control and signal samples. An additional contribution arises from the dependence of the seed sample selection efficiency on ETmiss.
The procedure of simulating the tau lepton decay and lost muon and electron uses some simplifi- cations. For example, the detector response to the tau decay products is not simulated. This leads to deficiencies in the estimate of the corresponding contribution, see Fig. 2. This uncertainty is calculated by comparing the control sample estimate of the shape of the distributions of t ¯t events to the shape estimated from the Monte Carlo, separately for t ¯t!b¯bτντq ¯q events and events with a lost electron or a lost muon.
The uncertainty on the lepton identification efficiency directly influences the results because this efficiency is used to weight the seed events. The electron and muon identification efficiency is
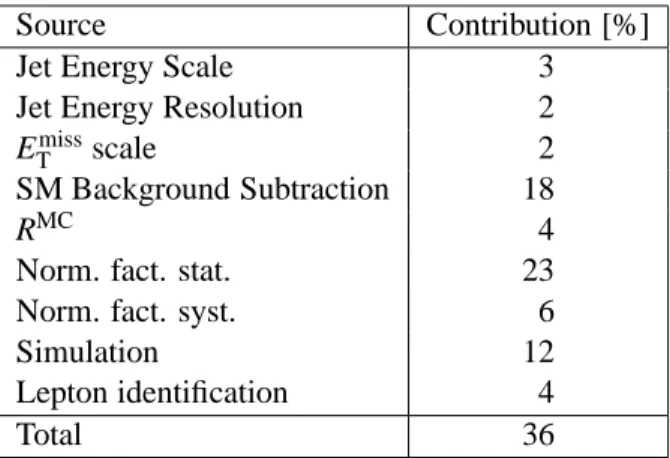
Table 2: Breakdown of systematic uncertainties estimated for an integrated luminosity of 200 pb 1.
Source Contribution [%]
Jet Energy Scale 3
Jet Energy Resolution 2
ETmissscale 2
SM Background Subtraction 18
RMC 4
Norm. fact. stat. 23
Norm. fact. syst. 6
Simulation 12
Lepton identification 4
Total 36
varied by 1 % (absolute) and the difference in the number of events estimated from the data-like sample is added to the systematic uncertainty. The statistical and systematic uncertainty of the probability of muon inclusion into ETmiss(see Fig. 3) is also taken into account.
The various contributions to the systematic uncertainty are summarized in Tab. 2.
10 Conclusion
A new method to estimate the semi-leptonic top background in the no-lepton SUSY search mode is presented. The method relies on the selection of a sample of t ¯t!b¯blνlq ¯q events, which is used to estimate the contribution of t ¯t events with a tau lepton and with a lost electron or muon.
The systematic uncertainty of the method for a luminosity of 200 pb 1 is estimated to be 36 %, the statistical uncertainty 8 %. The main contribution to the systematic uncertainty comes from the low statistics of the control sample in the normalization region.
The method over-estimates the t ¯t!b¯blνlq ¯q background by about a factor 2 in the presence of low-mass mSUGRA SUSY (SU4), implying that if a signal is found, the measured SUSY rate would be underestimated.
References
[1] The ATLAS Collaboration, G. Aad et al., Data-Driven Determinations of W, Z and Top
Backgrounds to Supersymmetry, in Expected Performance of the ATLAS Experiment - Detector, Trigger and Physics, pp. 1525–1561. 2009.
[2] The ATLAS Collaboration, G. Aad et al., Supersymmetry Searches, in Expected Performance of the ATLAS Experiment - Detector, Trigger and Physics, pp. 1514–1524. 2009.
[3] S. Frixione and B. Webber, Matching NLO QCD computations and parton shower simulations, JHEP 06 (2002) 029.
[4] S. Frixione, P. Nason, and B. Webber, Matching NLO QCD and parton showers in heavy flavor production, JHEP 08 (2003) 007.
[5] G. Corcella et al., HERWIG 6.5: an event generator for Hadron Emission Reactions With Interfering Gluons (including supersymmetric processes), JHEP 01 (2001) 010.
[6] J. Butterworth, J. R. Forshaw, and M. H. Seymour, Multiparton interactions in photoproduction at HERA, Z. Phys. C 72 (1996) 637–646.
[7] M. Mangano et al., ALPGEN, a generator for hard multiparton processes in hadronic collisions, JHEP 07 (2003) 001.
[8] F. E. Paige, S. D. Protopopescu, H. Baer, and X. Tata, ISAJET 7.69: A Monte Carlo event generator for p p, anti-p p, and e+ e- reactions,arXiv:hep-ph/0312045.
[9] GEANT4 Collaboration, S. Agostinelli et al., GEANT4: A simulation toolkit, Nucl. Instrum. Meth.
A506 (2003) 250–303.
[10] S. Jadach, Z. Was, R. Decker, and J. Kuhn, The tau decay library TAUOLA: Version 2.4, Comput.
Phys. Commun. 76 (1993) 361–380.
[11] The ATLAS Collaboration, G. Aad et al., Reconstruction and Identification of Electrons, in Expected Performance of the ATLAS Experiment - Detector, Trigger and Physics, pp. 72–93. 2009.
[12] The ATLAS Collaboration, G. Aad et al., Measurement of Missing Tranverse Energy, in Expected Performance of the ATLAS Experiment - Detector, Trigger and Physics, pp. 368–396. 2009.
[13] The ATLAS Collaboration, G. Aad et al., Muon Reconstruction and Identification: Studies with Simulated Monte Carlo Samples, in Expected Performance of the ATLAS Experiment - Detector, Trigger and Physics, pp. 162–184. 2009.
[14] The ATLAS Collaboration, G. Aad et al., Muons in the Calorimeters: Energy Loss Corrections and Muon Tagging, in Expected Performance of the ATLAS Experiment - Detector, Trigger and Physics, pp. 185–207. 2009.
[15] The ATLAS Collaboration, G. Aad et al., Estimation of QCD Backgrounds to Searches for Supersymmetry, in Expected Performance of the ATLAS Experiment - Detector, Trigger and Physics, pp. 1562–1588. 2009.