This article has been accepted for publication and undergone full peer review but has not been through the copyediting, typesetting, pagination and proofreading process which may lead to differences between this version and the Version of Record. Please cite this article as doi: 10.1029/2018GL081041
Wind synoptic activity increases oxygen levels in the tropical Pacific Ocean Olaf Duteil, GEOMAR, Kiel, Germany (oduteil@geomar.de)
Abstract
The mechanisms controlling the variability of oxygen levels in the ocean are poorly quantified. We focus here on the impact of wind synoptic variability associated with tropical convective regions and extra-tropical storms. Removing the wind higher frequencies of variability (2 days – 1 month) in an atmosphere reanalysis used to force an ocean model decreases wind stress by up to 20% in the tropics and 50% in the mid-latitudes, weakening wind-driven ocean circulation by 20%. Oxygen levels decrease by up to 10 mmol.m-3 in tropical oceans and 30 mmol.m-3 in subtropical gyres mainly due to changes in advective processes. While a large part of the tropical oxygen anomaly has local origins, changes in oxygen levels in the subtropical gyres modulate tropical oxygen distribution. Our study suggests that the “storminess” of the ocean is an important parameter that could determine the future evolution of poorly oxygenated regions.
1. Introduction
Oxygen is one of the most important chemical elements in the ocean, as it is mandatory for the respiration of marine organisms. Its distribution in the interior ocean depends on its supply by circulation and consumption by biological processes (e.g Duteil et al., 2014a,b, 2018; Deutsch et al., 2014; Ito and Deutsch, 2013; Montes et al., 2014). While the high latitudes and oligotrophic subtropical gyres are well-oxygenated, tropical regions are characterized by so-called “Oxygen Minimum Zones” (OMZ) (Karstensen et al., 2008) located at the eastern boundaries of the basins where productivity is high and currents are weak. The OMZs are currently expanding (Stramma et al., 2008), which has serious consequences for local ecosystems (Breitburg et al., 2018). The mechanisms controlling OMZ variability, however, are still poorly quantified (Oschlies et al., 2017). We focus here specifically on the role of wind synoptic variability in modulating oxygen levels in the subtropical and tropical Pacific Ocean.
Upper ocean circulation is mostly driven by wind intensity, the mechanical energy of which is communicated to the ocean. Wind strength presents a large variability at synoptic time scales, characterized by frequencies ranging from two to about ten days (Gulev et al., 2002). In subtropical and higher latitudes, synoptic variability is associated with storm tracks (Ayrault et al., 1995; Gulev et al., 2002) and extra-tropical cyclones (Ulbrich et al., 2009; Tillina and Gulev, 2013). In tropical regions, a source of synoptic variability is the Inter Tropical Convergence Zone (ITCZ), which is highly dynamic, especially during the active season extending from May to October. The ITCZ continuously breaks down and reforms, producing a series of tropical disturbances with a frequency of several days up to three weeks (Wang and Magnusdottir, 2006; Cao et al., 2013). Another source of synoptic variability is westerly wind bursts (WWBs) (McPhaden et al., 1999; Lengaigne et al., 2002; Hu et al., 2016) occurring in the western part of the basin close to the equator. The average duration of a WWB event is about 10 days, displaying wind anomalies greater than 5 ms-1 (Verbickas, 1998).
Most quantifications of synoptic processes (e.g., Toth et al., 1997; Gulev et al., 2002; Stryhal and Huth, 2017) are based on an analysis of atmospheric products, such as the NCEP (National Centers for Environmental Prediction) (Kalnay et al., 1996) or ERA40 (European Centre for Medium-Range Weather Forecasts 40 Year Re-analysis data set) (Uppala et al., 2005) re-analyses, as they provide a multi-decadal, high-frequency (generally three or six hours), continuous time series of atmospheric properties. These re-analyses are routinely used to force ocean models. Wu et al. (2016) assessed the impact of the intra-monthly variability of wind velocity on circulation in model experiments forced by JRA 55 (Japanese 55 years Re-Analysis) (Kobayashi et al., 2015). Due to strong non-linearities between wind velocity and wind stress, which is ultimately responsible for the mechanical input of energy into the ocean, wind-driven subtropical gyre circulation decreases by 10%–15% when intra-monthly variability is removed. Deep convection in the northern North Atlantic becomes significantly less vigorous, which in turn leads to an approximate 50% decrease in Atlantic meridional overturning circulation.
We performed coupled biogeochemical-circulation experiments forced by an atmosphere reanalysis, removing the high frequencies of the variability of the wind components as described in Part 2. The wind patterns are detailed in Part 3. The role of the wind synoptic
scales in ocean circulation and oxygen levels is shown in Part 4, and the mechanisms at play are discussed in Part 5. We discuss our results and their implications in Part 6.
2. Methodology
We use the global ocean model NEMO 3.6 (Madec et al., 2008) (configuration ORCA2). It presents a spatial resolution of 2° outside the tropics. The meridional resolution is refined to 0.5° between 10°N and 10°S. The circulation model has been coupled with a simple biogeochemical model (Kriest et al., 2010) containing six compartments (phytoplankton, zooplankton, nutrient, sinking detritus, dissolved detritus, oxygen). The model has been spun up for 1000 years using climatological forcings based on the CORE2 (Coordinated-Ice Reference Ocean Experiment) dataset (Large and Yeager, 2009). A similar configuration was used in Duteil et al. (2018).
After spin-up, we perform several interannual experiments using the CORE2 1948–2009 forcing dataset in which the higher frequencies of variability of the zonal and meridional wind velocity have been removed. Removing the higher frequencies of the zonal and meridional velocity impacts the wind speed, which modulates i) the latent and sensible fluxes; ii) wind stress, which ultimately controls the strength of ocean currents; and iii) the diffusive length scale (Turbulent Kinetic Energy scheme - TKE) (Gaspar et al., 1990).
i) Surface fluxes:
(1)Qs=ρ.Cp.Cs.|U10|.(Tsurface−T10) (2)Ql=ρ. L . Cl .|U10|.(Tsurface−T10)
Qs and Ql are the sensible and latent heat fluxes. ρ is the sea surface density. Cp and L are the specific heat capacity of air and the latent heat of evaporation. Cs and Cl are the sensible/latent heat transfer coefficients. U10 is the norm of the wind speed T_surface and q_surface are the surface temperature and humidity. T10 and q10 are the 10m air temperature and humidity.
ii) Wind stress and mechanical energy:
(3) τx= δ
δx(Cd.|U10|.u10)
(4) τy=
δxδ (Cd.(U10).v10)
τx and τyare the zonal and meridional wind stress components. U10 is the norm of the wind speed. u10 and v10 are the zonal and meridional wind speed components. Cd is the drag coefficient.
iii) Diffusive length scale:
(5)TKEsurface=E.|τ|.ρ
TKE_surface is the turbulent kinetic energy at surface. E is a coefficient. τ is the norm of the wind stress. ρ is the sea surface density.
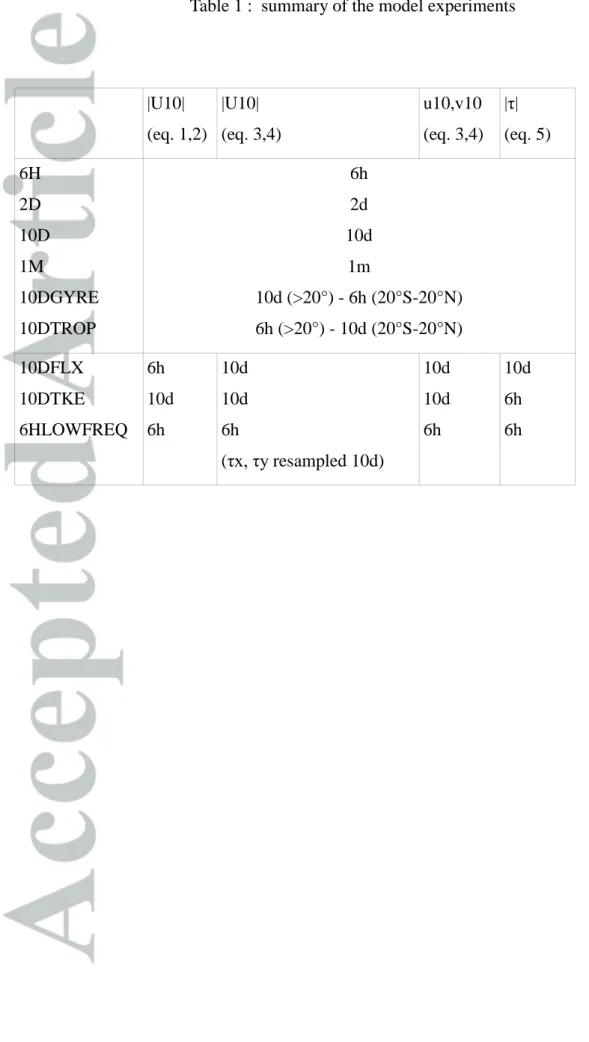
The original CORE2 dataset is characterized by a 6 hours time resolution. A low-pass filter has been set to two days, 10 days, and one month. The mean velocity of the wind zonal and meridional components is identical in all experiments, which are summarized in Table 1. All experiments have been integrated from 1948 to 2009.
3. Wind patterns
The westerlies blow from the subtropical high toward the subpolar low-pressure system. The trade winds blow from the subtropical high toward the equatorial low. They drive the north and south equatorial currents (Qiu and Lukas, 1996; Qiu and Chen, 2012), which constitute the equatorward part of the subtropical gyre. The trade winds converge near the equator to form a discontinuous band of convection, the inter-tropical convergence zone (ITCZ).
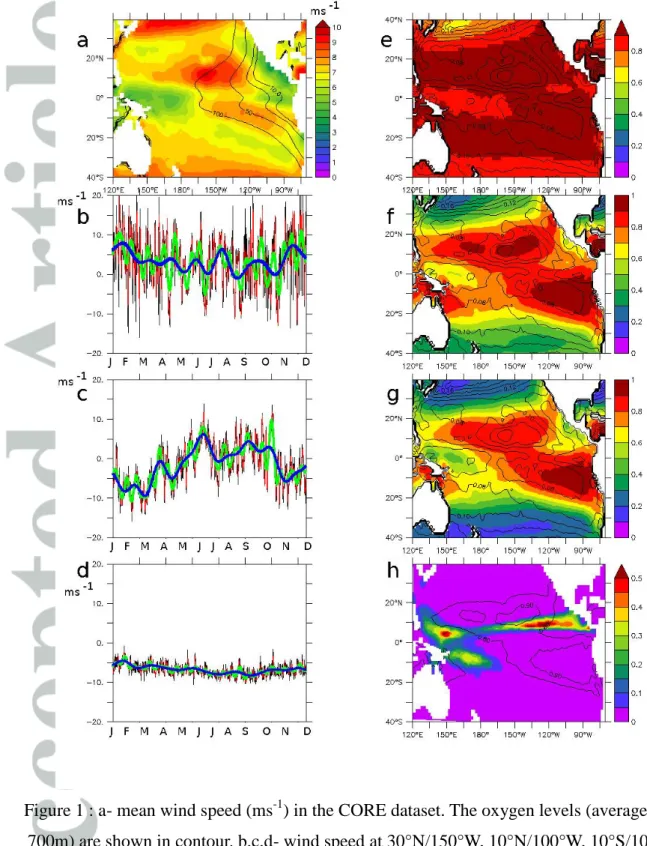
In the CORE2 forcings, the mean (1948–2009) wind speed of the westerlies and the trade winds is larger in the northern hemisphere (10 ms-1) compared to the southern hemisphere (8 ms-1) (Fig. 1a). The ITCZ is characterized by weak wind speeds (less than 5 ms-1) and strong convection patterns. The temporal variability shows a strong contrasting pattern between the subtropical gyres (Fig. 1b), the tropical northeastern part (Fig. 1c) of the Pacific Ocean—strongly impacted by the ITCZ and its seasonal meridional displacement—and the tropical southern part (Fig. 1d), where synoptic variability is much lower.
Non-linearities play a large role in determining wind stress (equations 4, 5). These non- linearities are strongly region-dependent and directly related to the amount of synoptic variability (Fig. 1e–g); regions where synoptic variability is high (e.g., due to cyclones and
storms in the subtropical gyres, the ITCZ dynamic in the tropical eastern Pacific Ocean, and the WWB in the tropical western Pacific Ocean) experience a large decrease in mean wind stress by up to 50% in the tropics and 80% in the subtropics (experiment 1M compared to 6H). In the tropical Pacific Ocean, a spatial association exists between strong convection patterns and the amount of synoptic variability (Fig. 1h). Conversely, in regions where synoptic variability is low, the mean wind stress shows a weaker decrease (particularly in the southeast Pacific Ocean).
4. Circulation strength and oxygen levels a. Mean state experiment 6H
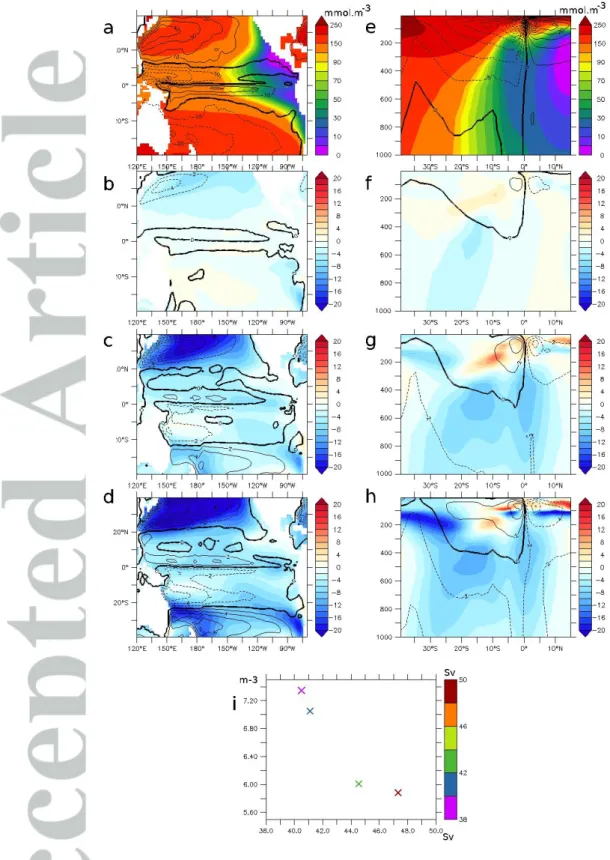
The mean oxygen concentration (mean 200–700m) in the 6H experiment is characterized by a realistic large-scale distribution: oxygen levels are low in the eastern tropical Pacific Ocean (Fig. 2a), while oxygen levels are high in the oligotrophic subtropical gyres (STG). The mechanical energy input from the wind is larger in the northern hemisphere: the barotropic streamfunction (BSF) reaches 40 Sv in the northern STG and 20 Sv in the southern STG.
Similarly, the maximal strength of the tropical gyre is lower in the southern hemisphere.
However, its zonal extension is larger: the BSF 10 Sv isoline reaches 100°W at 10°S while it reaches 150°W at 10°N, possibly explaining the strong asymmetry between the northern and southern suboxic regions, clearly visible in a section at 110°W (Fig. 2e). The very weak currents in the eastern north tropical region may be related to the weak winds associated with the ITCZ (Fig. 1a). Relatively high oxygen levels are present at the equator due to oxygen supply from the equatorial current system (Cabre et al., 2015; Shigemitsu et al., 2017; Duteil et al., 2018). The upper part of the meridional overturning (characterizing the subtropical–
tropical cells - STCs) reaches 35 Sv. The STCs ventilate the tropical region and transport oxygen from the subtropics to the tropics (Duteil et al., 2014).
b. Experiments 2D, 10D, 1M
In the 2D (Fig. 2b, f), 10D (Fig. 2c, g), and 1M (Fig. 2d, h) experiments, the oxygen concentration decreases at depth (200–700m) in the entire Pacific Ocean as a result of the decrease in strength of the subtropical gyre and the STC. The volume of the suboxic region is larger by 20% in 6H compared to 1M. Conversely, in the upper layer (upper 200m of the tropical ocean), the oxygen levels increase by up to 20 mmol.m-3. The maximal overturning strength is 20% weaker and the BSF is 30% weaker in 1M compared to 6H. Wu et al. (2016) showed that the circulation of the ocean is less vigorous by about 15% when intra-monthly
variability is removed. We obtain here a similar result; the intensity of change differs depending on the atmospheric forcings used and the characteristics of the ocean model. Most of the changes occur when the frequencies between 2D and 10D are removed, which corresponds roughly to the synoptic time scale (Gulev et al., 2002), as experiments 6H and 2D on one hand and 10D and 1M on the other are quantitatively close (Fig. 2i). The mechanisms at play are detailed in Section 5.
5. Mechanisms
a. Mean state experiment 6H
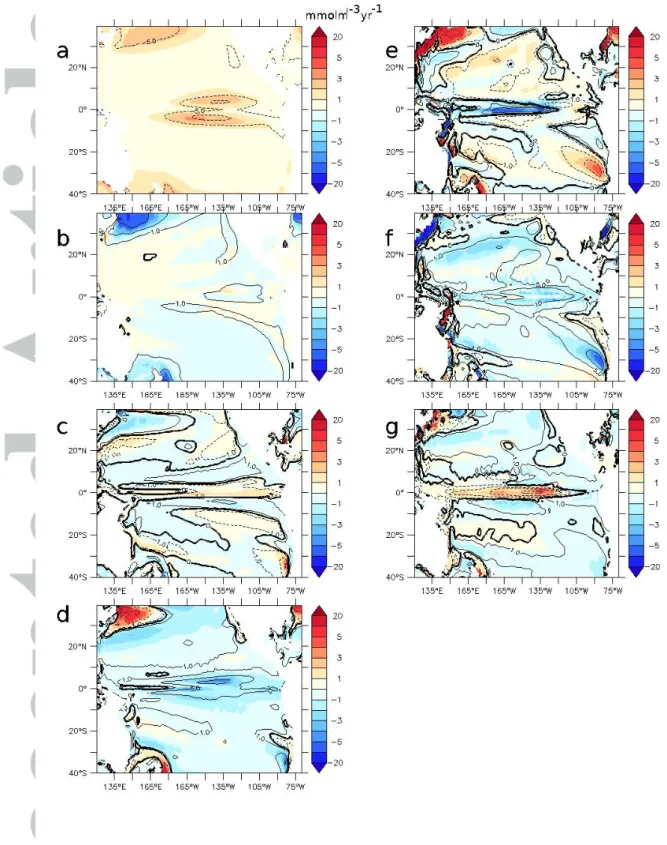
Figure 3 shows the processes at play controlling oxygen concentration (average 200–700m).
Oxygen is removed by consumption (Fig. 3a), especially in the tropics, and characterized by high primary productivity. Oxygen is supplied by several processes: i- diapycnal diffusion (Fig. 3b), transferring oxygen from the upper layer to the deeper ocean; ii- isopycnal diffusion (Fig. 3c), transferring oxygen laterally from the oxygen-rich gyres to the tropics (Isopycnal processes also transfer oxygen from the surface to the upper 100m of the ocean by tropical cells [TC] (Perez and Kessler, 2008), which are shallow recirculation cells located at around 5°S and 5°N); iii- most oxygen is supplied by advective processes (Fig. 3d). The role of the large north/south equatorial current, located at the equatorward rim of the subtropical gyres, is clearly visible in Figures 3d and 3e. At the equator, the equatorial undercurrent (EUC) (Fig. 3f) transports oxygen from the western part of the basin while the (too weak and poorly represented) intermediate current (Marin et al., 2010), located below, removes oxygen from the eastern part. The upwelling (Fig. 3g) supplies oxygenated water from the deep ocean into the OMZ. At the top of the OMZ, the vertical gradient reverses, resulting in the upwelling of poorly oxygenated water compared to the surface layer. In the STG, downwelling participates in the oxygenation of the intermediate ocean.
b. Anomalies 10D, 6H
The decrease in oxygen levels is related to changes in circulation and advective supply. In particular in the 200-700m region of the eastern tropical Pacific Ocean, the decrease in oxygen levels is related both to a decrease of the upwelling and supply of oxygen-rich waters from the deep ocean to poorly oxygenated regions and to a decrease of the horizontal supply of oxygen-rich waters originating from the western tropical ocean (Fig. S1). Large compensations occur in advective terms. A slowdown of the upwelling in 10D provides low oxygenated water at the surface—a positive vertical anomaly (Fig. 3g). The concomitant
slowdown of the meridional overturning provides high-oxygenated waters from the gyres—a negative meridional anomaly (Fig. 3f). The anomalies linked with the zonal advective terms indicate an important role of the equatorial current system (Fig. 3e) and suggest a potential role of the intermediate current system. The changes in supply by diffusive processes are relatively low (Fig. 3b, c) (except in the gyres, as the shallowing of the mixed layer in 10D is responsible for a strong negative anomaly due to diapycnal diffusion). The upper positive oxygen anomaly (50–300m) (Fig. 2f) is related to the decrease in respiration and productivity as a slower equatorial upwelling results in a smaller nutrient supply (figure not shown). A decrease in surface productivity has a stronger impact in the upper ocean as the nutrient remineralization rate follows a power law with depth (Martin et al., 1987; Kriest et al., 2008), as compensating with circulation-related processes is easier at depth than in the upper ocean.
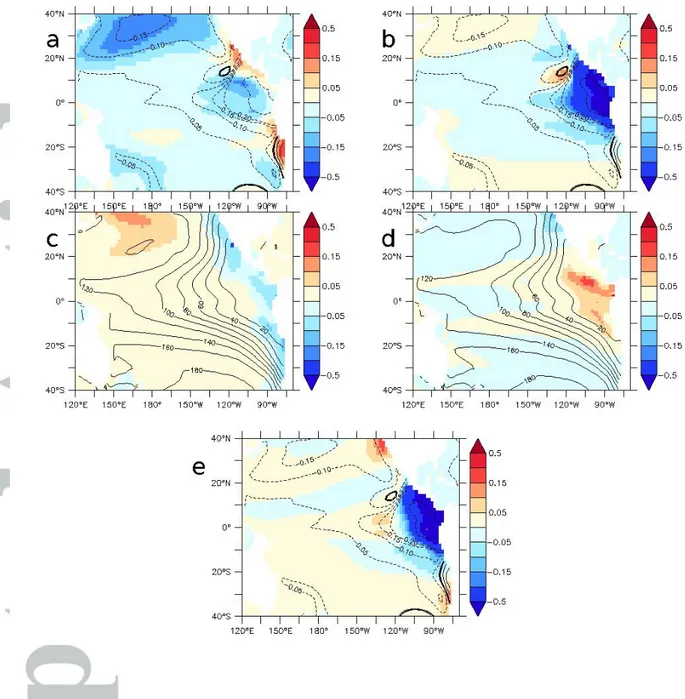
c. Tropical or subtropical origin of the anomalies
To understand whether the larger suboxic extension in 6H compared to 10D originates from a change in circulation in the tropics or the subtropics, we performed two supplementary experiments, 10DTROP and 10DGYRE (See Table 1). By comparing 10DGYRE and 6H, we specifically assess the impact of synoptic variability poleward 20° (Fig 4a). The oxygen levels decreases in the gyres (not surprisingly similar to 10D and 6H). More interesting is a decrease in oxygen levels in the eastern tropical region by up to 20%, highlighting the role of the oxygen supply from the gyres to the tropics by the STC. Comparing 10DTROP and 6H shows (Fig 4b) that most of the oxygen anomalies in the eastern tropical region are due to local (tropical) processes related to the strength of the current system and the equatorial upwelling.
d. Surface fluxes, momentum, and mixing
Wind speed has a direct effect in determining wind stress, which is directly responsible for the motion of the ocean but also modulates surface heat fluxes. The strength of wind stress also impacts the diapycnal mixing length scale (see Part 3). We assess the mechanisms by which the synoptic scales impact oxygen levels by performing two supplementary experiments: 10DFLUX and 10DTKE. These experiments are compared to experiment 10D (see Table 1). The changes in upper ocean stratification in 10DFLUX and 10DTKE (Fig 4c,d) induce changes in ocean circulation and in the amount of oxygen respired at depth (Fig. S2), resulting in a modulation by +/- 10% of the oxygen levels compared to 10D. The 10D and 6H
changes in oxygen levels are mainly due to the role of synoptic variability in determining wind stress, which drives ocean current (equations 3, 4).
6. Conclusion and discussion
We have shown that the wind speed components are characterized by a strong variability at synoptic time scale (2–10 days). Removing this synoptic variability leads to a decrease in the strength of global ocean circulation (meridional overturning, barotropic streamfunction), a decrease in oxygen levels at depth, and an increase in volume of the suboxic regions. The oxygen decrease has an advective origin in the tropics due both to a slowdown of the ocean currents in absence of synoptic activity and to an advection of poorly oxygenated waters of subtropical origin.
It is however not clear whether a change of temporal frequency of the wind stress (considering an equal magnitude) has an impact on oxygen levels. This is an important aspect as low frequency surface wind stress (instead of near-surface wind speed) may be used to force the ocean circulation, especially in climatological or long integrations, minimizing the role of non-linearities originating from equations 3 and 4. For instance, Montes et al., (2010;
2014) used climatological monthly QuickSCAT wind stress data in a regional configuration of the Peru upwelling system. Aumont et al., (2015) used climatological weekly ERS (European Remote Sensing) satellite wind stress in a global model configuration. We therefore perform an experiment 6HLOWFREQ where the wind stress obtained from 6H is resampled at a 10 days frequency and employed to force the circulation of the ocean. A decrease of similar amplitude between 6HLOWFREQ - 6H and 10D – 6H occurs in the eastern tropical Pacific Ocean (Fig 4e), highlighting the importance of the ocean circulation variability in the band of a few days (the mean circulation being very similar in 6HLOWFREQ and 6H) to set oxygen concentrations. This aspect deserves further investigations.
This study suggests that an important factor that controls the future extension of the suboxic region is not only a change in mean wind speed but also a change in “storminess” (e.g., Munday and Zhai, 2017), i.e., the frequency of storms and cyclones. A significant positive linear trend in the total number of extra tropical cyclones ranging from 1% to 2% decade−1 have been identified in NCEP and ERA-Interim datasets (Tilina and Gulev, 2013). The application of a tropical cyclone downscaling technique to six CMIP5 (Coupled Model
Intercomparison Project Phase 5) generation global climate models run under historical conditions and under the RCP8.5 emissions projection indicates an increase in global tropical cyclone activity, most evident in the North Pacific region (Emanuel, 2013). Knutson et al.
(2015) showed an increase by about 10% of tropical storms in the eastern North Pacific in the late 21st century (scenario RCP4.5) compared to the present day in a subset of CMIP5 models. Furthermore, the ITCZ narrows in response to global warming in both observations and climate models (Byrne and Schneider, 2016; 2018), increasing convection (Wodzicki and Rapp, 2016) and possibly modifying the amount of synoptic variability. Climate oscillations, such as the Pacific Decadal Oscillation or the El-Nino Southern Oscillation, also impact storminess (Kruk et al., 2015) and ITCZ-related processes.
To conclude, the atmospheric synoptic timescale has an important (but often overlooked) role in driving the mean ocean circulation and setting biogeochemical quantities. Further studies should focus on whether it impacts seasonal, interannual variability or future state of biogeochemical properties such as oxygen levels.
Acknowledgments
I thank Claus Boening (GEOMAR), Andreas Oschlies (GEOMAR) and Birgit Schneider (Uni Kiel) for discussions. This work is a contribution of the SFB754, supported by the Deutsche Forschungsgemeinschaft. The experiments have been performed at the North German Supercomputing Alliance (HLRN). The Coordinated Ocean-ice Reference Experiments
(CORE2) forcing dataset is available at:
https://data1.gfdl.noaa.gov/nomads/forms/core/COREv2.html. The code of the Nucleus for European Modeling of the Ocean (NEMO) is available at: https://www.nemo-ocean.eu/. The mean state (1948-2009) of the experiments performed in this study are available at : https://data.geomar.de/thredds/catalog/open_access/duteil_2019_grl/catalog.html
References
Aumont, O., C. Ethe, A. Tagliabue, L. Bopp, and M. Gehlen (2015), PISCES-v2: an ocean biogeochemical model for carbon and ecosystem studies, Geoscientific Model Development, 8(8), 2465-2513.
Ayrault, F., F. Lalaurette, A. Joly, and C. Loo (1995), North Atlantic ultra-high frequency variability - an introductory survey, Tellus Series a-Dynamic Meteorology and Oceanography, 47(5), 671-696.
Breitburg, D., et al. (2018), Declining oxygen in the global ocean and coastal waters, Science, 359(6371), 46.
Byrne, M. P., and T. Schneider (2016), Narrowing of the ITCZ in a warming climate:
Physical mechanisms, Geophysical Research Letters, 43(21), 11350-11357.
Byrne, M. P., and T. Schneider (2018), Atmospheric Dynamics Feedback: Concept, Simulations, and Climate Implications, Journal of Climate, 31(8), 3249-3264.
Cabre, A., I. Marinov, R. Bernardello, and D. Bianchi (2015), Oxygen minimum zones in the tropical Pacific across CMIP5 models: mean state differences and climate change trends, Biogeosciences, 12(18), 5429-5454.
Cao, X., G. H. Chen, and W. Chen (2013), Tropical cyclogenesis induced by ITCZ breakdown in association with synoptic wave train over the western North Pacific, Atmospheric Science Letters, 14(4), 294-300.
Deutsch, C., W. Berelson, R. Thunell, T. Weber, C. Tems, J. McManus, J. Crusius, T. Ito, T.
Baumgartner, V. Ferreira, J. Mey, and A. van Geen (2014). Centennial changes in North Pacific anoxia linked to tropical trade winds, Science, 345(6197), 665–668
Duteil, O., C. W. Boning, and A. Oschlies (2014a), Variability in subtropical-tropical cells drives oxygen levels in the tropical Pacific Ocean, Geophysical Research Letters, 41(24), 8926-8934.
Duteil, O., F. U. Schwarzkopf, C. W. Boning, and A. Oschlies (2014b), Major role of the equatorial current system in setting oxygen levels in the eastern tropical Atlantic Ocean: A high- resolution model study, Geophysical Research Letters, 41(6), 2033-2040.
Duteil, O., Oschlies, A., and Böning, C. W. (2018). Pacific Decadal Oscillation and recent oxygen decline in the eastern tropical Pacific Ocean, Biogeosciences, https://doi.org/10.5194/bg-2018-16
Emanuel, K. A. (2013), Downscaling CMIP5 climate models shows increased tropical cyclone activity over the 21st century, Proceedings of the National Academy of Sciences of the United States of America, 110(30), 12219-12224.
Gaspar, P., Y. Gregoris, and J. M. Lefevre (1990), a simple eddy kinetic-energy model for simulations of the oceanic vertical mixing - tests at station papa and long-term upper ocean study site, Journal of Geophysical Research-Oceans, 95(C9), 16179-16193.
Gulev, S. K., T. Jung, and E. Ruprecht (2002), Climatology and interannual variability in the intensity of synoptic-scale processes in the North Atlantic from the NCEP-NCAR reanalysis data, Journal of Climate, 15(8), 809-828.
Hu, S. N., and A. V. Fedorov (2016), Exceptionally strong easterly wind burst stalling El Nino of 2014, Proceedings of the National Academy of Sciences of the United States of America, 113(8), 2005-2010.
Ito, T., and C. Deutsch (2013). Variability of the oxygen minimum zone in the tropical North Pacific during the late twentieth century, Global Biogeochem. Cycles, 27, 1119–1128, doi:10.1002/2013GB004567, 2013
Kalnay, E., et al. (1996), The NCEP/NCAR 40-year reanalysis project, Bulletin of the American Meteorological Society, 77(3), 437-471.
Karstensen, J., L. Stramma, and M. Visbeck (2008), Oxygen minimum zones in the eastern tropical Atlantic and Pacific oceans, Progress in Oceanography, 77(4), 331-350.
Knutson, T. R., J. J. Sirutis, M. Zhao, R. E. Tuleya, M. Bender, G. A. Vecchi, G. Villarini, and D. Chavas (2015), Global Projections of Intense Tropical Cyclone Activity for the Late Twenty-First Century from Dynamical Downscaling of CMIP5/RCP4.5 Scenarios, Journal of Climate, 28(18), 7203-7224.
Kobayashi, S., et al. (2015), The JRA-55 Reanalysis: General Specifications and Basic Characteristics, Journal of the Meteorological Society of Japan, 93(1), 5-48.
Kriest, I., and A. Oschlies (2008), On the treatment of particulate organic matter sinking in large-scale models of marine biogeochemical cycles, Biogeosciences, 5(1), 55-72.
Kriest, I., S. Khatiwala, and A. Oschlies (2010), Towards an assessment of simple global marine biogeochemical models of different complexity, Progress in Oceanography, 86(3-4), 337-360.
Kruk, M. C., K. Hilburn, and J. J. Marra (2015), Using Microwave Satellite Data to Assess Changes in Storminess over the Pacific Ocean, Monthly Weather Review, 143(8), 3214-3229.
Large, W. G., and S. G. Yeager (2009), The global climatology of an interannually varying air- sea flux data set, Climate Dynamics, 33(2-3), 341-364.
Lengaigne, M., J. P. Boulanger, C. Menkes, S. Masson, G. Madec, and P. Delecluse (2002), Ocean response to the March 1997 Westerly Wind Event, Journal of Geophysical Research- Oceans, 107(C12).
Marin, F., E. Kestenare, T. Delcroix, F. Durand, S. Cravatte, G. Eldin, and R. Bourdalle-Badie (2010), Annual Reversal of the Equatorial Intermediate Current in the Pacific: Observations and Model Diagnostics, Journal of Physical Oceanography, 40(5), 915-933.
Martin, J. H., G. A. Knauer, D. M. Karl, and W. W. Broenkow (1987), VERTEX: Carbon cycling in the northeastern Pacific, Deep Sea Res., Part I, 34, 267–285.
McPhaden, M. J., and X. Yu (1999), Equatorial waves and the 1997-98 El Nino, Geophysical Research Letters, 26(19), 2961-2964.
Montes, I., F. Colas, X. Capet, and W. Schneider (2010), On the pathways of the equatorial subsurface currents in the eastern equatorial Pacific and their contributions to the Peru-Chile Undercurrent, Journal of Geophysical Research-Oceans, 115.
Montes, I., B. Dewitte, E. Gutknecht, A. Paulmier, I. Dadou, A. Oschlies, and V. Garcon (2014), High-resolution modeling of the Eastern Tropical Pacific oxygen minimum zone:
Sensitivity to the tropical oceanic circulation, Journal of Geophysical Research-Oceans, 119(8), 5515-5532.
Munday, D. R., and X. Zhai (2017), The impact of atmospheric storminess on the sensitivity of Southern Ocean circulation to wind stress changes, Ocean Modelling, 115, 14-26.
Oschlies, A., O. Duteil, J. Getzlaff, W. Koeve, A. Landolfi, and S. Schmidtko (2017), Patterns of deoxygenation: sensitivity to natural and anthropogenic drivers, Philosophical Transactions of the Royal Society a-Mathematical Physical and Engineering Sciences, 375(2102).
Perez, R. C., and W. S. Kessler (2009), Three-Dimensional Structure of Tropical Cells in the Central Equatorial Pacific Ocean, Journal of Physical Oceanography, 39(1), 27-49.
Qiu, B., and R. Lukas (1996), Seasonal and interannual variability of the North Equatorial Current, the Mindanao Current, and the Kuroshio along the Pacific western boundary, Journal of Geophysical Research-Oceans, 101(C5), 12315-12330.
Qiu, B., and S. M. Chen (2012), Multidecadal Sea Level and Gyre Circulation Variability in the Northwestern Tropical Pacific Ocean, Journal of Physical Oceanography, 42(1), 193-206.
Shigemitsu, M., A. Yamamoto, A. Oka, and Y. Yamanaka (2017), One possible uncertainty in CMIP5 projections of low-oxygen water volume in the Eastern Tropical Pacific, Global Biogeochemical Cycles, 31(5), 804-820.
Stramma, L., G. C. Johnson, J. Sprintall, and V. Mohrholz (2008), Expanding oxygen- minimum zones in the tropical oceans, Science, 320(5876), 655-658.
Stryhal, J., and R. Huth (2017), Classifications of Winter Euro-Atlantic Circulation Patterns:
An Intercomparison of Five Atmospheric Reanalyses, Journal of Climate, 30(19), 7847-7861.
Tilinina, N., S. K. Gulev, I. Rudeva, and P. Koltermann (2013), Comparing Cyclone Life Cycle Characteristics and Their Interannual Variability in Different Reanalyses, Journal of Climate, 26(17), 6419-6438.
Toth, Z., and E. Kalnay, S. M. Tracton, R. Wobus, and J. Irwin, 1997: A synoptic evaluation of the NCEP ensemble.Wea. Forecasting,12, 140–153.
Tsujino, H., et al. (2018), JRA-55 based surface dataset for driving ocean-sea-ice models (JRA55-do), Ocean Modelling, 130, 79-139.
Ulbrich, U., G. C. Leckebusch, and J. G. Pinto (2009), Extra-tropical cyclones in the present and future climate: a review, Theoretical and Applied Climatology, 96(1-2), 117-131.
Uppala, S. M., et al. (2005), The ERA-40 re-analysis, Quarterly Journal of the Royal Meteorological Society, 131(612), 2961-3012.
Verbickas, S. (1998), Westerly wind bursts in the tropical Pacific. Weather, 53: 282-284.
Wang, C. C., and G. Magnusdottir (2006), The ITCZ in the central and eastern Pacific on synoptic time scales, Monthly Weather Review, 134(5), 1405-1421.
Wodzicki, K. R., and A. D. Rapp (2016), Long-term characterization of the Pacific ITCZ using TRMM, GPCP, and ERA-Interim, Journal of Geophysical Research-Atmospheres, 121(7), 3153-3170.
Wu, Y., X. M. Zhai, and Z. M. Wang (2016), Impact of Synoptic Atmospheric Forcing on the Mean Ocean Circulation, Journal of Climate, 29(16), 5709-5724.
Table 1 : summary of the model experiments
|U10|
(eq. 1,2)
|U10|
(eq. 3,4)
u10,v10 (eq. 3,4)
|τ|
(eq. 5) 6H
2D 10D 1M
10DGYRE 10DTROP
6h 2d 10d
1m
10d (>20°) - 6h (20°S-20°N) 6h (>20°) - 10d (20°S-20°N) 10DFLX
10DTKE 6HLOWFREQ
6h 10d 6h
10d 10d 6h
(τx, τy resampled 10d)
10d 10d 6h
10d 6h 6h
Figure 1 : a- mean wind speed (ms-1) in the CORE dataset. The oxygen levels (average 200- 700m) are shown in contour. b,c,d- wind speed at 30°N/150°W, 10°N/100°W, 10°S/100°W (year 2000) (the resolution is black : 6h, red: 2d, green 10d, blue 1m). Ratio of the wind stress
between -e: 2D/6H, -f 10D/6H, -g 1M/6H. The mean wind stress (Nm-2) in 6H is shown as contour. -h : heavy precipitation (fraction of the year) and ratio of the wind stress 10D/6H
(contour).
Figure 2 : a – mean oxygen levels (mmol.m-3) of the experiment 6H (average 200 – 700m).
contour : barotropic streamfuction (Sv). b,c,d - Differences in oxygen levels (mmol-m-3) (contour: difference in barotropic streamfunctions (Sv)) between b- 2D and 6H, c- 10D and 6H, d- 1M and 6H (average 200 – 700m). e – mean oxygen levels (mmol.m-3) of the experiment 6H (110°W). contour : meridional overturning (Sv). f,g,h - Differences in oxygen levels (mmol-m-3) (contour: difference in meridional overturning (Sv)) between f- 2D and 6H, g- 10D and 6H, h- 1M and 6H (110°W). i – abscissae : meridional overturning strength (Sv) (maximal value) and ordinates : volume of the suboxic (< 5 mmol.m-3) regions (x10e15 m3) (color : maximal barotropic streamfunction (Sv)).
Figure 3 : Oxygen budget (mmol.m-3.yr-1) of the experiment 10D - 6H (200-700m) (contour : experiment 6H). a – respiration, b – diapycnal diffusion, c- isopycnal diffusion, d – total advection, e – zonal advective term, f – meridional advective term, g – vertical advection term.
Figure 4 : fraction of change in a- 10DGYRE, b- 10DTROP, c- 10DFLX, d- 10DTKE, e- 6HLOWFREQ compared to 6H (a,b,e) and 10D (c,d) (average 200 – 700 m). a,b,e contour : fraction of change 10D/6H. c,d Contour : oxygen levels (mmol.m-3) 10D.