arXiv:hep-ex/0007017v1 9 Jul 2000
EUROPEAN ORGANIZATION FOR NUCLEAR RESEARCH
CERN-EP-2000-070 31 May 2000
Multiplicities of π 0 , η, K 0 and of charged particles in quark and
gluon jets
The OPAL Collaboration
Abstract
We compared the multiplicities ofπ0, η,K0and of charged particles in quark and gluon jets in 3-jet events, as measured by the OPAL experiment at LEP.
The comparisons were performed for distributions unfolded to 100% pure quark and gluon jets, at an effective scale Qjet which took into account topological dependences of the 3-jet environment. The ratio of particle multiplicity in gluon jets to that in quark jets as a function of Qjet forπ0, η or K0 was found to be independent of the particle species. This is consistent with the QCD prediction that the observed enhancement in the mean particle rate in gluon jets with respect to quark jets should be independent of particle species. In contrast to some theoretical predictions and previous observations, we observed no evidence for an enhancement of η meson production in gluon jets with respect to quark jets, beyond that observed for charged particles. We measured the ratio of the slope of the average charged particle multiplicity in gluon jets to that in quark jets, C, and we compared it to a next-to-next-to-next-to leading order calculation. Our result, C = 2.27 ±0.20(stat + syst), is about one standard deviation higher than the perturbative prediction.
(Submitted to Eur. Phys. Jour. C)
The OPAL Collaboration
G. Abbiendi2, K. Ackerstaff8, C. Ainsley5, P.F. Akesson3, G. Alexander22, J. Allison16, K.J. Anderson9, S. Arcelli17, S. Asai23, S.F. Ashby1, D. Axen27, G. Azuelos18,a, I. Bailey26,
A.H. Ball8, E. Barberio8, R.J. Barlow16, J.R. Batley5, S. Baumann3, T. Behnke25, K.W. Bell20, G. Bella22, A. Bellerive9, S. Bentvelsen8, S. Bethke14,i, O. Biebel14,i, I.J. Bloodworth1, P. Bock11, J. B¨ohme14,h, O. Boeriu10, D. Bonacorsi2, M. Boutemeur31,
S. Braibant8, P. Bright-Thomas1, L. Brigliadori2, R.M. Brown20, H.J. Burckhart8, J. Cammin3, P. Capiluppi2, R.K. Carnegie6, A.A. Carter13, J.R. Carter5, C.Y. Chang17,
D.G. Charlton1,b, C. Ciocca2, P.E.L. Clarke15, E. Clay15, I. Cohen22, O.C. Cooke8, J. Couchman15, C. Couyoumtzelis13, R.L. Coxe9, M. Cuffiani2, S. Dado21, G.M. Dallavalle2,
S. Dallison16, A. de Roeck8, P. Dervan15, K. Desch25, B. Dienes30,h, M.S. Dixit7, M. Donkers6, J. Dubbert31, E. Duchovni24, G. Duckeck31, I.P. Duerdoth16, P.G. Estabrooks6, E. Etzion22, F. Fabbri2, M. Fanti2, L. Feld10, P. Ferrari12, F. Fiedler8,
I. Fleck10, M. Ford5, A. Frey8, A. F¨urtjes8, D.I. Futyan16, P. Gagnon12, J.W. Gary4, G. Gaycken25, C. Geich-Gimbel3, G. Giacomelli2, P. Giacomelli8, D. Glenzinski9, J. Goldberg21, C. Grandi2, K. Graham26, E. Gross24, J. Grunhaus22, M. Gruw´e25, P.O. G¨unther3, C. Hajdu29, G.G. Hanson12, M. Hansroul8, M. Hapke13, K. Harder25, A. Harel21, C.K. Hargrove7, M. Harin-Dirac4, A. Hauke3, M. Hauschild8, C.M. Hawkes1, R. Hawkings25, R.J. Hemingway6, C. Hensel25, G. Herten10, R.D. Heuer25, M.D. Hildreth8,
J.C. Hill5, A. Hocker9, K. Hoffman8, R.J. Homer1, A.K. Honma8, D. Horv´ath29,c, K.R. Hossain28, R. Howard27, P. H¨untemeyer25, P. Igo-Kemenes11, K. Ishii23, F.R. Jacob20,
A. Jawahery17, H. Jeremie18, C.R. Jones5, P. Jovanovic1, T.R. Junk6, N. Kanaya23, J. Kanzaki23, G. Karapetian18, D. Karlen6, V. Kartvelishvili16, K. Kawagoe23, T. Kawamoto23, R.K. Keeler26, R.G. Kellogg17, B.W. Kennedy20, D.H. Kim19, K. Klein11, A. Klier24, T. Kobayashi23, M. Kobel3, T.P. Kokott3, S. Komamiya23, R.V. Kowalewski26,
T. Kress4, P. Krieger6, J. von Krogh11, T. Kuhl3, M. Kupper24, P. Kyberd13, G.D. Lafferty16, H. Landsman21, D. Lanske14, I. Lawson26, J.G. Layter4, A. Leins31, D. Lellouch24, J. Letts12, L. Levinson24, R. Liebisch11, J. Lillich10, B. List8, C. Littlewood5,
A.W. Lloyd1, S.L. Lloyd13, F.K. Loebinger16, G.D. Long26, M.J. Losty7, J. Lu27, J. Ludwig10, A. Macchiolo18, A. Macpherson28, W. Mader3, M. Mannelli8, S. Marcellini2, T.E. Marchant16, A.J. Martin13, J.P. Martin18, G. Martinez17, T. Mashimo23, P. M¨attig24,
W.J. McDonald28, J. McKenna27, T.J. McMahon1, R.A. McPherson26, F. Meijers8, P. Mendez-Lorenzo31, F.S. Merritt9, H. Mes7, A. Michelini2, S. Mihara23, G. Mikenberg24,
D.J. Miller15, W. Mohr10, A. Montanari2, T. Mori23, K. Nagai8, I. Nakamura23, H.A. Neal12,f, R. Nisius8, S.W. O’Neale1, F.G. Oakham7, F. Odorici2, H.O. Ogren12, A. Oh8, A. Okpara11, M.J. Oreglia9, S. Orito23, G. P´asztor8,j, J.R. Pater16, G.N. Patrick20, J. Patt10, P. Pfeifenschneider14, J.E. Pilcher9, J. Pinfold28, D.E. Plane8, B. Poli2, J. Polok8,
O. Pooth8, M. Przybycie´n8,d, A. Quadt8, C. Rembser8, H. Rick4, S.A. Robins21, N. Rodning28, J.M. Roney26, S. Rosati3, K. Roscoe16, A.M. Rossi2, Y. Rozen21, K. Runge10,
O. Runolfsson8, D.R. Rust12, K. Sachs6, T. Saeki23, O. Sahr31, E.K.G. Sarkisyan22, C. Sbarra26, A.D. Schaile31, O. Schaile31, P. Scharff-Hansen8, S. Schmitt11, M. Schr¨oder8,
M. Schumacher25, C. Schwick8, W.G. Scott20, R. Seuster14,h, T.G. Shears8, B.C. Shen4, C.H. Shepherd-Themistocleous5, P. Sherwood15, G.P. Siroli2, A. Skuja17, A.M. Smith8, G.A. Snow17, R. Sobie26, S. S¨oldner-Rembold10,e, S. Spagnolo20, M. Sproston20, A. Stahl3, K. Stephens16, K. Stoll10, D. Strom19, R. Str¨ohmer31, B. Surrow8, S.D. Talbot1, S. Tarem21,
R.J. Taylor15, R. Teuscher9, M. Thiergen10, J. Thomas15, M.A. Thomson8, E. Torrence9, S. Towers6, T. Trefzger31, I. Trigger8, Z. Tr´ocs´anyi30,g, E. Tsur22, M.F. Turner-Watson1,
I. Ueda23, P. Vannerem10, M. Verzocchi8, H. Voss8, J. Vossebeld8, D. Waller6, C.P. Ward5, D.R. Ward5, P.M. Watkins1, A.T. Watson1, N.K. Watson1, P.S. Wells8, T. Wengler8, N. Wermes3, D. Wetterling11 J.S. White6, G.W. Wilson16, J.A. Wilson1, T.R. Wyatt16,
S. Yamashita23, V. Zacek18, D. Zer-Zion8
1School of Physics and Astronomy, University of Birmingham, Birmingham B15 2TT, UK
2Dipartimento di Fisica dell’ Universit`a di Bologna and INFN, I-40126 Bologna, Italy
3Physikalisches Institut, Universit¨at Bonn, D-53115 Bonn, Germany
4Department of Physics, University of California, Riverside CA 92521, USA
5Cavendish Laboratory, Cambridge CB3 0HE, UK
6Ottawa-Carleton Institute for Physics, Department of Physics, Carleton University, Ot- tawa, Ontario K1S 5B6, Canada
7Centre for Research in Particle Physics, Carleton University, Ottawa, Ontario K1S 5B6, Canada
8CERN, European Organisation for Nuclear Research, CH-1211 Geneva 23, Switzerland
9Enrico Fermi Institute and Department of Physics, University of Chicago, Chicago IL 60637, USA
10Fakult¨at f¨ur Physik, Albert Ludwigs Universit¨at, D-79104 Freiburg, Germany
11Physikalisches Institut, Universit¨at Heidelberg, D-69120 Heidelberg, Germany
12Indiana University, Department of Physics, Swain Hall West 117, Bloomington IN 47405, USA
13Queen Mary and Westfield College, University of London, London E1 4NS, UK
14Technische Hochschule Aachen, III Physikalisches Institut, Sommerfeldstrasse 26-28, D- 52056 Aachen, Germany
15University College London, London WC1E 6BT, UK
16Department of Physics, Schuster Laboratory, The University, Manchester M13 9PL, UK
17Department of Physics, University of Maryland, College Park, MD 20742, USA
18Laboratoire de Physique Nucl´eaire, Universit´e de Montr´eal, Montr´eal, Quebec H3C 3J7, Canada
19University of Oregon, Department of Physics, Eugene OR 97403, USA
20CLRC Rutherford Appleton Laboratory, Chilton, Didcot, Oxfordshire OX11 0QX, UK
21Department of Physics, Technion-Israel Institute of Technology, Haifa 32000, Israel
22Department of Physics and Astronomy, Tel Aviv University, Tel Aviv 69978, Israel
23International Centre for Elementary Particle Physics and Department of Physics, Univer- sity of Tokyo, Tokyo 113-0033, and Kobe University, Kobe 657-8501, Japan
24Particle Physics Department, Weizmann Institute of Science, Rehovot 76100, Israel
25Universit¨at Hamburg/DESY, II Institut f¨ur Experimental Physik, Notkestrasse 85, D- 22607 Hamburg, Germany
26University of Victoria, Department of Physics, P O Box 3055, Victoria BC V8W 3P6, Canada
27University of British Columbia, Department of Physics, Vancouver BC V6T 1Z1, Canada
28University of Alberta, Department of Physics, Edmonton AB T6G 2J1, Canada
29Research Institute for Particle and Nuclear Physics, H-1525 Budapest, P O Box 49, Hun- gary
30Institute of Nuclear Research, H-4001 Debrecen, P O Box 51, Hungary
31Ludwigs-Maximilians-Universit¨at M¨unchen, Sektion Physik, Am Coulombwall 1, D-85748 Garching, Germany
a and at TRIUMF, Vancouver, Canada V6T 2A3
b and Royal Society University Research Fellow
c and Institute of Nuclear Research, Debrecen, Hungary
d and University of Mining and Metallurgy, Cracow
e and Heisenberg Fellow
f now at Yale University, Dept of Physics, New Haven, USA
g and Department of Experimental Physics, Lajos Kossuth University, Debrecen, Hungary
h and MPI M¨unchen
i now at MPI f¨ur Physik, 80805 M¨unchen
j and Research Institute for Particle and Nuclear Physics, Budapest, Hungary.
1 Introduction
QCD predicts differences between quark and gluon jets. These are due to the different relative probabilities for a gluon and a quark to radiate an additional gluon, given by the SU(3) group constants CA = 3 and CF = 4/3. The various measurements of these differences from e+e−collider experiments are found to agree with the theoretical predictions: gluon jets are observed to have higher mean particle multiplicity, a softer fragmentation function and a wider angular spread than light quark jets [1].
The QCD prediction of an enhancement of particle multiplicity in gluon jets with respect to quark jets is independent of the particle species, except for some small cor- rections. This prediction can be tested by measuring the rates of identified particles in gluon and quark jets. These measurements are also necessary for a better under- standing of fragmentation processes and hadronisation models. The models presently used are mainly the string [2, 3] and cluster models [4] implemented in the Jetset [3]
and Herwig [4] Monte Carlo generators. Both models are based on the parton shower approach, Jetset using a leading log perturbative QCD calculation, and Herwig a next-to-leading log calculation.
Some measurements of identified particle rates in quark and gluon jets have al- ready been made by the LEP experiments [5], and the ratios of rates in quark and gluon jets have been determined. The ratios of rates of K+, K0, and protons were found to be consistent with the ratio of rates of the average charged particle mul- tiplicity and also consistent with the ratio of rates determined from Monte Carlo simulations. The ratio of rates for Λ was measured by OPAL [5] and found to be larger than the Monte Carlo expectation. The ratio of the η meson production rate in 3-jet events to the η production rate in 2-jet events was observed by the L3 ex- periment [6] to be larger than the Monte Carlo expectation. It was suggested that this difference could be caused by an enhanced η meson production in gluon jets. A confirmation of this result would suggest that, in addition to the QCD predicted en- hancement in gluon jets with respect to quark jets at equal jet energies, otherηmeson sources might exist in gluon jets. Such sources could be production of glueballs and their decay to isoscalar mesons as has been foreseen in some theoretical models [7].
However, the ALEPH experiment [8] observed no evidence for an enhancement of η mesons in gluon jets in excess of the Monte Carlo expectation.
Experimentally, results from the comparison of charged particle or identified par- ticle rates in quark and gluon jets are highly dependent on event topologies (i.e. the jet localisation with respect to other jets in the event) and even more dependent on the jet energies. Furthermore, comparison between the experimental results and the QCD predictions is complicated by the use of jet-finding algorithms. Analytic calcu- lations do not employ jet finders to assign particles to jets. To cope with these energy and topological dependences, a transverse momentum-like scale Qjet (see Equation 2) has been proposed [9] and was used for a comparison of the mean charged particle multiplicity in quark and gluon jets [10].
In this paper, the rates ofπ0, ηand K0in quark and gluon jets are measured for the first time as a function of the scale Qjet. A phenomenological formula for the charged particle rate Nq(Qjet) in quark jets, written as a second order polynomial in ln(Qjet), and a phenomenological formula for the charged particle rate Ng(Qjet) in gluon jets, written as a linear function of Nq(Qjet), were used to describe simultaneously the observed charged particle multiplicities in quark and in gluon jets. The functions Nq(Qjet) and Ng(Qjet), with all parameters set to the values obtained from a fit to the observed charged particle distributions, were used as a model to compare to the measured rates of identified particles in quark and gluon jets. For each comparison, only one overall normalisation factor, common to Nq(Qjet) and Ng(Qjet),is allowed to vary. This method provides a model independent way of testing that the enhancement of particle production in gluon jets with respect to quark jets is independent of the particle species.
2 Data selection
2.1 Selection of hadronic Z
0decays
The present analysis was based on the full hadronic event sample collected at centre- of-mass energies at and near the Z0 peak by the OPAL detector from 1991 to 1995.
This corresponded to about 4 million hadronic Z0 decays. A full description of the OPAL detector can be found in [11]. Standard OPAL selection criteria were applied for track and electromagnetic cluster selection [12]. Tracks were required to have:
at least 20 measured points in the jet chamber, a measured momentum greater than 0.10 GeV, an impact parameter | d0 | in the r −φ plane smaller than 2 cm, a z position within 25 cm of the interaction point and a measured angle with respect to the beam axis of greater than 20◦. Electromagnetic clusters were required to have an energy greater than 0.1 GeV if they were in the barrel part of the detector (i.e.
| cosθ | ≤0.82) or greater than 0.3 GeV if they were in the endcap part. The selected tracks and clusters not associated with tracks were fed, as four-vectors, to the jet- finding algorithms. Background from all sources was reduced to less than 0.8% and was neglected throughout the analysis. It was reduced by requiring for each event more than 7 measured tracks, a visible energy (i.e. the sum of detected particle energies after correcting for double counting) larger than 60 GeV and an angle larger than 25◦ between the calculated thrust axis and the beam axis .
2.2 Event simulation
Detector effects and detection efficiencies for the studied particles were evaluated us- ing 8 million Monte Carlo hadronic Z0 decays. Events were generated using the Jetset program tuned to reproduce the global features of hadronic events as measured with the OPAL detector. About 4 million events generated by the Herwig program were also used for comparison. The generated events were processed through a full simu- lation of the OPAL detector [13] and were processed using the same reconstruction and selection programs as were applied to the data.
2.3 Selection of 3-jet events
Three jet-finding algorithms were used: Luclus [3], Durham [14] and the cone [15] jet finder. The Luclus jet finder was found to provide the best jet angular resolution, which was relevant for the present analysis. Luclus was therefore used as the refer- ence algorithm while the two others were used for systematic comparisons. The jet algorithm was forced to resolve three jets in each hadronic event. The jet energies and momenta were then calculated by imposing energy and momentum conservation with planar massless kinematics [16], using the jet directions found by the jet algorithm.
They are given by the cyclic relation:
Ei=
√s·sinθj,k
sinθi,j+ sinθj,k+ sinθk,i
, (1)
where θi,j is the angle between jet i and jet j. The event was accepted as a 3-jet event if each jet contained at least 3 charged particles, had a corrected energy exceeding 5 GeV, and pointed more than 20◦ away from the beam axis and more than 30◦ away from the direction of the other two jets.
The variable Y = (D2→3 −D3→4)/Evisible was used, where D2→3 and D3→4 were the Luclus jet algorithm resolution parameters (Djoin) [3] for the transition from 2 to 3 and 3 to 4 jets, respectively, and Evisible the total visible energy. This variable measured the topological stability of the event as a 3-jet event. For larger values of Y, the events tended to be three-fold symmetric, meaning that all inter-jet angles were close to 120◦.To select stable 3-jet events (i.e. events not close to the transition from three to four jets), only events with Y >0.21 were kept for further processing.
The total selected data sample contained approximately 493 000 3-jet events, which was 12.32% of the total initial event sample. The corresponding fraction for Monte Carlo events was 12.30% for Jetset and 12.17% for Herwig.
For the Monte Carlo events, the jet-finding algorithm was applied at the parton, hadron and detector levels (defined in Section 3.2). At each level the jet energies were corrected to satisfy the constraints of energy and momentum conservation with planar massless kinematics, after which the jets were energy ordered, the first jet being the jet with the highest energy. The matching from parton to hadron level and from hadron to detector level was done using a simple angular correspondence:
a jet at hadron level was matched with only one detector jet and one parton jet, those having the minimal angular deviation with respect to the hadron jet direction.
1The corresponding Y variable for Durham was defined as Y = y2→3−y3→4, where y is the usual ycut [14]. For the cone jet finder the inter-jet angles were considered instead.
The jet energy resolution, defined as (Epartonjet −Edetectorjet )/Epartonjet , was found to range from 5% for the first jet to 13% for the third jet. The angle between the parton jet direction and the detector jet direction was found to have an r.m.s. of 0.07 radians for the highest energy jet and 0.16 radians for the lowest energy jet.
3 Analysis method
In this section, the jet scale Qjet and the jet purities are defined and the method of unfolding the average charged particle multiplicity to 100% pure quark and gluon jets is explained. In Section 4 the measured average charged particle multiplicity in pure quark and gluon jets, as a function of the scale Qjet, was fitted to phenomenological formulae. The purpose of the fit was to obtain an analytical shape that could be used as a reference or a model to compare in Section 6 to the corresponding shapes obtained in Section 5 for π0, η and K0. Systematic effects that could have distorted the measured shape are discussed in Section 4.3.
3.1 Jet scale Q
jetIt has already been shown [9] that the jet energy alone is not an adequate scale to describe the average particle multiplicity in quark and gluon jets. Coherence in QCD radiation suggests [17] that the position of a parton with respect to other partons in the event (i.e. the event topology) should also be considered in studies of jet proper- ties. Inter-jet coherence effects that can lead to destructive or constructive interfer- ence effects on the particle flux in the inter-jet angular region, have been predicted and observed experimentally. An example is the string effect [18]. A transverse- momentum-like scale combining the jet energy and its angular position with respect to the other jets has been used [17] in a phenomenological study of parton shower characteristics. This scale Qjet was defined as:
Qjet = Ejetsin(θ/2) (2)
whereθ was the jet angle with respect to the closest jet. Qjet has already been used in an experimental study of multiplicity in e+e−3-jet events [10]. The way the scale Qjet
incorporates the topological dependence can be seen, for example, at leading order in αs for the three parton q¯qg vertex: colour being conserved in QCD, the gluon can be represented by a q¯q pair that compensates exactly the total colour charge of the initial q¯q pair. A mutual colour shielding occurs when the initial quark or anti-quark is close in angle to the gluon and reduces subsequent gluon radiation. This colour shielding is minimal for back-to-back partons, and the scale Qjet becomes equal to the parton energy for that case.
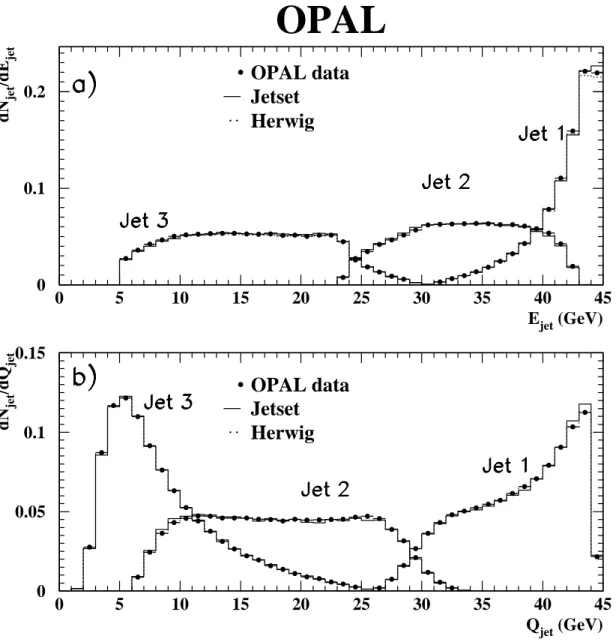
The scale Qjet was used for the present analysis with no restriction on event topology except for the minimal inter-jet angle. The distributions of energy, Ejet,and scale, Qjet (normalised to the total number of analysed hadronic events), for the three energy ordered jets, are shown in Figures 1a and 1b. The Monte Carlo distributions were found to reproduce the data very well.
3.2 Gluon jet definition and purity estimation
The jet having the smallest energy, Ejet,was found to have the highest gluon purity.
The jet purities were estimated using the Monte Carlo information: the initial par- ton shower (parton level), the generated hadrons after the fragmentation processes (hadron level) and the reconstructed particles after the simulation of the full OPAL detector response (detector level). At the hadron level, all charged and neutral par- ticles with lifetimes greater than 3×10⁻¹⁰s were considered as stable particles. A jet at the detector level was considered to be a gluon jet if it matched a parton jet that did not contain either the initial quark or anti-quark from the Z decay. The jet purities were determined directly from Monte Carlo as the fraction of quark or gluon jets present in the jet sample at a fixed scale Qjet.
The purities could also be estimated from matrix element calculations. It has been shown [19] that, for leading order QCD matrix elements, the probability for a given jet {i} among the jets {i,j,k} to be a gluon jet can be expressed as a function of the jet energies:
Pi=g ∝ x2j + x2k
(1−xj)(1−xk), (3)
where xi = 2Ei/√
s and the corresponding probability for being a quark jet is
Pi=q = 1−Pi=g, (4)
normalised to have:
P1=q+ P2=q+ P3=q = 2. (5)
The purities obtained using Monte Carlo information are shown in Figure 2 together with the purities obtained from the matrix elements. In the same figure are also shown the purities for OPAL data obtained from the matrix element formula. Very good agreement was obtained between the two methods, with less than 2% deviation in most of the range of Qjet common to the second and third jet (see Figure 1 and Figure 2). Therefore, the matrix element formula was used to estimate the jet purities directly from the data. The same agreement was also observed for Herwig Monte Carlo events.
3.3 Unfolding to pure quark and gluon jets
The measured jet samples were mixtures of quark and gluon jets, while meaningful comparison of gluon and quark jets should be performed on quantities evaluated for pure samples of gluon jets and pure samples of quark jets. This analysis used the average charged particle multiplicity for samples of jets at the same scale Qjet but having different gluon/quark jet purities. If hN1(Qjet)iand hN2(Qjet)iare the average measured charged particle multiplicities for two jet samples with different quark jet purities P1(Qjet) and P2(Qjet) at the same Qjet value, then:
hN1(Qjet)i= P1(Qjet)hNq(Qjet)i+ (1−P1(Qjet))hNg(Qjet)i (6) hN2(Qjet)i= P2(Qjet)hNq(Qjet)i+ (1−P2(Qjet))hNg(Qjet)i (7)
where hNq(Qjet)i and hNg(Qjet)i are the average particle multiplicities for 100% pure quark and gluon jet sample. This gives:
Nq(Qjet) = (1−P2(Qjet))hN1(Qjet)i+ (1−P1(Qjet))hN2(Qjet)i
P1(Qjet)−P2(Qjet) (8) Ng(Qjet) = P1(Qjet)hN2(Qjet)i −P2(Qjet)hN1(Qjet)i
P1(Qjet)−P2(Qjet) . (9) This unfolding was only possible in the region where the Qjet scales of the jet samples overlapped. The Qjet distributions of the energy ordered jets (see Figure 1) showed that the second and the third jets could be considered to be different samples over a common range of Qjet from 6 to 26 GeV.
4 Average charged particle multiplicities
4.1 Measurements and parametrisation
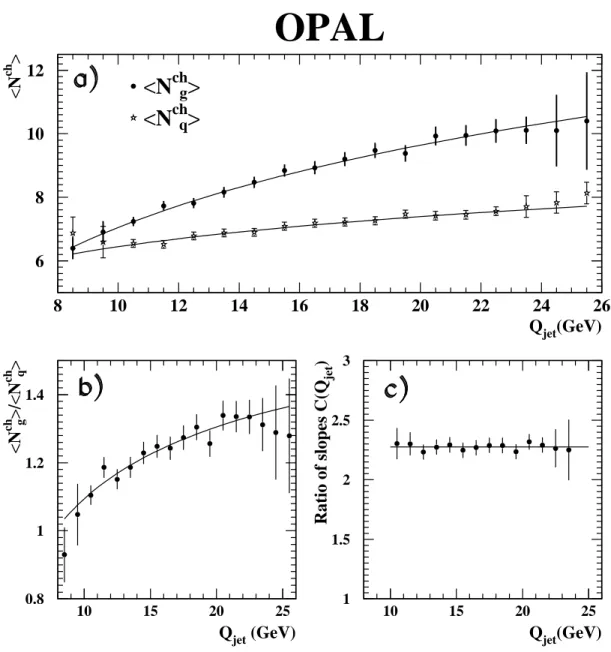
The average number of charged particles, hNchi, per jet in bins of 1 GeV of the scale Qjet was measured for samples of the second and third jets, being respectively quark enriched and gluon enriched through jet energy ordering and having a wide common range of Qjet. In each bin of Qjet, the average purity was obtained from the matrix element formula. The efficiency corrections from detector to hadron level were calculated from Monte Carlo information as a function of Qjet for each jet sample separately. The efficiency was defined as the ratio of the average number of charged particles at the detector level for a given jet sample at a given scale Qjet, divided by the equivalent quantity for the corresponding jet sample at the hadron level. The efficiencies were found to be approximately independent of Qjet for all jet samples, and the corresponding corrections tohNch(Qjet)iwere at the level of 10%. The results obtained after unfolding to 100% pure quark and gluon jets are shown in Figure 3.
The unfolding was performed for Qjet >7 GeV,since the method worked for all three jet finders in this region.
The average charged particle multiplicities in quark jets, hNqi, and in gluon jets, hNgi,were simultaneously described with phenomenological formulae. The parametri- sation was given by:
hNq(Qjet)i= a0+ a1ln Qjet+ a2(ln Qjet)2 (10) hNg(Qjet)i= R0+ R1hNq(Qjet)i (11) where a0, a1, a2, R0 and R1 are constants. This parametrisation resembles the next- to-leading order expressions given in [20, 21], but with an extra offset parameter R0. The leading order expressions [20, 21] alone were found to be unable to fit the data, as was also found in [10] and discussed in [22]. The Qjet dependent average charged parti- cle multiplicities for quark and gluon jets were fitted simultaneously to the expressions forhN1(Qjet)iandhN2(Qjet)i(Equations 6 and 7) wherehNq(Qjet)iandhNq(Qjet)iwere replaced by the expressions given in equations 10 and 11. The result of the fit yielded:
a0 = 2.74±0.07, a1 = 1.71±0.05, a2 =−0.05±0.07, R0 =−7.27±0.52 and R1 =
2.27±0.07.The fitted functions are shown with the data points unfolded using equa- tions 8 and 9 in Figure 3a, where a good description of the average charged particle multiplicities in both the gluon and the quark jets can be seen.
The ratio of the average charged particle multiplicities in gluon to quark jets is shown in Figure 3b. This ratio is predicted by QCD to be the same for all particle species. A test of this prediction is the quality of the fits of the above analytical function for charged particles to the measured multiplicities of π0, ηand K0 in quark and gluon jets with all parameters fixed except for an overall normalisation factor.
4.2 Ratio of the slopes of the multiplicities
From QCD perturbative calculations, the ratio of particle multiplicities in gluon and quark jets is given by:
Ng(Qjet) = R(Qjet)×Nq(Qjet) (12) where the asymptotic limit of R(Qjet) at large Qjet is an approximation to the QCD colour factor ratio R = CA/CF = 2.25. At the Z0 scale, this value is lower due to sizeable higher order corrections. However, the ratio of the slopes
C(Qjet) = dhNgi/dQjet
dhNqi/dQjet
(Qjet) (13)
of multiplicities in quark and gluon jets is expected to be less affected by these higher order corrections [23]. The slope ratio C has been recently calculated [23] using a next- to-next-to-next-to leading order (3NLO) perturbative approximation. The predicted value of C(Qjet) in Z0 decays is C≃1.92.
From the parametrisation given in equations 10 and 11 that imposes a constant value for C(Qjet) (Equation 13), we obtained:
C(Qjet) = R1 = 2.27±0.07(stat.)±0.19(syst.). (14) The constraint C(Qjet) = constant can be released by extracting the spectrum C(Qjet) from the measured distributions hNq(Qjet)i and hNq(Qjet)i. This was done by using as an estimate of the derivative at each bin Qjet the slope of a fitted line to three adjacent bins centred at Qjet. The obtained C(Qjet) spectrum is shown in Figure 3c, and a fit to a constant yielded:
C = 2.27±0.09(stat)±0.27(syst).
The systematic uncertainty, for both methods, was mainly due to differences be- tween the jet finders and the correlations between the unfolded values of Ng(Qjet) and Nq(Qjet) at each bin of Qjet. The two values are about one standard deviation higher than the prediction [23] C≃1.92.
The Delphi collaboration recently presented a measurement of the ratio of slopes[10].
Their result, C = 1.97±0.10(stat), is about one standard deviation of the total un- certainty bellow our measurement.
4.3 Stability of the parametrisation of multiplicities
To study systematic effects on the parametrisation of the charged particle multiplicity obtained in the previous section, several variations to the analysis procedure were ap- plied. For each variation, newhNq(Qjet)i andhNq(Qjet)iwere obtained and compared to the original distributions. At each data point, the deviation with respect to the original value is considered as a systematic error. The errors were added quadrati- cally and were included in the error bars of the original data points shown in Figure 3. For each variation, the distributions hNq(Qjet)i and hNq(Qjet)i were also fitted to the functions of equations 10 and 11. The resulting parametrisation was compared to the original one by calculating the largest relative difference between the new and the original function values. The following systematic variations were considered:
1. The analysis was completely repeated with the Durham and cone jet finders.
The parametrisation was found to agree well between the Luclus (original) and the Durham jet finders. The parametrisation obtained using the cone jet finder agreed within 10% with the original one.
2. The analysis was repeated using a different method for estimating the efficien- cies. The fully unfolded average charged particle multiplicities were obtained, as a function of Qjet and for each jet sample, at the hadron level and then at the detector level. The ratio of detector to hadron level was then used to cor- rect the average multiplicities of the data after having performed the unfolding.
This procedure was done with the Jetset and Herwig Monte Carlos and the cor- rections were found to differ by at most 3%. The analytic formula (Equations 10 and 11) was then fitted to the average charged particle multiplicity spectra corrected separately with Jetset and Herwig. The shape was found to agree with the original one within 2% for Jetset and 3% for Herwig.
3. The influence of the jet purities was studied by using the purities from the Monte Carlo matching, and also by increasing the cut on D from 0.20 to 0.25.
The effect on the fitted parametrisation was negligible.
4. Effects of soft particles on the measured multiplicities were studied by changing the minimum momentum required per track from 0.10 GeV to 0.15 GeV, and the minimum number of tracks per jet was also changed from 3 to 5. The analysis was repeated and the fitted parametrisation agreed with the original one within 3%.
5. The analysis was repeated with two different jet samples. The first jet sample was gluon enriched by requiring that two jets were tagged as b-quark jets with a neural network b-tagging method and the remaining jet was considered as a gluon jet. The second jet sample, which was quark enriched, was obtained by selecting all second jets (energy ordered) in the events having no b-tagged quark jets. The average gluon purity was 80% for the first jet sample, and the average quark purity was 65% for the second jet sample. The fitted parametrisation agreed with the original one within 8%.The new average charged particle mul- tiplicity spectra, unfolded to 100% quark and gluon purities, agreed very well
with the original spectra. Differences at each data point were considered as sys- tematic errors; this should, in principle, also account for possible correlations between the measured Ng(Qjet) and Nq(Qjet).
5 π
0, η and K
0meson production
This section describes the reconstruction of the decay channels η → 2γ, π0 → 2γ and K0S →π+π− for the full Z0 hadronic decay sample without any 3-jet requirement.
In order to gain more confidence for the rate measurements in quark and gluon jets (see Section 6), the total inclusive rates as well as the differential rates in hadronic Z0 decays of π0, η and K0 were measured and compared to previous such measurements at LEP.
5.1 π
0and η reconstruction
The reconstruction was restricted to the barrel region of the detector. A procedure [24]
using a parametrisation of the expected lateral energy distribution of electromagnetic showers was optimised to resolve as many photon candidates as possible from the overlapping energy deposits in the electromagnetic calorimeter, in the dense environ- ment of hadronic jets. The procedure was efficient but led to a rather low purity due to reconstructing spurious photons (“fakes”). Based on Monte Carlo simulated events, the rejection of fake photons was studied using a set of five measurable vari- ables, namely: Eγ : the energy of the photon candidate, Eclust : the energy of the nearest cluster to the considered photon candidate, θclust : the opening angle between the photon candidate and the nearest cluster, θtrk : the opening angle between the photon candidate and the closest reconstructed track, and Etrk : the amount of en- ergy that could be attributed to tracks in an array of 3x3 lead glass blocks around the position of the photon candidate. A large number of obvious fake photons (mostly with Eγ ≤300 MeV) were rejected with the following two cuts:
1. A candidate was rejected if it was found to satisfy:
Eγ <A·Eclust·exp
− θclust
40 mrad
!2
. (15)
Thus, when more than one photon candidate was obtained from a single elec- tromagnetic cluster, candidates that had small energy compared to the cluster energy were rejected if their reconstructed position was close to the cluster cen- tre. The 40 mrad in the exponential is the average polar aperture of a lead glass block as seen from the interaction vertex. The factor A was determined empir- ically from the Monte Carlo sample. It was set at a value which ensured that the number of rejected photons was less than 1/10 of the number of rejected fake photons in all energy bins of Eγ.
2. A candidate was also rejected if it was found to satisfy:
θtrk<B + C·exp
−
Eγ
Etrk
2
. (16)
A photon candidate was likely to be fake if it had an energy, Eγ, smaller than the electromagnetic energy which could be attributed to tracks. The factors B and C were determined from the Monte Carlo sample. They were also set at values which ensured that the number of rejected photons was less than 1/10 of the number of rejected fake photons in all energy bins of Eγ.
The number of remaining fake photons was further reduced using a weight function W(Eγ,Eclust, θclust, θtrk,Etrk)
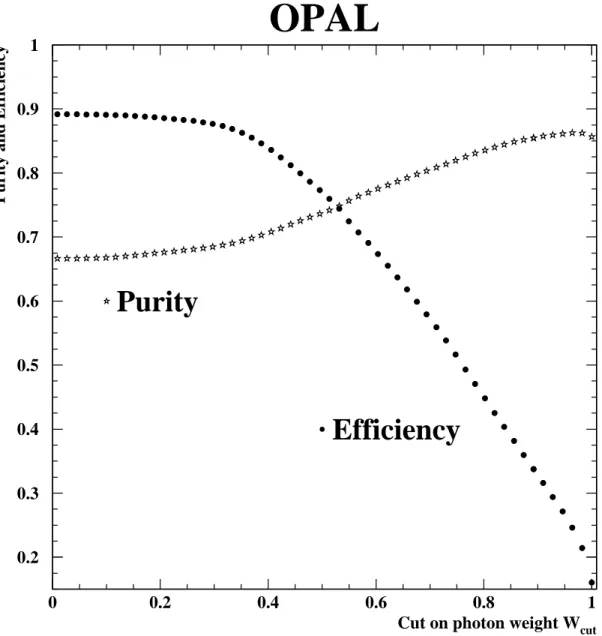
which was calculated for every photon candidate. The five variables were assumed uncorrelated and a likelihood ratio distribution was determined for each variable. The likelihood ratio in each bin was defined as the ratio of the number of generated photons to the total number of photon candidates. The value of W was the product of the five likelihood ratios of the bins Eγ,Eclust, θclust, θtrk and Etrk in which the candidate was found. The discriminating power of W is shown in Figure 4, where the efficiency and purity for photons in Monte Carlo events are shown as a function of a value Wcut.For photon candidates with W >Wcut,the purity was defined as the ratio of the number of generated photons to the total number of reconstructed photons and the efficiency was defined as the fraction of generated photons which were correctly reconstructed.
All possible pairs of photon candidates were then considered. Each pair was assigned a probability P for both candidates being correctly reconstructed photons, the probability being simply the product of the weights W associated to the two candidates:
P = W1×W2, with no cut on W1 or W2. (17) The combinatorial background consisted of a mixture of three components: wrong pairing of two correctly reconstructed photons, pairing of two fake photons and pairing of one correctly reconstructed photon with one fake photon. Choosing only photon pairs with high values of P reduces the combinatorial background to its “wrong pairing of correctly reconstructed photons” component only. It was found that requiring P > 0.1 removed 60% of the total combinatorial background, with a relative loss in efficiency of 8% and 1% for π0 and η signals, respectively. The two-photon invariant mass distribution was studied in intervals of the energy fraction xE= EE2γ
beam.Because most of the true reconstructed photons came from π0 decays, an additional cut was required, in addition to the cut on the probability P, to enhance the η →2γ signal.
This cut excluded, for invariant masses M2γ >300 MeV, any photon that could pair with any other photon to make an invariant mass M2γ <300 MeV with a probability P>0.1.
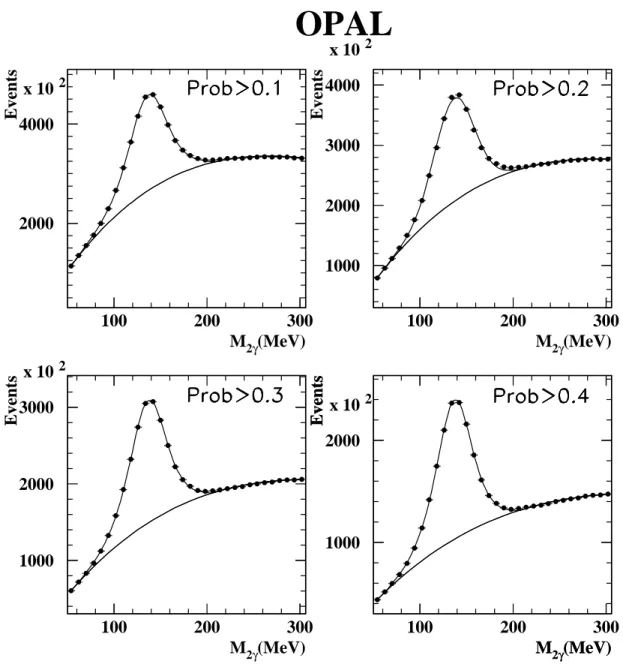
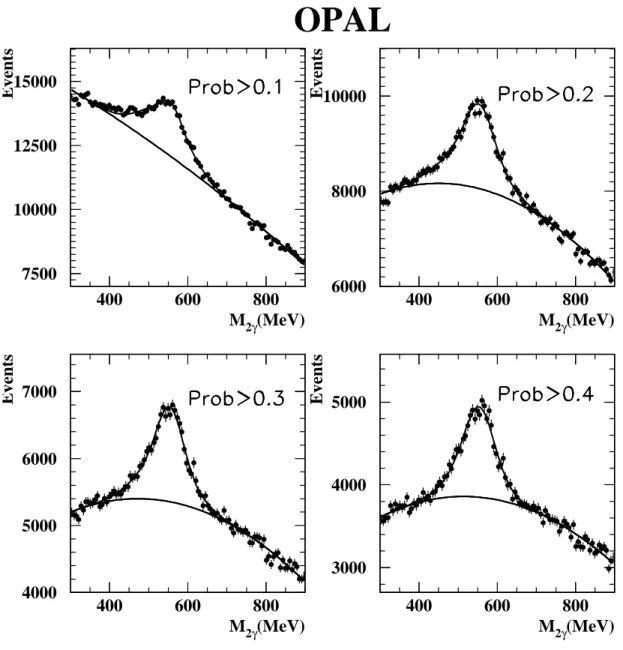
The combinatorial background could be described by a second order polynomial for all cuts on probability P, and for all xE bins. The signal was well described by a double Gaussian. The mass distributions obtained from the data over the full xE
range are shown for four different cuts on the probability P in Figure 5 for π0, and in Figure 6 for η. The absoluteπ0 and η reconstruction efficiencies, for P >0.1 over the entire xE range, were 15.5% and 7% respectively. The efficiency and the signal to background ratio were dependent on the xE interval considered.
5.2 K
0Sreconstruction
The K0S → π+π− reconstruction was similar to the method described in [25]. Here it was applied to the full available Z0 hadronic sample of four million events. A track was considered to be a pion candidate if it had a transverse momentum larger than 150 MeV, had more than 20 hits in the jet chamber and had either more than 3 hits in the Z-chamber or a reconstructed end point in the jet chamber [26]. The invariant mass of pion pairs was evaluated for pairs of oppositely charged tracks having an intersection point in the plane perpendicular to the beam axis and satisfying the following requirements:
1. the distance from the intersection point to the primary vertex had to be greater than 1 cm and less than 150 cm;
2. if the secondary vertex was reconstructed in the jet chamber, it had to be less than 5 cm from the first hit of either track;
3. if the intersection point occurred before the jet chamber, the radial distance from the track to the beam axis at the point of closest approach had to exceed 3 mm;
4. track pairs that passed the above cuts were re-fitted with the constraint that they originated from a common vertex;
5. track pairs that satisfied the photon conversion hypothesis or Λ →pπhypothesis were rejected.
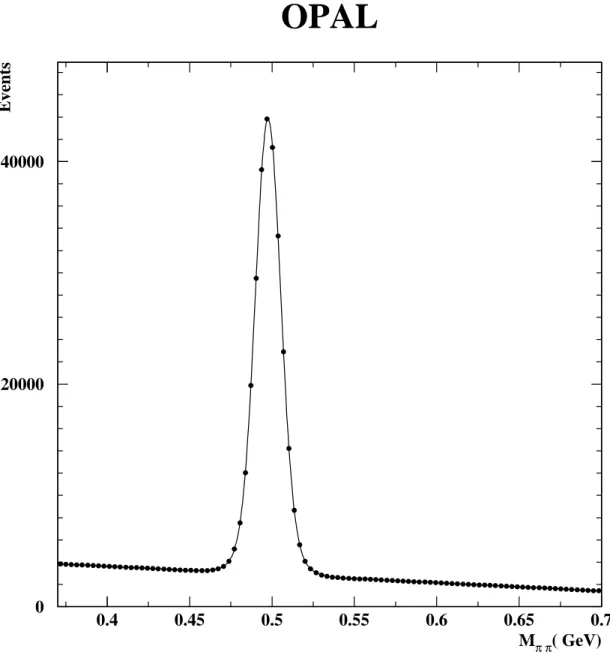
The π+π− invariant mass spectrum is shown in Figure 7 for the whole measured xE
region. The spectrum was studied in xEintervals. In each interval, a double Gaussian shape for the signal and a second order polynomial for the background were used to fit the Mπ+π− spectrum. The K0S reconstruction efficiency was found to be 26% for xE<0.1, reducing to 15% at higher xE.
5.3 Inclusive π
0, η and K
0rates
The inclusive rate measurements were performed on the whole hadronic sample with- out making any 3-jet requirement. For each of the mesons π0, η and K0S, the number of entries remaining after the combinatorial background subtraction was considered as the number of signal entries. This was corrected for detector and reconstruction efficiencies and for the non-measured decay channels using the Particle Data Group branching ratios. The total rates were also corrected for the inaccessible xE regions.
The corrections were performed using extrapolation with the spectral shapes pre- dicted by Jetset. They amounted to 11%, 23% and 0.6% of the total rates for π0, η and K0 respectively. The K0 rate was the K0S rate corrected for the non-observed K0L. The total inclusive measured rates per event were:
hnπ0i= 9.871±0.040(stat)±0.39(syst) hnηi= 1.076±0.090(stat)±0.084(syst) hnK0i= 2.016±0.003(stat)±0.052(syst).
The results are in good agreement with the values previously measured at LEP [25, 27]. The reconstruction method described in Section 5.1 gave an improved photon purity and higher π0 → 2γ and η → 2γ reconstruction efficiencies when compared to [24]. This led to a well controlled combinatorial background in the two-photon invariant mass spectrum. Thus, better systematic uncertainties were obtained. The statistical error on theηinclusive rate was larger than the error quoted in [24] because the π+π−π0 channel was not included in the present analysis. Since the full available Z0 hadronic sample was analysed, the statistical error on the K0 inclusive rate was improved when compared to the value quoted in [25]. However, the new systematic error was slightly larger, due to the inclusion of the systematic error on the Monte Carlo background and signal shapes (Section 5.4 item 1 to 3).
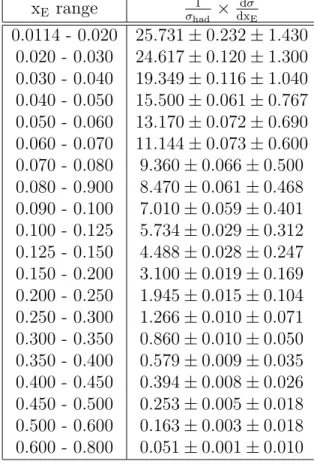
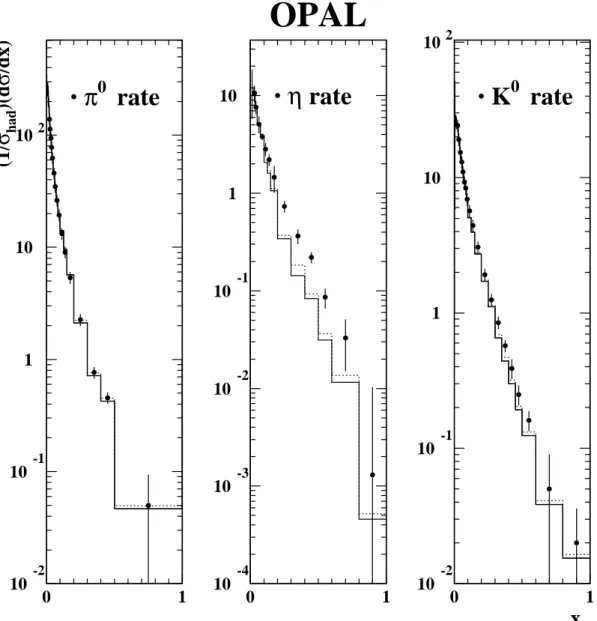
The rate measurement was repeated in xE intervals and the obtained differential rate distributions are shown in Figure 8. The π0 measured differential rate was described well by both Jetset and Herwig Monte Carlo expectations. However, the measured η and K0 spectra were harder than either Monte Carlo prediction. The discrepancy was worst forη,where the measured rate was almost double the predicted rate for xE >0.2. The K0measured rate was only about 15% larger than the predicted rate for xE >0.2.For xE<0.1 the Monte Carlo predicted rates for η and K0 mesons agreed with the measured values within the error bars. These observations were in good agreement with previous OPAL results [24, 25]. The derived values for π0 and η are not meant to supersede the former OPAL results. The new measured K0 differential rates are given in Table 1.
5.4 Systematic errors
For the π0, η and K0 the largest contribution to the systematic error came from the parametrisation of the combinatorial background and the signal shape. This contributed up to 50% of the systematic error for some xE intervals. This error was estimated using the following procedure for each xE interval:
1. The shape of the background was measured from data by fitting a second order polynomial to the non-signal regions of the two-photon invariant mass spectrum.
The procedure was repeated using different side bands.
2. The shape of the background was fixed to the shape predicted by the Monte Carlo and the background was fitted to data allowing only an overall normali- sation factor to vary.
3. The shape of the signal was fixed to the shape predicted by the Monte Carlo and was fitted to data allowing only an overall normalisation factor to vary.
The systematic error was taken to be the quadratic sum of all deviations from the value measured using only data. For the K0 rate, the systematic errors in each xE
interval were estimated using the procedure described in [25] to which was added the contribution from the three items above.
In the case of the η, the combinatorial background was found to have a small structure at M2γ ≃ 700 MeV in the Monte Carlo which was not seen in the data.
This structure was caused by ω(780)→ π0γ → 3γ for which the rate in the OPAL- tuned Monte Carlo was twice the measured rate. To estimate the systematic error the above procedure was repeated by:
1. fitting the background shape outside the signal and the small structure regions;
2. removing from the Monte Carlo 50% of the generated ω(780) → 3γ, in which case the structure disappeared.
For both the π0 and theη all the following systematic variations were considered:
1. The systematic error relative to the cut on the probability P associated with each photon pair was estimated by repeating the measurements for each xE bin with different cuts on P > 0.2, P >0.3 and P > 0.4, the original value being obtained with P > 0.1. This error, which took into account signal purity and reconstruction efficiency, since they depend on P, was added quadratically to the previous error. In the worst case it contributed 14% to the total systematic error.
2. The difference between the correction factors for detector effects obtained with Jetset and those obtained with Herwig was considered as a systematic error. It was found to contribute up to 12% of the total systematic error.
3. The error due to the energy calibration of the electromagnetic calorimeter was estimated from Monte Carlo by shifting up and down the energy of measured electromagnetic clusters by 2%. This had a negligible effect on the number of reconstructed photon candidates. However, the position of the peaks of the π0 and η signals were shifted by about 10 MeV, and the difference in the signal extracted in each xE bin was considered as a systematic error. In the worst case, this contributed 8% to the total systematic error.
4. Some of the mesons, mainly π0, were produced in interactions with detector material. This effect might not have been very well modelled in the Monte Carlo.
Therefore, half of the Monte Carlo prediction for these mesons was included in the uncertainty. This accounted for up to 25% of the total systematic error, the worst being in the low xE intervals.
5. An alternative extrapolation scheme as in [24] was used to correct for the inac- cessible xE regions. This yielded slightly different corrections and these differ- ences were included in the systematic error.
6 π
0, η and K
0production in quark and gluon jets
The π0, η and K0 yields in quark and gluon jets were estimated as a function of the scale Qjet. The average number of mesons produced in the second jet and third jet samples was measured as a function of Qjet, and then the unfolding to 100% quark and gluon jet purities was performed in the same way as was done for charged particles.
Each π0, η and K0 candidate was assigned to the jet which made the smallest opening angle with respect to the total momentum direction of the meson. Theπ0, η and K0 signals were then extracted as in the case of the inclusive rate measurement (see Section 5). To make the jets fully comparable, and because photons were re- constructed only in the barrel region of the electromagnetic calorimeter, only events that had both the second and third jet in the barrel were kept. The Qjet interval
was divided into three bins: Qjet = 7 to 13, 13 to 19 and 19 to 25 GeV. The average number of mesons per jet, in each Qjet interval, was corrected for detector acceptance, reconstruction efficiency and for inaccessible xE regions. Efficiencies were calculated separately for each jet as a function of Qjet. Using the average purity of each bin of Qjet evaluated from data using the matrix element formula, the average number of mesons per jet was unfolded to 100% quark and gluon jet purities.
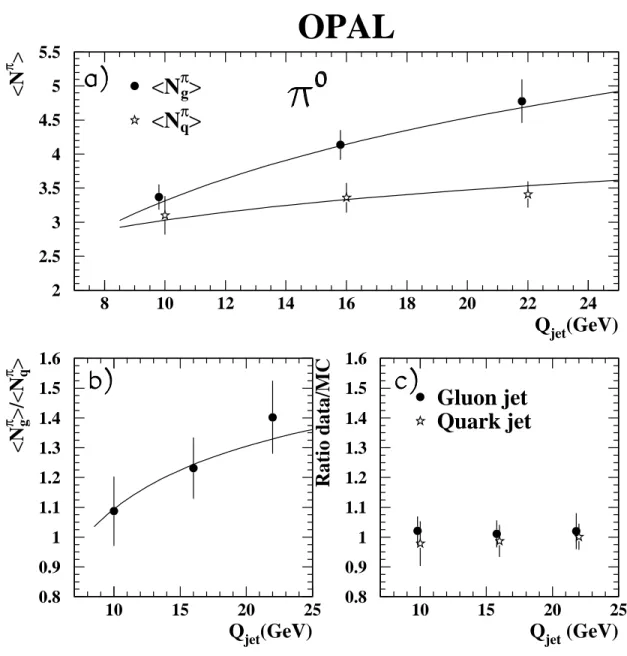
6.1 π
0production
The average number of π0 produced per jet as a function of Qjet is shown in Figure 9a for gluon and quark jets. The ratio of multiplicities in gluon and quark jets is shown in Figure 9b. The Jetset and Herwig models were found to reproduce the data within the error bars. This is demonstrated in Figure 9c where the ratios of data to Monte Carlo are compatible with unity for both quark and gluon jets in each interval of Qjet.The analytical function obtained for the average charged particle multiplicity as a function of Qjet, scaled with only one free overall normalisation factor (measured to be 0.47), were found to fit well to the rate of π0 as a function of Qjet in gluon and quark jets, and to the ratio betweenπ0 production rates in gluon and quark jets. The function is shown in Figures 9a and 9b.
6.2 η production
The same analytical function, but with an overall normalisation factor of 0.047, was found to describe the η rate in gluon and quark jets, as shown in Figure 10a. The ratio ofηmultiplicities in gluon and quark jets as a function of Qjet is shown in Figure 10b, and was compatible with the ratio of charged particle multiplicities. The ratio was also compatible with being independent of Qjet, with
hNηgi
hNηqi = 1.29±0.14.
The measuredηrate was found to be slightly higher in the data than in the Monte Carlo, mainly at low Qjet. This small disagreement was the same for both quark and gluon jets, as shown in Figure 10c, where the ratios of data to Monte Carlo for gluon and quark jets are shown. This indicates that modelling of production of η is equally inadequate for both Jetset and Herwig Monte Carlos. No additional enhancement of η production in gluon jets was observed.
Figure 8 indicates that the measuredηspectrum was harder than the Monte Carlo prediction. To investigate this, the analysis was repeated for xE ≥0.1 for bothπ0 and η mesons. Due to statistical limitations, mainly in the η meson sample, a yet harder cut on xEwas not appropriate. The resulting π0 production rates as a function of the scale Qjet for the gluon and the quark jets were in good agreement with both Jetset and Herwig expectations. In each bin of Qjet, the ratio of data to Monte Carlo for the η rate was equal for quark and gluon jets. The ratio of theη production rates in data to those predicted by the Monte Carlo were found to be the same for both the quark and gluon jets. The ratio of the production rate of η in gluon jets to that in quark
jets was also found to be consistent with being independent of Qjet. The measured ratio was:
hNηg(xE>0.1)i
hNηq(xE>0.1)i = 1.38±0.19.
This result is not in contradiction with previously published results [6] concerning an excess of high momentum η mesons over Monte Carlo prediction. The excess is present equally in quark and gluon jets.
6.3 K
0production
An overall scale factor of 0.093 in the analytical function of Section 4 gave the best fit to the K0 production rate in quark and gluon jets. However, as shown in Figure 11a, the data for the quark jet were systematically but not significantly, higher than the corresponding analytical shape. This is also shown in Figure 11b where the ratio of K0 production in gluon and quark jets was systematically smaller than the cor- responding ratio for charged particle production, although compatible within errors.
This effect could be explained by a higher probability of producing a strange meson in the fragmentation of an initial strange, charmed or b quark.
The ratios data to Monte carlo of the K0 production rate in gluon and quark jets are shown in Figure 11c. The ratios are compatible with unity within errors and agree with the previous OPAL result [5].
6.4 Systematic errors
The measurements of the production rates ofπ0, ηand K0 in jets were not statistically limited. The errors shown in Figures 9, 10 and 11 already include both the systematic and statistical errors added in quadrature and propagated through the unfolding formula. The systematic error ranged from 60% to 90% of the total quoted error, depending on the data point. It was estimated for each jet and each Qjetinterval using the procedure described in Section 6 for π0, η and K0 inclusive rate measurements.
In each Qjet interval, the selection criteria (see Section 5) for π0, η and K0 mesons were found to act equally on quark and gluon jets. The results were very stable against changes of the selection cuts that caused relative reconstruction efficiency variation of up to 5%. For the η case, the additional cut (Section 5.1) that excluded for invariant masses M2γ > 300 MeV, any photon that could pair with any other photon to make an invariant mass M2γ <300 MeV with a probability P > 0.1, was changed: first M2γ < 300 MeV was moved to M2γ < 200 MeV and second P > 0.1 was replaced by P >0.2.The effect on the η measured rates in quark and gluon jets was negligible(<1%). In addition, for all studied mesons:
1. The difference between the measurements with purities taken from the matrix element formula and from Monte Carlo(see Section 3) was negligible. The aver- age jet topologies and purities were varied by changing the cut on the variable Y (see Section 2.3) such that the purities obtained with the matrix element formula still agreed with those obtained from Monte Carlo information. The analysis was repeated with Y ≤0.25 and the differences obtained in each bin of Qjet were considered as systematic errors and were found to contribute at most 5% of the total quadratic sum.
2. Since the mesons were reconstructed independently of the jet-finding, and were assigned to jets by angular matching once the jets were reconstructed, very little dependence on the jet finder was expected. Indeed, this was the case for Luclus and Durham jet finders where the difference was measured to be less than 2%.
However, the results obtained with the cone jet finder showed deviations of up to 10% with respect to the two other jet finders. This was considered as a systematic error, and contributed up to 47% of the total quadratic sum of the systematic errors.
3. The results were found to be stable in each bin of Qjet with respect to changes of the charged particle selection requirements. The results were also found to be stable when the number of charged particles required per jet was increased from 3 to 5. Lowering the cut on the inter-jet angle from 30 to 20◦ was correlated to the cut on the variable Y. The analysis was repeated with the minimum inter- jet angle set to 20◦ and the minimum value of Y set to 0.22. The maximum deviation obtained was less than 2% and was added to the total systematic error.
4. Due to statistical limitations, the analysis could not be repeated on data using b-tagging to obtain gluon enriched jet samples. A systematic error, that could account for correlations between particle content in pure quark and pure gluon jets as well as for the stability of the unfolding method, was assigned using the following procedure: The analysis was repeated on four different Jetset Monte Carlo samples, each sample being as large as the full available data sample.
The jet samples were selected to have different gluon and quark average puri- ties. The purities were set based on Monte Carlo information (Section 3.2) to be: (40% quark,60% gluon),(25% quark,75% gluon),(60% quark,40% gluon), (75% quark,25% gluon) for the four pairs of jet samples that were processed with the unfolding method. The largest deviation with respect to the average unfolded meson rate was considered as a systematic error. This contributed up to 7% of the systematic error, indicating that the unfolding procedure was indeed stable against large purity variations.
7 Summary and conclusion
Average multiplicities of π0, η, K0 and charged particles have been measured for gluon and quark jets as a function of a transverse momentum-like scale Qjet. The average multiplicities were unfolded to 100% purity by comparing two jet samples having different gluon (or quark) content for the same value of Qjet. The π0, η and K0 inclusive production rates in Z0 hadronic decays were measured and found to agree with the previous values measured at LEP. The π0 production rate was found to be well described by both Jetset and Herwig Monte Carlos for all values of xE. Theηand K0 spectra were found to be harder than the Monte Carlo predictions, particularly in the case of η.
The charged particle multiplicity as a function of the topological scale Qjet for pure quark and pure gluon jets was described by a simple phenomenological formula. The same formula, with all parameters fixed except for an overall normalisation factor,