• Keine Ergebnisse gefunden

Contents of this file

N/A
N/A
Protected

Academic year: 2022

Aktie "Contents of this file"

Copied!
4
0
0

Wird geladen.... (Jetzt Volltext ansehen)

Volltext

(1)

[Journal of Geophysical Research: Atmospheres]

Supporting Information for

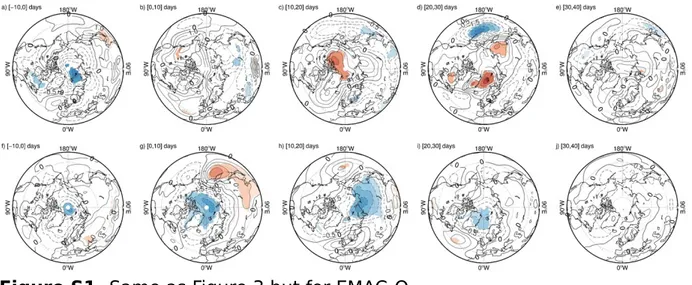
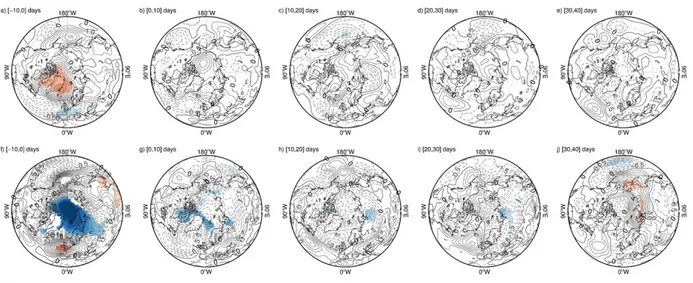
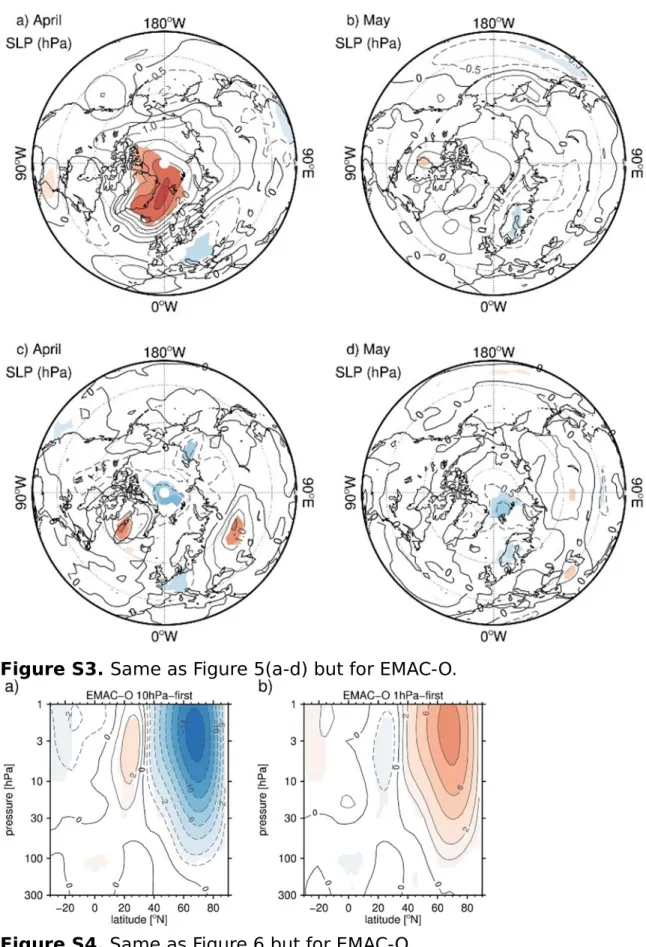
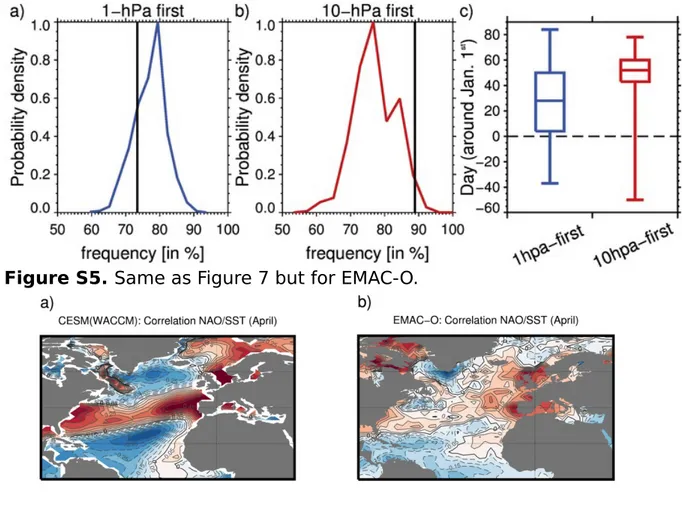
Drivers and surface signal of inter-annual variability of boreal stratospheric final warmings

R. Thiéblemont

1

, B. Ayarzagüena

2,3

, K. Matthes

4,5

, S. Bekki

6

, J. Abalichin

7

, and U. Langematz

7

1Laboratoire des Sciences du Climat et de l'Environnement (LSCE), CNRS, Saint-Aubin, France.

2Universidad Complutense de Madrid (UCM), Madrid, Spain. 3Instituto de Geociencias, CSIC- UCM, Madrid, Spain. 4GEOMAR-Helmholtz Centre for Ocean Research, Kiel, Germany. 5Christian- Albrechts-Universität zu Kiel (CAU), Kiel, Germany. 6Laboratoire Atmosphères, Milieux, Observations Spatiales (LATMOS), CNRS, Guyancourt, France. 7Freie Universität Berlin (FUB), Berlin, Germany.

Contents of this file Figures S1 to S6 Introduction

Supporting material repeats CESM1(WACCM) composite analysis presented in the main manuscript but for ERA-Interim reanalyses and EMAC-O multi- decadal simulation (140 years).

Figure S1. Same as Figure 3 but for EMAC-O.

1

(2)

Figure S2. Same as Figure 3 but for ERA-Interim

2

(3)

Figure S3. Same as Figure 5(a-d) but for EMAC-O.

Figure S4. Same as Figure 6 but for EMAC-O.

3

(4)

Figure S5. Same as Figure 7 but for EMAC-O.

Figure S6. Correlation coefficient pattern between the NAO index in April and the North Atlantic SST field for (a) CESM(WACCM) and (b) EMAC-O.

4

Abbildung

Figure S1. Same as Figure 3 but for EMAC-O.
Figure S2. Same as Figure 3 but for ERA-Interim
Figure S3. Same as Figure 5(a-d) but for EMAC-O.
Figure S5. Same as Figure 7 but for EMAC-O.

Referenzen

ÄHNLICHE DOKUMENTE

In black the relationship that was generated from the from first arrivals of borehole geophones from the ZOVSP (Krauß, 2018) and in orange the adjusted time-depth relation based

In Table S1, we compiled a complete list of the results of the laboratory seismic measurements for 16 core samples from the COSC-1 borehole.. Complete sample list with results

Ratio of ERA-Interim to observed precipitation rates as a function of latent heat fluxes, derived from ERA-Interim air pressure, air temperature, humidity, SST, and

In order to account for spurious trend resulting from numerical drift, a linear trend was fitted to NBUC transports from a corresponding climatological experiment

(a) Maximum correlations between EKE and regionally-averaged total wind stress (blue line), zonally-averaged total wind stress (red line), and the Southern Annular Mode (SAM)

The Supporting Figures and Table provide additional data from the Kiel Climate Model simulation used in the main text. References cited in the Supporting Figure captions are listed

Depending on the current settings, pressing the power button wakes the printer from sleep mode.. &“Touch Screen Operations” on

To test the significance of the regression patterns AR(1) processes were fitted to the time series and the correlations were calculated. 2 shows the associated pat- tern of the