Journal of Geophysical Research: Solid Earth Supporting Information for
Does retrogression always account for the large volume of submarine megaslides? Evidence from the Tampen Slide, offshore
Norway
R.S. Barrett1, B. Bellwald2, P.J. Talling3, A. Micallef4,5, F. Gross1,6, C. Berndt5, S. Planke2,7, R. Myklebust8, and S. Krastel1
1Institute of Geosciences, Christian-Albrechts-University, Kiel, Germany.
2Volcanic Basin Petroleum Research AS, Oslo, Norway.
3Departments of Earth Sciences and Geography, Durham University, Durham, UK.
4Marine Geology & Seafloor Surveying, Department of Geosciences, University of Malta, Msida, Malta.
5GEOMAR Helmholtz Centre for Ocean Research Kiel, Germany.
6Center for Ocean and Society, Kiel Marine Science, Christian-Albrechts-University, Kiel, Germany.
7Centre for Earth Evolution and Dynamics, University of Oslo, Oslo, Norway.
8TGS, Asker, Norway.
Contents of this file
Figures S1 to S6Introduction
This supporting information includes uninterpreted versions of the seismic profiles shown in Figures 5-10 of the manuscript, as well as the interpreted seismic profiles and maximum amplitude maps included in the manuscript.
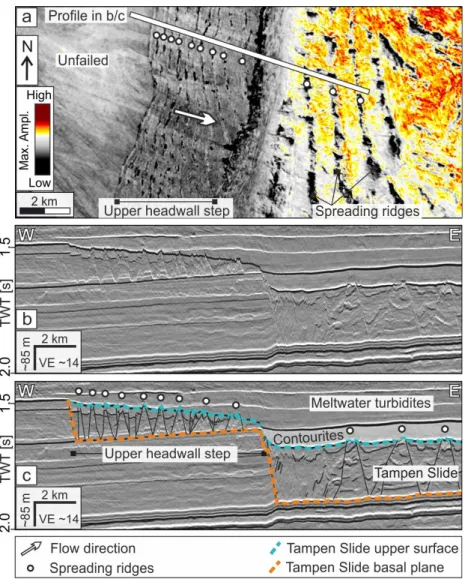
Figure S2. Extensional ridges (spreading) along the upper headwall step and along the western sidewall of the Tampen Slide. (a) Maximum amplitude of the Tampen Slide’s upper surface, and (b, c) seismic profile highlighting the character of the spreading ridges. Location of this figure is shown in Figure 3. VE: Vertical Exaggeration. Relates to Figure 6 in the manuscript. Data from AMS17 Vol. B, and courtesy of TGS.
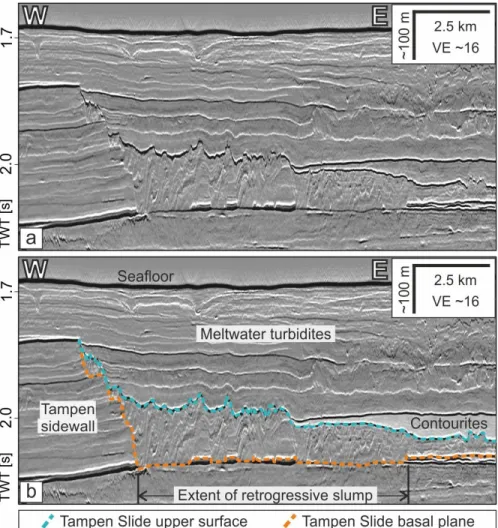
Figure S4. (a, b) Seismic profile crossing a small volume (~12 km3), retrogressive slump on the western sidewall of the Tampen Slide. Location of this figure is shown in Figure 3.
VE: Vertical Exaggeration. Relates to Figure 8 in the manuscript. Data from AMS17 Vol.
B, and courtesy of TGS.
Figure S5. The ~36 km3 retrogressive debris flow on the eastern headwall of the Tampen Slide. (a) Maximum amplitude of the Tampen Slide’s upper surface, and (b, c) seismic profile highlighting the character of the compressional ridges at the toe of this failure. Location of this figure is shown in Figure 3. VE: Vertical Exaggeration. Relates to Figure 9 in the manuscript. Amplitude data from AMS17 Vol. B, and seismic profile from AMS17 Vol. A. Data courtesy of TGS.
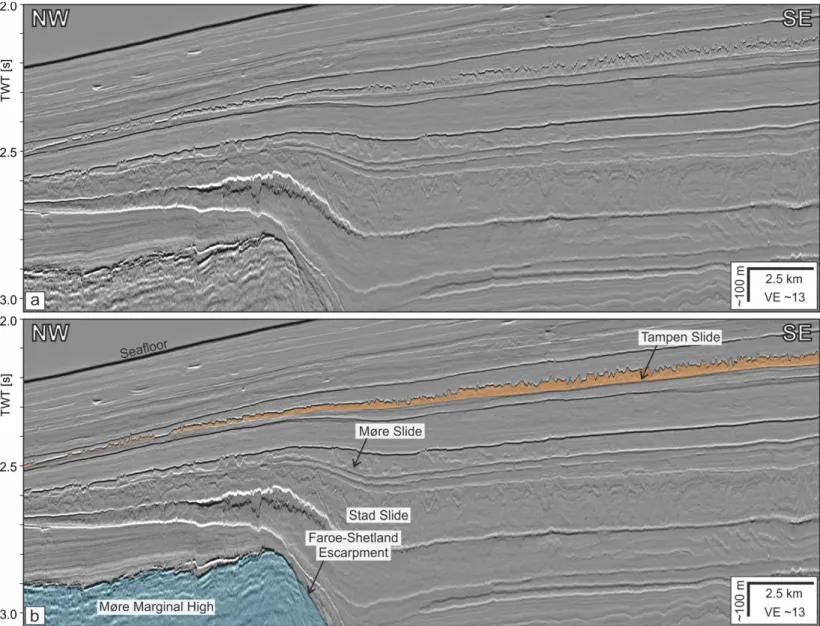
Figure S6. (a, b) Seismic profile crossing the Faroe-Shetland Escarpment (FSE).
Location shown in Figure 10. VE: Vertical Exaggeration. Relates to Figure 10 in the manuscript. Seismic profile from AMS17 Vol. A. Data courtesy of TGS.