Global Biogeochemical Cycles Supporting Information for
Sargassum sp. act as a Large Regional Source of Marine Dissolved Organic Carbon and Polyphenols
Leanne C. Powers1*†, Norbert Hertkorn2†, Natasha McDonald3,4, Philippe Schmitt-Kopplin2,5, Rossana Del Vecchio6, Neil V. Blough7, and Michael
Gonsior1*
1 University of Maryland Center for Environmental Science, Chesapeake Biological Laboratory, Solomons, MD, 20688 USA
2 Helmholtz Zentrum Muenchen - German Research Center for Environmental Health, Research Unit Analytical BioGeoChemistry, D-85764 Neuherberg, Germany
3 Bermuda Institute of Ocean Sciences, 17 Biological Station, St. George’s GE 01, Bermuda
4 GEOMAR Helmholtz Centre for Ocean Research, Wischhofstr. 1-3, 24148 Kiel, Germany
5 Technische Universität München, Chair of Analytical Food Chemistry, D-85354 Freising-12 Weihenstephan, Germany
6 University of Maryland, Earth System Science Interdisciplinary Center, College Park, MD, 20742 USA
7 University of Maryland, Department of Chemistry and Biochemistry, College Park, MD, 20742 USA
Contents of this file Text S1 to S2 Figures S1 to S13 1
2
1 2 3 45 67 8
9 10 11 12 13 14 15 16 17 18 19 20 21 22
23 24 25 2627 2829
Introduction
Supporting information includes additional details on the characterization of Sargassum SPE-DOM via FT-ICR MS (Text S1) and NMR spectroscopy (Text S2).
Text S1. Additional Details on Sargassum SPE-DOM composition analyzed by FT- ICR MS
A number of methods exist to extract compounds from dried brown algae (Isaza Martínez
& Torres Castañeda, 2013; Wijesinghe & Jeon, 2012). More specifically, a suite of isolation and purification techniques exist to analyze phlorotannins, typically by
chromatographic methods like high pressure liquid chromatography-mass spectrometry (LC-MS) (Isaza Martínez & Torres Castañeda, 2013). Mass spectrometry has also been used for the structural analysis of other common compounds isolated from brown algae.
For example, a diverse class of sulfated polysaccharides (fucoidans) and a number of terpenoids have been extracted from various brown algae and characterized (Blunt et al., 2006; Li et al., 2008). Previous work has found that dried Sargassum fluitans contained 45% alginate (Fourest & Volesky, 1996), a major component of their cell walls. The carbohydrate fraction was 6 to 12% of the DOC exuded from kelp during growth stages and increased to 34 to 64% during the rest of the year whereas the phenolic fraction was 10 to 20% of the released DOC during growth stages and 6 to 10% during the rest of the year (Abdullah & Fredriksen, 2004). However, data on specific classes of compounds actively released by living Sargassum have not been investigated to date.
In both positive and negative ionization modes, a small number of formula were unique to exudation experiments performed in either indoor or outdoor tanks (negative mode van Krevelen diagrams shown in Figure S3B), but the majority of assigned formula were common between all incubations (Figure S3B). Intensity weighted (wt) average
molecular characteristics were not different within ± 1 standard deviation between indoor and outdoor incubations. In positive ESI ionization mode, CHNO formulas were most abundant (51% of assigned peaks), followed by CHO formulas (46%), with minor contributions of CHOS, CHNOS, and CHOBr formulas (~1% each). The greater
contribution of nitrogen containing formulas is likely due to their preferential ionization in ESI positive mode (Kujawinski et al., 2004). Nonetheless, positive mode formula assignments were similar to those determined previously for marine DOM (Hertkorn et al., 2013). Both CHO and CHNO formulas extended into regions of less oxygenation in van Krevelen space (average O/Cwt around 0.3 to 0.4) when compared to ESI negative mode formula assignments (Figure 2B). A number of metabolites, such as monoterpenes or loliolide derivatives, terpenoids, and fucoxanthin (a major brown algae carotenoid), have been extracted and identified in brown algae (Haugan & Liaaen-Jensen, 1994;
Kimura & Maki, 2002; Reddy et al., 2008; Sugawara et al., 2006). These metabolites generally have a low oxygen content and high saturation, with known compounds having O/C and H/C ratios around 0.2 and 1.5, respectively. ESI positive mode CHNO formula 32
33 34 35 36 37 38 39 40 41 42 43 44 45 46 47 48 49 50 51 52 53 54 55 56 57 58 59 60 61 62 63 64 65 66 67 68 69 70 71 72 73
had high diversity in the KMD/z* plot (not shown), which has been observed previously in algal bloom DOM analyzed in ESI negative mode (Zhang et al., 2014). The authors noted that these nominal insertions or deletions of CH2 can occur easily in peptides with amino acid variations.
Text S2. Additional Details on Sargassum SPE-DOM composition analyzed by NMR Phlorotannins are main exudates of brown algae and carry a characteristic 1,3,5-trioxo- aromatic substitution produced by rearrangement of triketide rings, formed by the acetate-malonate pathway. Derivatives of the basic unit phloroglucinol (C6H6O3) comprise ~700 often bioactive natural products (Singh et al., 2010) of which ~150 are phlorotannins of different size and oxygenation resulting from nominal condensation of phloroglucinol units (Isaza Martínez & Torres Castañeda, 2013). Remarkably, the three- fold 1,3,5-symmetry of oxygen substitution is retained in virtually all of them. Smaller size phlorotannins are classified according to their coupling modes, namely Car-Car
(biaryl, fucols, resulting from oxidative coupling of two C● radicals) or Car-O-Car
(arylether, phlorethols; resulting from oxidative coupling of one O● and one C● radical (Isaza Martínez & Torres Castañeda, 2013; Vershinin et al., 2017). Larger size
phlorotannins divide into linear (two linkages) and branched (three linkages) and show multiple and mixed interphloroglucinol linkages, leading to further classification into other established groups of fuhlols, eckols and fucophlorethols (Isaza Martínez & Torres Castañeda, 2013). Key substructures include furans resulting from condensation of C-C- bound hydroxylated aromatics and 1,4-dioxines resulting from condensation of
hydroxylated aryl ethers.
The combined electron-donating resonance effects of two ortho- and one para oxygen substituents in 1,3,5-trioxo-phlorotannins produce NMR chemical shifts H/C (Van Altena &
Steinberg, 1992; Steevensz et al., 2012; Stiger-Pouvreau et al., 2014; Yotsu-Yamashita et al., 2013) that are normally attributed to either olefinic protons (=CH; H ~ 5.8-6.1 ppm) or anomeric positions in carbohydrates (O2CH; C ~ 90-100 ppm) but not to benzene derivatives. Further functionalization (oxygenation and carboxylation) of 1,3,5-trioxoaromatics produces comparatively weaker inductive substituent effects leading to limited downfield displacements of H/C for remaining positions (Perdue et al., 2007). Considerable hydrogen deficiency occurs in all larger-size phlorotannins because at least four aromatic positions have to be occupied by non-hydrogen substituents; further oxidation will replace hydrogen by hydroxyl groups (Kuhnert et al., 2010) leading to aromatic rings with five or even six oxygen substituents.
Hence, extensive polymerization and oxidation reduce the count of non-exchangeable protons and make detection of evolved phlorotannins by 1H NMR spectroscopy eventually impractical.
We have obtained the Sargassum exudates under realistic outdoor conditions comprising
5
6 74 75 76 77 78 79 80 81 82 83 84 85 86 87 88 89 90 91 92 93 94 95 96 97 98 99 100 101 102 103 104 105 106 107 108 109 110 111 112 113 114 115
(abundant), peptides (clearly discernible but not prominent; Figure S7) and carbohydrates (abundant and molecularly diverse; Figure S7, S8) in the aliphatic section (Figure S7). In addition, Sargassum extracts showed a fairly well developed NOM signature comprised of CRAM (carboxyl-rich alicyclic compounds) (Hertkorn et al., 2006), oxygenation products of carotenoids (Arakawa et al., 2017) and other OC2CH-units (Figure S8).
Overall, the presence of classical aromatic molecules (NOM-type and natural products) and phlorotannins (Figure S9) resulted in an unusually high abundance of aromatic molecules in Sargassum extract when compared with that of common aquatic and marine organic matter including surface Sargasso Sea SPE-DOM (Table S2).
Individual Sargassum extracts showed considerable variance of composition (Table S2, S3) for all functionalities, reflecting a complex temporal evolution of a multi-organism mini ecosystem under experimental conditions. However, differences in NMR spectra of individual samples 394-396 rather referred to changes in relative NMR resonance
amplitude than positioning of main NMR resonances, indicating abundance variations of common molecules rather than fundamental changes in chemical structures present. Two conspicuous alterations deserve mentioning. At first, phlorotannins were very abundant in sample “395”, suggesting a capacity of Sargassum to even double the exudation of phlorotannins compared with that found in the consolidated (pooled) sample (Table S2, S3; Figure S6). Second, a certain group of aliphatic esters (-CO-(O=C)-CH2-Calkyl, probably microbially-derived lipid-like compounds with >15 very closely spaced NMR resonances and convoluted cross peaks at H/C: ~3.67 / ~62.5; ~3.64 / 71.6 (HMBC cross peak to C ~174.6 ppm; Figure S10; ~3.56 / ~73.9 ppm) had been produced in the order 394 >> 396 >> 395. Remarkably, high abundance of phlorotannins went along with low proportions of these esters and vice versa. These opposing trends might result from inhibition of metabolic activity within the foodweb living with Sargassum by biocidal effects of exudated phlorotannins.
In summary however, the concordance of 1H NMR resonances indicated variance in relative abundance of certain molecules rather than presence of divergent molecules in individual Sargassum exudates; hence, pooling of the three individual samples 394-396 was warranted to obtain high-quality 2D (Figure S7-S10, S12) and 13C NMR spectra (Figure S11). These were indispensable for characterization for Sargassum-derived phlorotannins which were particularly rich in quaternary carbon atoms.
The increased spectral dispersion of 1H, 13C HSQC NMR spectra (Figure S9) was used to constrain the relative proportions of phlorotannin-related methine carbon units in the
“phlorotannin-section” of one-dimensional 1H and 13C NMR spectra. This approach could resolve the relative proportions of anomeric O2CH groups and =Csp2H groups from C: 90-107 ppm, and the relative proportions of conjugated and alkylated olefins and aromatic =Csp2H units from H: 5.8-6.5 ppm and provided more accurate assessment of the phlorotannin contents in Sargassum extracts (Tables S3 and S4; Figure S9, S12).
1H NMR spectra indicated that open ocean Sargasso Sea water showed larger contents of pure (42% vs. 29% CCCH units) and functionalized (27% vs. 21% OCCH units)
aliphatic groups but contained much less oxygenated (26% vs. 42% OCH units) and unsaturated (5% vs. 9% =CH units) protons than consolidated Sargassum extract. 13C NMR spectra demonstrated far more methylene carbon (54% vs. 29%) at the expense of 120
121 122 123 124 125 126 127 128 129 130 131 132 133 134 135 136 137 138 139 140 141 142 143 144 145 146 147 148 149 150 151 152 153 154 155 156 157 158 159 160 161 162 163 164
some methyl groups (26% vs. 31%), and considerably less methine carbon (20% vs.
39%) of consolidated Sargassum extract compared with open Sargasso Sea surface ocean SPE-DOM (Hertkorn et al., 2013). This implies lower extent of aliphatic branching, in line with the low proportions of C3CH-units observed in Sargassum extracts (25% vs.
46%) when compared with those present in open Sargasso Sea surface ocean SPE-DOM.
These characteristics indicate that Sargassum extract still features a sizable and
recognizable biochemical component and is therefore chemically less evolved than the more fully evolved biogeochemical open ocean Sargasso Sea water SPE-DOM.
9
10 165 166 167 168 169 170 171 172 173
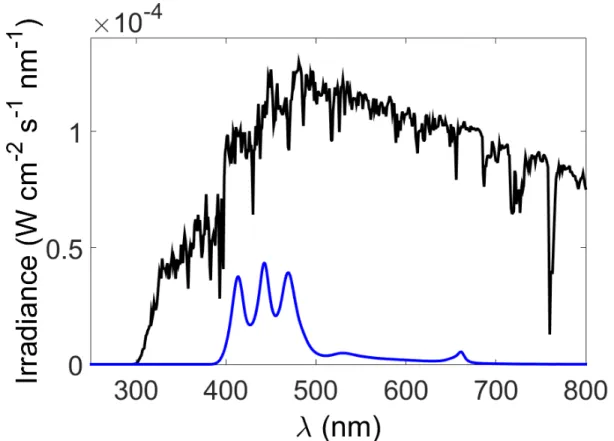
Figure S1. Irradiance (W cm-2 s-1 nm-1) measured using an Optronic Laboratory 756 spectroradiometer for the two light sources used for Sargassum exudation experiments.
The blue line is an irradiance spectrum from a Radion LED lamps (Eco Tech Marine) measured at the height Sargassum sat in the tank and the black line is a typical irradiance spectrum of natural sunlight reaching the earth’s surface at solar noon and 32°N in late summer.
174175 176 177 178 179 180 181
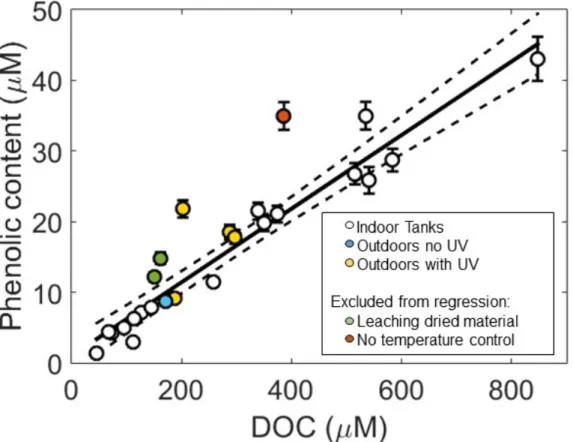
Figure S2. Phenolic content (expressed as µM phloroglucinol equivalents) determined using the Folin-Ciocalteu reagent versus dissolved organic carbon (DOC) concentration (µM) determined in solid phase extracted (SPE)-DOM samples collected from all tank incubations (white circles are indoor tanks, yellow circles are uncovered outdoor tanks and the blue circle is an outdoor tank with a Plexiglas cover). Green circles are data from dried Sargassum leaching experiments and the red circle is data from a tank that reached 49 °C, and are therefore excluded from both regressions (Phenolic content vs. DOC - solid black line and 95% confidence intervals – dashed lines).
13
14
182183 184 185 186 187 188 189 190
Figure S3. (A) Negative electrospray FT-ICR mass spectra of Sargassum DOM from m/z = 200 to 800 for typical indoor (black, left) and outdoor (orange, right) experiments.
Inset figure in (A, right) is for nominal mass m/z 389, corresponding to matching molecular formula assignments based on (Herzsprung et al., 2016). (B) van Krevelen diagrams for CHO formula assigned to samples analyzed in negative ionization mode, highlighting assignments unique to indoor tanks (averaged, n = 6), those unique to outdoor tanks (averaged, n = 4), and those common between indoor and outdoor experiments.
191192 193 194 195 196 197 198 199 200 201
17
18
Figure S4. (A-C) van Krevelen diagrams for formula assignments made to average positive electrospray FT-ICR mass spectrum of Sargassum DOM: (A) CHO formulas (blue), (B) CHNO formulas (orange), and (C) CHOS and CHOBr formulas. (D) CHO formula assignments unique to positive ionization mode (grey squares), those unique to negative ionization mode (light blue circles), and those found between both electrospray ionization modes (black circles).
Figure S5. 1H NMR spectra (800 MHz, CD3OD) of consolidated Sargassum extract, with putative section of phlorotannins indicated (green shade; cf. text).
203 204 205 206 207 208 209 210 211 212 213
214215 216 217
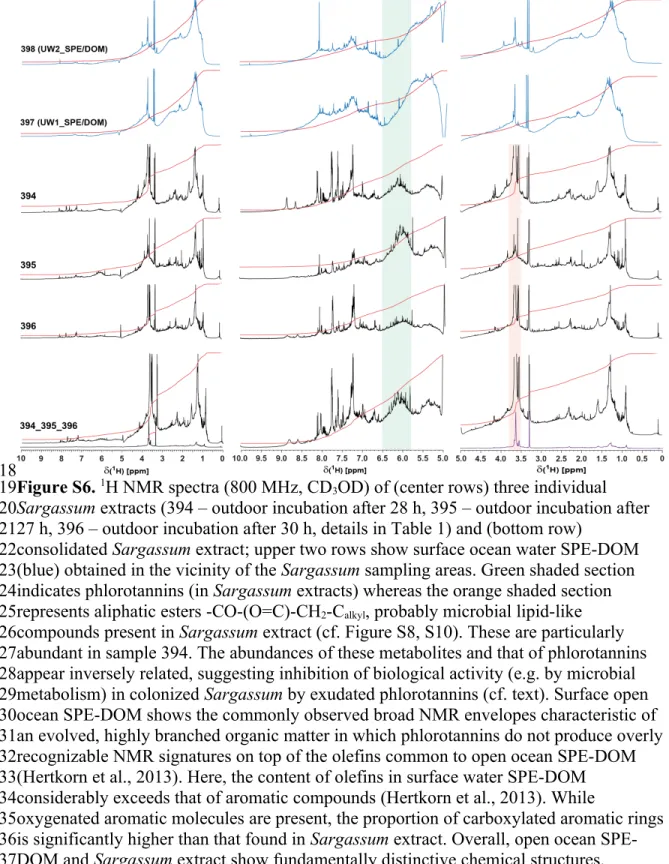
Figure S6. 1H NMR spectra (800 MHz, CD3OD) of (center rows) three individual Sargassum extracts (394 – outdoor incubation after 28 h, 395 – outdoor incubation after 27 h, 396 – outdoor incubation after 30 h, details in Table 1) and (bottom row)
consolidated Sargassum extract; upper two rows show surface ocean water SPE-DOM (blue) obtained in the vicinity of the Sargassum sampling areas. Green shaded section indicates phlorotannins (in Sargassum extracts) whereas the orange shaded section represents aliphatic esters -CO-(O=C)-CH2-Calkyl, probably microbial lipid-like compounds present in Sargassum extract (cf. Figure S8, S10). These are particularly abundant in sample 394. The abundances of these metabolites and that of phlorotannins appear inversely related, suggesting inhibition of biological activity (e.g. by microbial metabolism) in colonized Sargassum by exudated phlorotannins (cf. text). Surface open ocean SPE-DOM shows the commonly observed broad NMR envelopes characteristic of an evolved, highly branched organic matter in which phlorotannins do not produce overly recognizable NMR signatures on top of the olefins common to open ocean SPE-DOM (Hertkorn et al., 2013). Here, the content of olefins in surface water SPE-DOM considerably exceeds that of aromatic compounds (Hertkorn et al., 2013). While
oxygenated aromatic molecules are present, the proportion of carboxylated aromatic rings is significantly higher than that found in Sargassum extract. Overall, open ocean SPE- DOM and Sargassum extract show fundamentally distinctive chemical structures.
21
22
218219 220 221 222 223 224 225 226 227 228 229 230 231 232 233 234 235 236 237
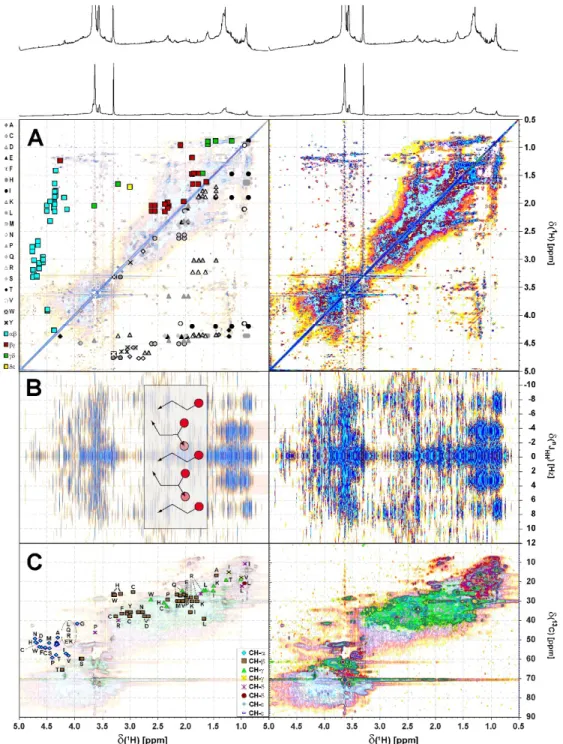
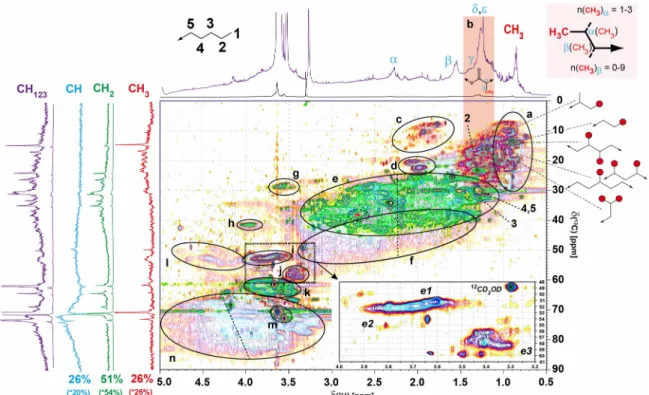
Figure S7. (A) 1H, 1H TOCSY (B) 1H, 1H JRES and (C) 1H, 13C DEPT-HSQC NMR spectra of consolidated Sargassum extract; aliphatic section. Left panels A and C indicate cross peaks resulting from proteinaceous amino acids (see attendant single letter code of amino acids) in proteins following alanine (A) annotated according to position and carbon multiplicity (Hertkorn et al., 2002); left panel B indicated ethyl (linear, H < 0.95 ppm) and branched H ~ 0.8-1.3 ppm. (panel A): upper left half: amino acid-derived COSY cross peaks according to positioning in peptides (blue squares); (panel A): lower right half: amino acid-derived TOCSY cross peaks according to individual amino acids (individual gray symbols). (Panel C): 1H, 13C DEPT HSQC NMR spectrum; color code:
weak shaded: CH123; green: CH2, red: CH3. 240
241 242 243 244 245 246 247 248 249 250
Figure S8. Multiplicity-edited 1H, 13C DEPT-HSQC NMR spectrum of consolidated Sargassum extract, with projection 1H- and multiplicity-edited 13C NMR spectra (percentage relates to fractions of methyl, methylene and methine carbon to total
protonated carbon, CH123). Assignment of major substructures; general colours: CH3: red;
CH2 green, and CH: shaded 1H, 13C HSQC NMR spectrum; section a: C-CH3 cross peaks (with major motifs provided); section b: C-CH3 cross peaks within aliphatic chains;
section c: C=C-CH3 and -SCH3 cross peaks, carotenoid derivatives; section d: acetyl H3C-C(=O)-O-C- (C < 22 ppm), and acetamide H3C-C(=O)-NH-C- (C > 22 ppm);
section e: C2CH2 cross peaks; H > 2.15 ppm: HOOC-CH2-; H < 2.15 ppm: HOOC-CHn- CH2-, this includes carboxyl-rich alicyclic compounds CRAM (Hertkorn et al., 200) as well as other remotely functionalized branched aliphatics; dotted ellipsoid: H3C-N- methylamines (H/C ~ 2.7/37 ppm); section f: HOOC-(CH2)n(C2)CH units H > 2.15 ppm:
HOOC-CH-; H < 2.15 ppm: HOOC-CHn-CH-; this includes carboxyl-rich alicyclic compounds CRAM (Hertkorn et al., 2006) as well as other remotely functionalized branched aliphatics; section g: -C-CH2-N amine cross peaks; section h: glycine in peptides; section i: methoxy (OCH3) cross peaks from aromatic (H > 3.65 ppm) and aliphatic esters (H < 3.65 ppm); section j: aliphatic methyl ethers H3CO-Calkyl; section k:
oxomethylene (OCH2) cross peaks, likely from carbohydrates; section l: -(C=O)OCH2, probably indicating microbial fatty acid derivatives; section m: -NH-C(=O)-CHn-C (n:
1, 2) in peptides; section n: OC2CH cross peaks, dotted line, dH > 4 ppm, oxidation products from carotenoids (Arakawa et al., 2017) (cf. main text). Box insert denotes section of OCH3 cross peaks: e1: aliphatic methyl esters, e2: aromatic methyl esters, e3:
25
26
251 252 253 254 255 256 257 258 259 260 261 262 263 264 265 266 267 268 269 270 271 272 273
et al., 2013 (small print letter with asterisk denote relative abundances as computed without correction).
278 279 280
281
Figure S9. (Panel A) 1H, 1C JRES NMR, (panel B) 1H, 1H TOCSY NMR and (panel C)
1H, 13C HSQC NMR spectrum of consolidated Sargassum extract: section of unsaturated C-H bonds (=CH) and anomeric positions in carbohydrates (O2CH). Green shaded area corresponds to entire range of chemical shift which is accessible to single aromatic rings (SPARIA: substitution patterns in aromatic rings by increment analysis (Perdue et al., 2007)). JRES NMR spectra indicate presence of 1,2-di-, 1,3-di und 1,2,3-trihydrogen substituted aromatic rings, together with trans double bonds arising from natural products; cis-double bonds are rather rare. TOCSY NMR spectra display rare isolated olefins (section a), whereas the section of phlorotannins (H ~ 5.8-6.5 ppm, green shade) also hosts natural products with conjugated olefins (section c); section d represents connectivities between electron-donating (OR), neutral (R) and electron-withdrawing (COR) substituents in aromatic rings; the latter are most abundant, suggesting presence of many carboxylated aromatic rings. It is conceivable that phlorotannin radicals may also be subject to further oxidation into carboxylic acid derivatives in contact to air (Schmitt- Kopplin et al., 1998). However, HMBC cross peaks arising from phlorotannins were virtually absent in general (data not shown; cf. Figure S10), probably caused by short transverse NMR relaxation times in large-size phlorotannins, and their huge structural diversity. (panel C) 1H, 13C HSQC NMR spectrum with key substructures denoted as follows (cf. 8, 24): section a: anomeric O2CH in carbohydrates (sp3-hybridized); section b: 1,3,5-trioxosubstituted aromatics (phlorotannins; for further differentiation, see dotted box, Figure S12); section c: certain five membered N-, O- and S-heterocycles, C-
substituted olefins; section d: C-conjugated olefins, attached to aliphatics, certain five membered N-, O- and S-heterocycles; section e: classical NOM hydroxyl-aromatic systems and natural products, guaiacyl units (G5/6), para-coumarate (C3/5); section f:
phenolic natural products, guaiacyl units (G2); section g: alkylated and oxygenated NOM aromatics; section h: classical NOM aromatics with high proportion of carboxylated units from H > 7.3 ppm; fromH > 8 ppm: multiply carboxylated aromatics, six-membered nitrogen heterocycles; sterically uncongested polycyclic aromatic hydrocarbons; section i: olefins with proximate multiple carbon substitution; five-membered heterocycles with conjugated Csp2-units; section j: polarized double bonds, also conjugated; section k:
certain six-membered nitrogen heterocycles, very likely with more than one nitrogen;
section l: certain six-membered nitrogen heterocycles.
29
30 282 283 284 285 286 287 288 289 290 291 292 293 294 295 296 297 298 299 300 301 302 303 304 305 306 307 308 309 310 311 312 313
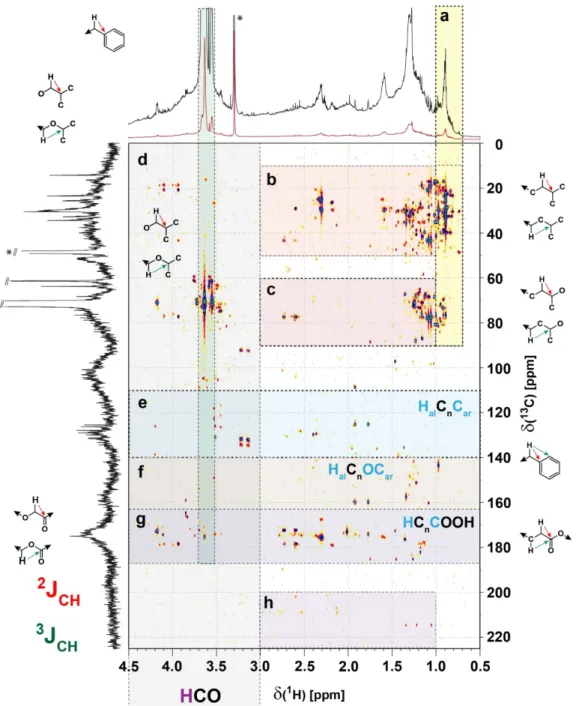
Figure S10. 1H, 13C HMBC spectrum of consolidated Sargassum extract with substructure regimes indicated: panel a: HMBC cross peaks 2,3JCH connecting methyl with various groups:
H3C-(C)CC (C< 60 ppm), H3C-(C)CO (C~ 60…100 ppm), and H3C-(C)CO2 (C~ 165-187 ppm); panel b: intra aliphatic HMBC cross peaks HC(C)C within aliphatics (2,3JCH); panel c: intra aliphatic HMBC cross peaks HC(C)CO (2,3JCH); panel d: general HMBC cross peaks within oxygenated aliphatic units (HC(C)HCO (2,3JCH); panel e: HMBC cross peak connecting aliphatic protons with sp2-hybridized carbon (olefin or aromatics) HCal(C)Csp2 (2,3JCH); panel f: HMBC cross peak connecting aliphatic protons with oxygenated aromatic natural products HCalCsp2(O)-(3JCH);
panel g: HMBC cross peak connecting aliphatic protons with carbonyl carbon HCal(C)C(=O)X (2,3JCH); panel h: aliphatic ketones HC(C)C=O (2,3JCH). The green insert between H ~3.5-3.7 ppm denotes presence of esters of likely microbial origin: a series of >20 resolved 1H, 13C HSQC (section m in Fig. S8) and 1H, 13C HMBC cross peaks indicates presence of several closely related compounds in Sargassum SPE-DOM.
314 316315
317 318319 320321 322323 324 325326 327328
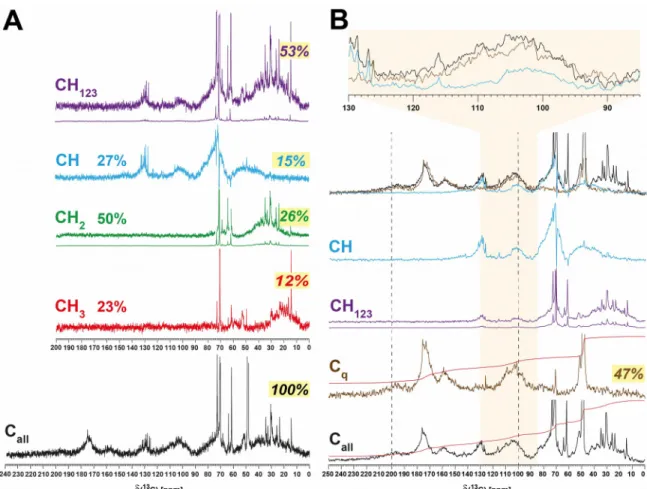
Figure S11. Panel A: Multiplicity-edited and single-pulse 13C NMR spectra of consolidated Sargassum extract, with proportions of methine, methylene and methyl referred to all protonated carbon (CH123) = 100%. Exponential line broadening used here was lb = 12.5 Hz. Compared with Atlantic surface ocean SPE-DOM (Hertkorn et al., 2013), the Sargassum extract contained far more methylene carbon (50% vs. 25%) at the expense of methyl groups (23% vs. 26%), and considerably less methine carbon (27% vs.
49%). Percent values provided in italics denote proportions of Cq, methine, methylene and methyl referred to all carbon (Call) = 100 %. All relative abundances of CH123 are corrected for transfer amplitudes of 13C DEPT-45 NMR spectra (cf. experimental section). This implies lower extent of aliphatic branching, in line with the low proportions of C3CH-units observed in Sargassum extracts (25% vs. 46%) when compared with those present in open Atlantic surface ocean SPE-DOM. The relative proportions of multiplicity-edited carbon were as follows: (HCar-C / O-HC-O,
phlorotannins / HC-O / HC-C): 16 / 11 / 48 / 25; (H2C-O / H2C-C): 46 / 54; (H3C-O / H3C-C): 8 / 92, and confirm large proportions of phlorotannins and a very large
proportion of oxygenated methylene groups (46% vs. 15% as observed in open Atlantic surface ocean SPE-DOM).
33
34
329 330 331 332 333 334 335 336 337 338 339 340 341 342 343 344 345 346 347
Panel B: Overlay of single-pulse (black), QUATD (Cq; brown), DEPT-45 (CH123; purple) and DEPT-90 (CH; blue) 13C NMR spectra of consolidated Sargassum extract.
Exponential line broadening used here was 35 Hz. A large variance of substitution motifs was found in Sargassum phlorotannins; in particular, multiply oxygenated phlorotannins (i.e. with 4-6 oxygen atoms per aromatic ring) produced 13C NMR resonances of Car-O- units, ranging from C ~165 ppm down to ~130 ppm, a range not observed for classical phenolic units which resonate at C ~158 ± 8 ppm. Car-C-units occupied a range from C ~ 90-140 ppm. Hence, appreciable 13C NMR integral was observed in the region from C ~ 90-165 ppm; nevertheless the large spread of C, caused limited S/N ratio, even at lengthy acquisitions. The yellow shaded area provides an expansion from C ~85 - 130 ppm in which the majority of carboxylated and alkylated 1,3,5-trioxoaromatic which are not placed within condensed, polyoxygenated systems, resonate.
Quaternary carbon allowed improved description of phlorotannin structural diversity.
When we defined the entire 13Cq NMR integral from C ~ 90-165 ppm as 100%, the section of Car-O units (C ~ 140-160 ppm) which was part of a freely rotating 1,3,5- trioxo-aromatic ring had 23% abundance; the section of oxidized aromatic compounds with ≥ 4 oxygen atoms per aromatic ring (C ~ 120-140 ppm) in elaborate, fused chemical environments was 18%, while the bulk of oxygenated 1,3,5-phlorotannins ranged near 60% quaternary carbon. With a range of C ~ 90-120 ppm, Cq occupied a much wider section of (13C) than respective methine carbon atoms which resonated from C ~ 90-102 ppm (Figure 3, Figure S12). The relative proportions of quaternary and methine carbon from C ~ 90-120 ppm, i.e. the section in which the common and C-substituted
phlorotannins resonated were >8:1. This implies a very substantial oxygenation of aromatic rings with nevertheless have retained their intrinsic 1,3,5-trioxo substitution pattern. Carboxylated and alkylated phlorotannins probably result from carboxylation of reactive radical intermediates (Schmitt-Kopplin et al., 1998).
A very few solution-state QUATD 13C NMR spectra are published; Lam et al. (2007) have investigated a freshwater DOM in which the overall proportion of Cq was quite sizable (~67%; Figure 2 in Lam et al. (2007)); however in contrast to Sargassum extract, freshwater DOM showed almost no quaternary carbon from C ~ 90-102 ppm, and also nearly negligible ketones at C > 195 ppm.
350 351 352 353 354 355 356 357 358 359 360 361 362 363 364 365 366 367 368 369 370 371 372 373 374 375 376 377 378 379 380 381
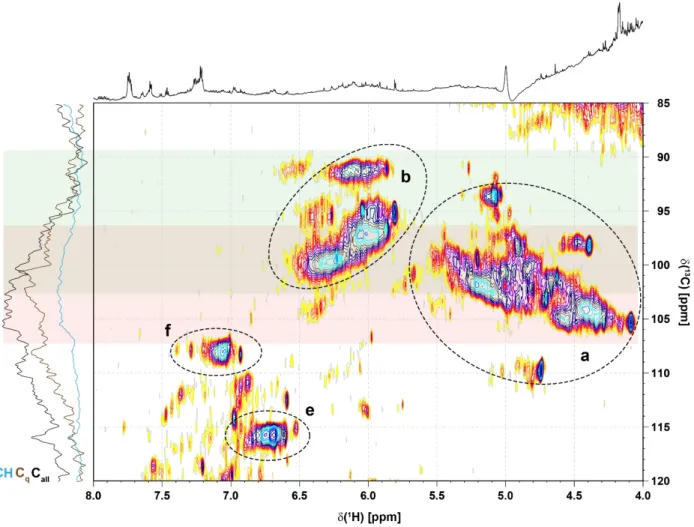
Figure S12. Section of 1H, 13C HSQC NMR spectrum of consolidated Sargassum extract (cf. Figure 3) showing the overlap of methine carbon atoms derived from phlorotannin- (green shaded) and anomeric positions (red shaded) at C ~ 96-102 ppm. Sections a, b, e, and f are explained in Figure S9. In contrast to phlorotannins which are quite rich in quaternary carbon atoms, common carbohydrates do not show quaternary carbon atoms.
Hence, quaternary carbon atoms in the section C ~ 96-102 ppm arise solely from
phlorotannins; owing to all-positive increments of aliphatic substitution in aromatic rings, the relevant chemical shift range of Cq in phlorotannins extends to C ~ 96-120 ppm. A comparison of the relative 13C NMR section integrals originating from quaternary carbon and methine carbon results in a ratio of ~10 : 1. This distributes into >7:1 for the bulk of oxygenated and carboxylated, terminal 1,3,5-phlorotannins (60% of relevant Cq), >5:1 for oxidized aromatic compounds within more condensed phlorotannins with a minimum of 4 oxygen atoms per aromatic ring (18% of relevant Cq), and a set of Cq only Car-O units (23%).
The data of Figure S11 and S12 indicate an average count of hydrogen per aromatic ring
37
38
382 383 384 385 386 387 388 389 390 391 392 393 394 395 396 397 398
401402 403
Figure S13. 1H, 13C HSQC NMR spectrum of consolidated Sargassum extract: section of 1,3,5-trioxoaromatic compounds (i.e. phlorotannins) with key substructures, associated
H/C values and percentage of quaternary carbon atoms provided. The model structures indicate ranges of H/C according to three major classes of substitution indicated by color (H/C ~ 5.9-6.3 / 93±1.5 ppm, H/C ~ 5.8-6.2 / 98±2 ppm and H/C ~ 6.0-6.4 / 101±2 ppm).
These included an array of 3,5-dihydroxybenenes attached via oxygen at C1 and substituted 1,4-dioxins (section b1 (also resonating in section b2) 15%), carbon-bound 2,4,6-trihydroxybenzenes (section b2, 45%), and oxidized phlorotannins, with ≥4 oxygen atoms (section b3, 40%). Notably, oxidized phlorotannins while not becoming more hydrogen-deficient than ordinary ones with respect to molecular composition (as detected by FTICR mass spectrometry) exhibit smaller proportions of non-exchangeable protons which are observed in 1H NMR detected spectra acquired with solvent suppression or standard 2D NMR spectra. Hence, oxidized phlorotannins produce lesser and smaller HSQC cross peaks at equal molar concentration than ordinary ones. Terminal aromatic rings of phlorotannins often show local C2 symmetry which frequently causes two protons to resonate at identical frequencies (e.g. at 3,5- or 2,6-positions), providing NMR resonances with double amplitude. The structural regularity of common phlorotannins with distinct trioxo aromatic rings separated by aryl-aryl or arylether bonds allows for extrapolation of H/C values. So far, HSQC cross peaks of any NOM investigated at our institute (> 300) with analogous H/C have only been observed in Suwannee River water in which these probably represented catechins and other terrestrial derived tannins (Figure 7 in Perdue et al. (2007)).
41
42 404 405 406 407 408 409 410 411 412 413 414 415 416 417 418 419 420 421 422 423 424 425
Table S1. Intensity-weighted (wt) average (± 1 standard deviation) molecular characteristics for Sargassum SPE-DOM for all non-stress incubations (described in Section 2.2). These characteristics were determined for assigned molecular compositions containing only carbon, hydrogen, and oxygen (CHO) analyzed in either negative (neg.) or positive (pos.) ionization modes. Analogous processing was repeated for CHO + sulfur (CHOS) assignments, CHO + nitrogen (CHNO) assignments, CHNOS assignments, and CHO + bromine (CHOBr) assignments. CHO formulas were additionally grouped by those that were common between both negative and positive ion modes, those that were unique to neg. mode and those that were unique to pos. mode.
MWwt
(Da) O/Cwt H/Cwt DBEwt AIwt AImod_wt XC_wt
(m = 1) XC_wt
(m = 0.5)
CHO neg.
(n = 1016)
383.1 ± 78.0
0.61 ± 0.11
0.83 ±
0.30 11.0 ± 3.4 0.18 ± 0.20
0.50 ± 0.18
2.27 ± 1.59
2.57 ± 0.47 CHO pos.
(n = 1218)
405.9 ± 60.1
0.40 ± 0.19
1.31 ±
0.43 8.0 ± 4.2 0.13 ± 0.14
0.28 ± 0.20
2.44 ± 1.19
2.54 ± 0.77 CHOS neg.
(n = 101)
333.8 ± 34.2
0.43 ± 0.19
1.67 ±
0.25 3.5 ± 1.9 CHOS pos.
(n = 31)
401.9 ± 35.5
0.47 ± 0.20
1.64 ±
0.25 4.1 ± 1.7 CHNO neg.
(n = 85)
358.0 ± 54.9
0.42 ± 0.14
1.33 ±
0.28 7.3 ± 2.0 CHNO pos.
(n = 1332)
392.3 ± 50.5
0.31 ± 0.12
1.51 ±
0.27 6.7 ± 2.7 CHOBr neg.
only (n = 68)
356.6 ± 43.2
0.68 ± 0.08
0.62 ±
0.14 8.7 ± 1.5 CHOBr pos.
only (n = 16)
392.2 ± 28.5
0.62 ± 0.05
0.72 ±
0.07 9.4 ± 1.2 CHNOS
pos. only (n
= 25)
360.1 ± 26.2
0.20 ± 0.12
1.41 ±
0.35 7.6 ± 3.7
Common CHO (n = 373)
418.0 ± 47.0
0.56 ± 0.12
0.91 ±
0.30 11.4 ± 3.0 0.15 ± 0.05
0.45 ± 0.17
1.32 ± 0.28
2.56 ± 0.21 CHO neg.
only (n = 640)
353.4 ± 80.8
0.62 ± 0.12
0.82 ±
0.32 10.2 ± 3.5 0.18 ± 0.19
0.51 ± 0.20
2.27 ± 1.63
2.52 ± 0.53 CHO pos.
only (n = 843)
437.5 ± 85.7
0.37 ± 0.18
1.67 ±
0.38 4.7 ± 4.2 0.09 ± 0.18
0.19 ± 0.23
2.57 ± 0.93
2.77 ± 1.02 426
427 428 429 430 431 432 433 434
435 436 437 438 439
Table S2. 1H NMR section integral (800 MHz, CD3OD) of Sargassum extracts for key substructures of Bermuda solar irradiation experiments; sample numbers 394, 395, 396, and consolidated samples 394_395_396 (* large proportion of phlorotannins), together with two surface Atlantic ocean SPE-DOM (cf. Figure S6); ** large proportions of esters COOCH2). All phlorotannins exhibit low H/C atomic ratios in general and a paucity of CarH groups in particular. Provided that already three ring positions are occupied by oxygen and at least another one by a linkage to neighbouring aromatic rings, an average count of 1.5 protons per aromatic ring in phlorotannins is probably an upper limit. Hence, estimates on the abundance of phlorotannins in real-world complex DOM based in 1H NMR spectra alone are rather ill-constrained and will almost always underestimate its actual proportions.
sample
Bermuda outdoor,
full sun 28h 4 L [%]
Bermuda outdoor,
full sun 27h 850 mL
[%]
Bermuda outdoor,
full sun 30h 830 mL
[%]
[%]
Sargasso Sea surface
SPE- DOM [%]
Sargasso Sea surface
SPE- DOM
[%]
(1H) [ppm] key
substructures 394 395 396 consoli-
dated 397 398 10.0 - 7.0 ppm =CarH 3.1 3.4 3.7 2.9 1.7 1.9
7.0 - 5.0 ppm =CH, O2CH,
phlorotannins 4.8 11.4* 5.7 6.3 3.7 3.7 5.0 - 3.1 ppm OCH 47.1** 32.3 37.6** 41.8 25.5 25.0 3.1 - 1.9 ppm XCCH 17.7 24.7 22.2 20.5 26.7 27.3 1.9 - 0.5 ppm CCCH 27.3 28.2 30.8 28.6 42.4 42.1
45
46 440 441 442 443 444 445 446 447 448 449 450 451
452 453 454 455 456 457 458 459 460 461 462 463 464 465
Table S3. Proportions [%] of Car-H units in phlorotannins and otherwise oxygenated aromatics (Car-OZ; Z: H, C) as computed from 1H NMR spectra (100% = total integral), with recognition of cross peak distribution in 1H, 13C HSQC NMR spectra.
sample
Bermuda outdoor,
full sun 28h 4 L [%]
Bermuda outdoor,
full sun 28h 850 mL
[%]
Bermuda outdoor,
full sun 28h 830 mL
[%]
(1H) [ppm] key substructures 394 395 396 cons 7.2 - 7.0 ppm 35% oxygenated Car-OZ
(Z: H, C); 65% Car-H aromatics 0.21 0.25 0.29 0.27 7.0 – 6.5 ppm
90% oxygenated Car-OZ (Z: H, C);
10% polarized double bonds
0.67 1.66 1.08 0.74
6.5 – 5.8 ppm 85% phlorotannins (1,3,5-trioxo CarH) 15% conjugated double bonds
1.42 4.42 2.14 4.26
7.2 – 5.8 ppm total Car-OZ (any kind) 2.30 6.10 3.50 5.27 470
471 472
473 474
Table S4. Proportions of Car-H units in phlorotannins and otherwise oxygenated aromatics (Car-OZ; Z: C, H) as computed from single-pulse, edited 13C NMR (CH units;
Figure S11) and 1H, 13C HSQC NMR spectra (Figure S9). A large variance of substitution motifs was found in Sargassum phlorotannins; in particular, multiply oxygenated phlorotannins (i.e. with 4-6 oxygen atoms per aromatic ring) produced 13C NMR resonances of Car-O-units, ranging from C ~165 ppm down to ~130 ppm, a range not observed for classical phenolic units which resonate at C ~158 ± 8 ppm. Car-C-units occupied a range from C ~ 100-140 ppm. Hence, appreciable 13C NMR integral was observed in the region from C ~ 100-165 ppm; nevertheless the large spread of C, caused limited S/N ratio, even at lengthy acquisitions of NMR spectra. (a) At a minimum of 60% quaternary carbon atoms per aromatic ring in evolved and oxygenated phlorotannins, a minimum of 18% of phlorotannins were present in consolidated Sargassum extract. As observed in sample “395” (cf. Figure S6), Sargassum may exudate considerably higher proportions of phlorotannins under certain circumstances.
(13C) [ppm]
key substructures (13C NMR)
consolidated (13C NMR)
consolidated (13C DEPT/QUATD (CH) / Cq NMR)
key substructures (DEPT CH) 160 - 140
ppm
95% oxygenated Car-OZ
ipso positions(Z: H, C) 4 - / 14.5
95% oxygenated Car- OZ
ipso positions(Z: H, C) 140 - 120
ppm
90% common organic matter molecules and complex, extended
phlorotannins
- / 16.2 90% common organic matter molecules 120 - 107
ppm
95% oxygenated Car-OZ ortho and para positions (Z:
H, C); 5% double bonds;
five-membered heterocycles
13
3.6 / 9.5
95% oxygenated Car- OZ
ortho and para positions (Z: H, C) 107 - 103
ppm
65% phlorotannins (1,3,5- trioxo CarH); ortho and para
positions (Z: H, C); 35%
anomerics (O2CH)
0.1 / 4.3
3% phlorotannins (1,3,5-trioxo CarH)
ortho and para positions (Z: H, C) 103 - 90
ppm
80% phlorotannins (1,3,5- trioxo CarH); 20% anomerics
(O2CH) 4.7/ 9.9 60% phlorotannins
(1,3,5-trioxo CarH) 160 - 90
ppm total Car-OZ (any kind) 18a 8.4 / 44.4 total Car-OZ (any kind)
49
50 475 476 477 478 479 480 481 482 483 484 485 486 487 488 489
490 491 492
Table S5. (Top): 13C NMR section integrals (percent of total carbon) and key substructures of consolidated Sargassum SPE-DOM. Bottom: Substructures used for basic NMR-derived reverse mixing model with nominal H/C and O/C ratios given (Hertkorn et al., 2013). Sargassum extract showed lower H/C ratio (1.23 vs. 1.38) and higher O/C ratio (0.78 vs. 0.73) than surface open Atlantic Ocean SPE-DOM (Hertkorn et al., 2013).
(13C) ppm 220- 187
187- 167
167- 145
145- 108
108- 90
90-
47 47-0 H/C ratio
O/C ratio key
substructures C=O COX Car-O Car-C,H O2CH OC
H CCH
all carbon 3.3 9.5 3.7 10.6 9.3 33.4 30.2 1.23 0.78
Cq only 10.9 24.8 14.7 17.0 15.8 6.7 10.1
H/C ratio 0 1 0 1 1 1 2 - -
O/C ratio 1 2 1 0 2 1 0 - -
493 494 495 496 497 498
499
500 501 502 503 504 505
Table S6. Acquisition parameters of NMR spectra, shown according to Supplementary figures. PK: probeheads used for acquisition of NMR spectra, 8QCI: cryogenic inverse geometry 5 mm z-gradient 1H/13C/15N/31P QCI probe (B0 = 18.8 T);; 5D: cryogenic classical geometry 5 mm z-gradient 13C, 1H probe (B0 = 11.7 T); NS: number of scans (for 2D NMR: F2); AQ: acquisition time [ms]; D1: relaxation delay [ms]; NE: number of F1 increments in 2D NMR spectra; WDW1, WDW2: apodization functions in F1/ F2 (EM/GM: line broadening factor [Hz]; QS: shifted square sine bell; SI: sine bell); PR1, PR2: coefficients used for windowing functions WDW1, WDW2, EM is given in [Hz], SI/QS derived functions indicate shift by /n. (*) asterisk: coadded 13C NMR spectra.
spectru m
SI Figur
e
PK NS AQ
[ms ]
D1
[ms] NE WDW
1
WDW 2
PR 1
PR 2
1H NMR 5, 6 8QC I
224- 1280
500 0
500
0 - EM - 1 -
13C DEPT- 45, -135
NMR
8, 11 5D 82944
*
100 0
200
0 - EM - 12.
5 -
13C DEPT- 90 NMR
8, 11 5D 165888
*
100 0
200
0 - EM - 12.
5 -
13C QUATD
NMR
4A,
11 5D 55838 100
0
1900
0 - EM - 12.
5
13C
NMR 11 5D 83456
*
100 0
1900
0 EM - 12.
5
1H, 1H
JRES 7, 9 8QC
I 320 100
0 50 0 6
4 QS QS 0 0
1H, 1H
TOCSY 7, 9 8QC
I 32 100
0 250
0 204
8 EM QS 2.5 4
1H,13C DEPT
HSQC 6, 7, 8 8QC
I 256 25 0
125 0
40
0 EM QS 7.5 2.5
1H, 13C
HSQC 4, 9,
12, 13 8QC
I 1024 25
0 125 0 27
5 EM QS 7.5 2.5
1H, 13C
HMBC 10 8QC
I 1600 100
0 500 28
1 EM QS 2.5 2.5
53
54 506 507 508 509 510 511 512 513 514 515
516 517 518
References
Abdullah, M. I., & Fredriksen, S. (2004). Production, respiration and exudation of dissolved organic matter by the kelp Laminaria hyperborea along the west coast of Norway. Journal of the Marine Biological Association of the UK, 84(5), 887–894.
https://doi.org/10.1017/S002531540401015Xh
Van Altena, I. A., & Steinberg, P. D. (1992). Are differences in the responses between North American and Australasian marine herbivores to phlorotannins due to
differences in phlorotannin structure? Biochemical Systematics and Ecology, 20(6), 493–499. https://doi.org/10.1016/0305-1978(92)90003-V
Arakawa, N., Aluwihare, L. I., Simpson, A. J., Soong, R., Stephens, B. M., & Lane- Coplen, D. (2017). Carotenoids are the likely precursor of a significant fraction of marine dissolved organic matter. Science Advances, 3(9), 1–12.
https://doi.org/10.1126/sciadv.1602976
Blunt, J. W., Copp, B. R., Munro, M. H. G., Northcote, P. T., & Prinsep, M. R. (2006).
Marine natural products. Natural Product Reports, 23(1), 26–78.
https://doi.org/10.1039/b502792f
Fourest, E., & Volesky, B. (1996). Contribution of sulfonate groups and alginate to heavy metal biosorption by the dry biomass of Sargassum fluitans. Environmental Science and Technology, 30(1), 277–282. https://doi.org/10.1021/es950315s
Haugan, J. A., & Liaaen-Jensen, S. (1994). Algal carotenoids 54. Carotenoids of brown algae (Phaeophyceae). Biochemical Systematics and Ecology, 22(1), 31–41.
https://doi.org/10.1016/0305-1978(94)90112-0
Hertkorn, N., Harir, M., Koch, B. P., Michalke, B., & Schmitt-Kopplin, P. (2013). High- field NMR spectroscopy and FTICR mass spectrometry: Powerful discovery tools for the molecular level characterization of marine dissolved organic matter.
Biogeosciences, 10(3), 1583–1624. https://doi.org/10.5194/bg-10-1583-2013 Hertkorn, N, Permin, a, Perminova, I., Kovalevskii, D., Yudov, M., Petrosyan, V., &
Kettrup, a. (2002). Comparative analysis of partial structures of a peat humic and fulvic acid using one- and two-dimensional nuclear magnetic resonance
spectroscopy. Journal of Environmental Quality, 31(2), 375–87.
https://doi.org/10.2134/jeq2002.3750
Hertkorn, Norbert, Benner, R., Frommberger, M., Schmitt-Kopplin, P., Witt, M., Kaiser, K., et al. (2006). Characterization of a major refractory component of marine dissolved organic matter. Geochimica et Cosmochimica Acta, 70(12), 2990–3010.
https://doi.org/10.1016/j.gca.2006.03.021
Hertkorn, Norbert, Harir, M., Cawley, K. M., Schmitt-Kopplin, P., & Jaffé, R. (2016).
Molecular characterization of dissolved organic matter from subtropical wetlands: A comparative study through the analysis of optical properties, NMR and FTICR/MS.
Biogeosciences, 13(8), 2257–2277. https://doi.org/10.5194/bg-13-2257-2016 Herzsprung, P., Hertkorn, N., Von Tümpling, W., Harir, M., Friese, K., & Schmitt-
Kopplin, P. (2016). Molecular formula assignment for dissolved organic matter (DOM) using high-field FT-ICR-MS: Chemical perspective and validation of sulphur-rich organic components (CHOS) in pit lake samples. Analytical and Bioanalytical Chemistry, 408(10), 2461–2469. https://doi.org/10.1007/s00216-016- 523
524 525 526 527 528 529 530 531 532 533 534 535 536 537 538 539 540 541 542 543 544 545 546 547 548 549 550 551 552 553 554 555 556 557 558 559 560 561 562 563 564 565 566 567 568
9341-2
Isaza Martínez, J. H., & Torres Castañeda, H. G. (2013). Preparation and
chromatographic analysis of phlorotannins. Journal of Chromatographic Science, 51(8), 825–838. https://doi.org/10.1093/chromsci/bmt045
Kimura, J., & Maki, N. (2002). New loliolide derivatives from the brown alga Undaria pinnatifida. Journal of Natural Products, 65(1), 57–58.
https://doi.org/10.1021/np0103057
Kuhnert, N., Clifford, M. N., & Müller, A. (2010). Oxidative cascade reactions yielding polyhydroxy-theaflavins and theacitrins in the formation of black tea thearubigins:
Evidence by tandem LC-MS. Food & Function, 1(2), 180.
https://doi.org/10.1039/c0fo00066c
Kujawinski, E. B., Del Vecchio, R., Blough, N. V., Klein, G. C., & Marshall, A. G.
(2004). Probing molecular-level transformations of dissolved organic matter:
Insights on photochemical degradation and protozoan modification of DOM from electrospray ionization Fourier transform ion cyclotron resonance mass
spectrometry. Marine Chemistry, 92(1-4 SPEC. ISS.), 23–37.
https://doi.org/10.1016/j.marchem.2004.06.038
Lam, B., Baer, A., Alaee, M., Lefebvre, B., Moser, A., Williams, A., & Simpson, A. J.
(2007). Major Structural Components in Freshwater Dissolved Organic Matter.
Environmental Science & Technology, 41(24), 8240–8247.
https://doi.org/10.1021/es0713072
Li, B., Lu, F., Wei, X., & Zhao, R. (2008). Fucoidan: Structure and bioactivity.
Molecules, 13(8), 1671–1695. https://doi.org/10.3390/molecules13081671
Perdue, E. M., Hertkorn, N., & Kettrup, A. (2007). Substitution patterns in aromatic rings by increment analysis. Model development and application to natural organic matter.
Analytical Chemistry, 79(3), 1010–1021. https://doi.org/10.1021/ac061611y
Reddy, P., Urban, S., & Natural, T. (2008). Linear and Cyclic C 18 Terpenoids from the Southern Australian Marine Brown Alga. Journal of Natural Products, 71, 1441–
1446.
Schmitt-Kopplin, P., Hertkorn, N., Schulten, H. R., & Kettrup, A. (1998). Structural changes in a dissolved soil humic acid during photochemical degradation processes under O2 and N2 atmosphere. Environmental Science and Technology, 32(17), 2531–
2541. https://doi.org/10.1021/es970636z
Singh, I. P., Sidana, J., Bharate, S. B., & Foley, W. J. (2010). Phloroglucinol compounds of natural origin: Synthetic aspects. Natural Product Reports, 27(3), 393–416.
https://doi.org/10.1039/b914364p
Steevensz, A. J., MacKinnon, S. L., Hankinson, R., Craft, C., Connan, S., Stengel, D. B.,
& Melanson, J. E. (2012). Profiling phlorotannins in brown macroalgae by liquid chromatography-high resolution mass spectrometry. Phytochemical Analysis, 23(5), 547–553. https://doi.org/10.1002/pca.2354
Stiger-Pouvreau, V., Jégou, C., Cérantola, S., Guérard, F., & Lann, K. Le. (2014).
Phlorotannins in sargassaceae species from brittany (France): Interesting
57
58 569 570 571 572 573 574 575 576 577 578 579 580 581 582 583 584 585 586 587 588 589 590 591 592 593 594 595 596 597 598 599 600 601 602 603 604 605 606 607 608 609 610
Journal of Agricultural and Food Chemistry, 54(26), 9805–9810.
https://doi.org/10.1021/jf062204q
Vershinin, V., Dyadyuk, A., & Pappo, D. (2017). Iron-catalyzed selective oxidative arylation of phenols and biphenols. Tetrahedron, 73(26), 3660–3668.
https://doi.org/10.1016/j.tet.2017.03.094
Wijesinghe, W. A. J. P., & Jeon, Y. J. (2012). Enzyme-assistant extraction (EAE) of bioactive components: A useful approach for recovery of industrially important metabolites from seaweeds: A review. Fitoterapia, 83(1), 6–12.
https://doi.org/10.1016/j.fitote.2011.10.016
Yotsu-Yamashita, M., Kondo, S., Segawa, S., Lin, Y. C., Toyohara, H., Ito, H., et al.
(2013). Isolation and structural determination of two novel phlorotannins from the brown alga Ecklonia kurome Okamura, and their radical scavenging activities.
Marine Drugs, 11(1), 165–183. https://doi.org/10.3390/md11010165
Zhang, F., Harir, M., Moritz, F., Zhang, J., Witting, M., Wu, Y., et al. (2014). Molecular and structural characterization of dissolved organic matter during and post
cyanobacterial bloom in Taihu by combination of NMR spectroscopy and FTICR mass spectrometry. Water Research, 57, 280–294.
https://doi.org/10.1016/j.watres.2014.02.051 615
616 617 618 619 620 621 622 623 624 625 626 627 628 629 630 631 632 633