Geophysical Research Letters
Supporting Information for
Iron regulation of North Atlantic eddy phytoplankton productivity Thomas J. Browning1*, Ali A. Al-Hashem1, Mark J. Hopwood1, Anja Engel1, Igor
M. Belkin2, Ewan D. Wakefield3, Tim Fischer4, Eric P. Achterberg1
1Marine Biogeochemistry Division, GEOMAR Helmholtz Centre for Ocean Kiel, Germany.
2College of Marine Science and Technology, Zhejiang Ocean University, Zhoushan 316022, Zhejiang, China.
3Institute of Biodiversity Animal Health & Comparative Medicine, University of Glasgow, United Kingdom.
4Physical Oceanography Division, GEOMAR Helmholtz Centre for Ocean Research Kiel, Germany.
*Corresponding author
Contents of this file
Text S1Figures S1 to S4
Additional Supporting Information (Files uploaded separately)
Captions for Dataset S1Introduction
The following Supporting Information contains supplementary discussion and additional figures referenced in the main manuscript.
Text S1.
Decoupling light and nutrient limitation using a simple model
Because mixed layer light availability was unconstrained in our field observations, the relative influence of light and Fe availability on
phytoplankton growth was further investigated using a simple model (Fig.
S4). Nutrient-, light-, and temperature-regulated phytoplankton growth was simulated using the relevant equations and parameterization from the EMPOWER-1.0 model of Anderson et al. (2015). Using this model, depth- integrated photosynthesis was calculated using the analytical formulation of Evans and Parslow (1985), which uses a Smith form photosynthesis-irradiance curve, a triangular pattern of diel irradiance, and light extinction with a single Beer’s law coefficient (see Appendix C of Anderson et al., 2015 for full
equations). Phytoplankton growth rate is dependent on temperature-
modulated maximum photosynthetic rate (Eppley, 1972), light limitation (a function of surface irradiance, light attenuation with depth, and
photosynthesis as a function of light intensity), and nutrient limitation
(Michaelis–Menten form, adapted from Anderson et al. (2015) to a minimizing form for N or Fe; see below). No zooplankton, detritus, or time iteration was included. The model was modified to include Fe (in addition to nitrogen), which was parameterized in the same way as for nitrogen except that the prescribed dissolved concentration differed and the half saturation constant for phytoplankton Fe uptake was scaled from the model-default nitrogen half saturation constant (0.85 μmol N L-1), using assumed-average N:Fe
requirements of phytoplankton (2132 mol N (mol Fe)-1 from Moore et al., 2013).
Calculations were parameterized with the study latitude (49°N was assumed), day number (167, corresponding to mid-June), a sea surface temperature of 12°C, an initial nitrate concentration of 5 μmol N L-1 and chlorophyll-a concentration of 1.5 μg L-1 (all characteristic of out-of-eddy waters). All other parameters were the respective defaults in Anderson et al.
(2015), which includes fixed parameterization of the photosynthesis irradiance curve (light limited slope α = 0.15 g C (g chl)-1 h-1 (W m-2)-1 and maximum potential photosynthetic rate at 0°C, Vmax = 2.5 g C (g chl)-1 h-1 and carbon-to-chlorophyll ratio equal to 75 g g-1). Calculations were ran over increasing mixed layer depths (MLD) (1 to 40 m) and dissolved Fe
concentrations (0 to 0.6 nmol L-1), producing output fields of mixed layer L_I and L_N (representing dimensionless light and nutrient limitation terms within the range 0 to 1) and μP, the achieved phytoplankton growth rate over one day, for all combinations.
Calculations showed that mixed layer shoaling increased μP (i.e., L_I < L_N), but only at elevated Fe concentrations greater than those observed (Fig. S4).
Conversely, increasing dissolved Fe was needed to increase μP (i.e., L_I > L_N) at the lower Fe, shallower MLD regimes that were characteristic of the region.
Modifying key controlling phytoplankton physiological parameters, (i) the light limited slope and (ii) the half saturation concentration for Fe uptake, by
factors of two shifts the Fe-to-light limitation transition, but does not change
this conclusion. These calculations helped to reinforce our interpretation that the combined impact of elevated surface irradiance and already shallow mixed layers at this time of year, in combination with the low Fe
concentrations, means that further mixed layer shoaling in eddies can alone probably not lead to much-enhanced phytoplankton growth rates. The
controls of phytoplankton growth rates indicated by the simulations likely also extend to mixed layer chlorophyll-a biomass concentrations, with the caveat that unconstrained grazing dynamics could play an important co-regulatory role in the latter.
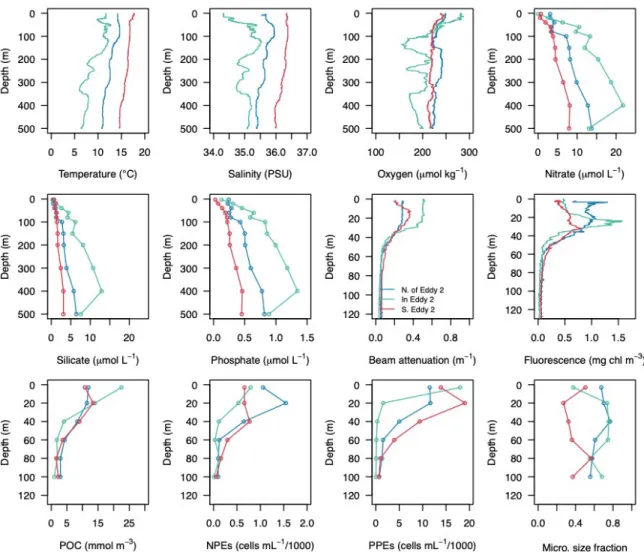
Figure S1: Depth profiles of physical, biological and chemical properties in and outside of Eddy 2. Station sites correspond to the Fe treatment
experiments (1–3) for this eddy indicated in Figures 2 and 3 of the main manuscript. Beam attenuation is a proxy for seawater particle concentration.
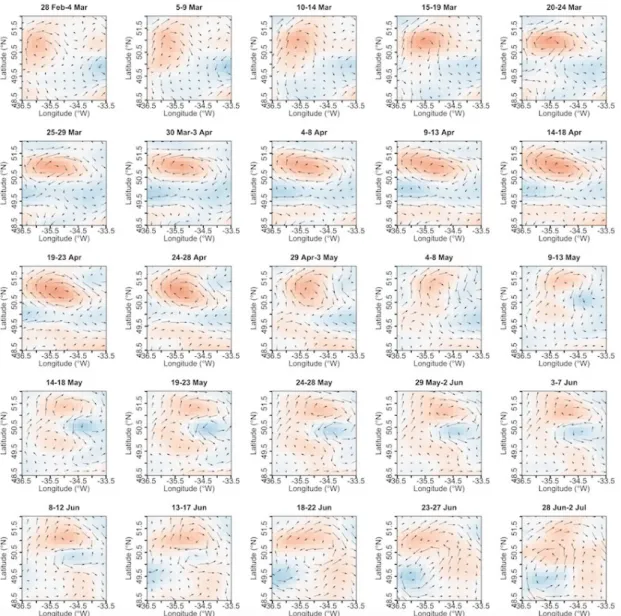
Figure S2 part 1. Time-resolved satellite observations of Eddy 1. SSHA overlaid by current vectors (for details on data and color scales see Methods and Figure 2 of the main manuscript).
Figure S2 part 2. Time-resolved satellite observations of Eddy 1.
Chlorophyll-a overlaid by current vectors (for details on data and color scales see Methods and Figure 2 of the main manuscript). Chlorophyll-a is the multi- sensor OC-CCI product.
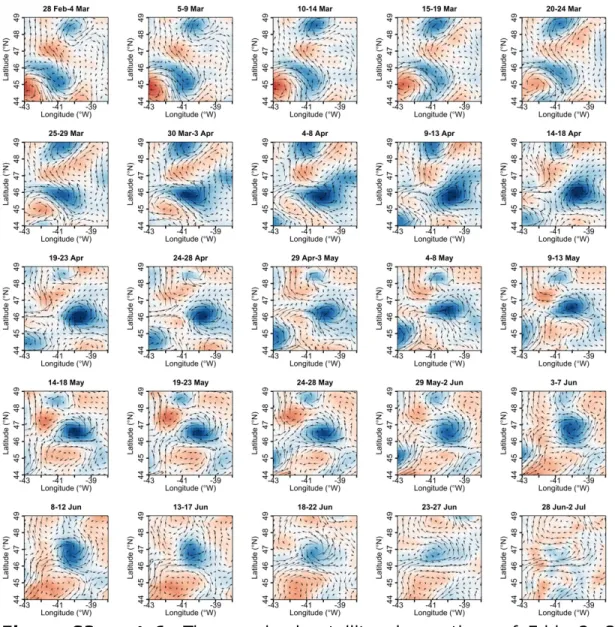
Figure S3 part 1. Time-resolved satellite observations of Eddy 2. SSHA overlaid by current vectors (for details on data and color scales see Methods and Figure 2 of the main manuscript).
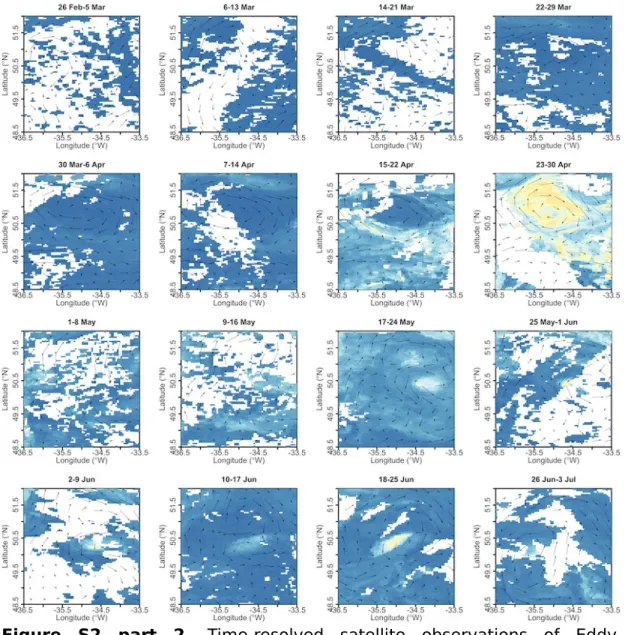
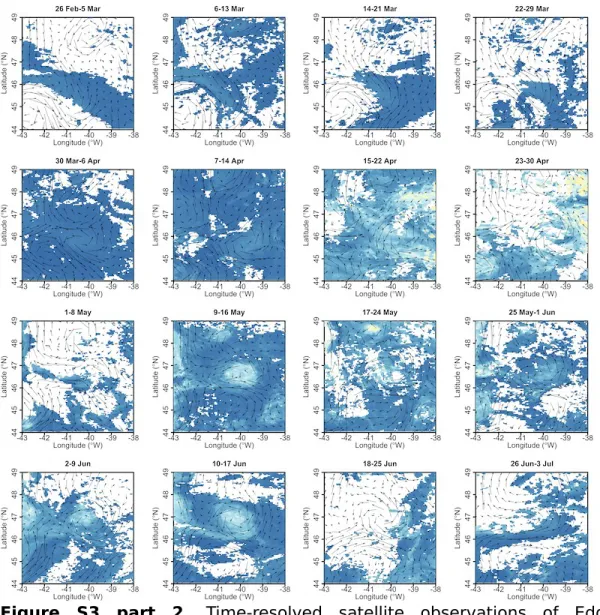
Figure S3 part 2. Time-resolved satellite observations of Eddy 2.
Chlorophyll-a overlaid by current vectors (for details on data and color scales see Methods and Figure 2 of the main manuscript). Chlorophyll-a is the multi- sensor OC-CCI product.
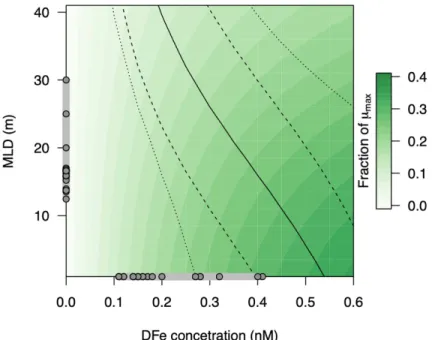
Figure S4. Predicted constraints on phytoplankton growth rate outside of the eddies. MLD is mixed layer depth, DFe is dissolved Fe, shading is predicted phytoplankton growth rate µ relative to maximum (µmax). The solid line indicates where light limitation in the calculation equals Fe limitation, i.e., the transition from Fe limited growth (low Fe concentrations and shallow MLDs;
bottom left) to light limited growth (top right). Light limitation in the simulations was determined by light availability (fixed surface irradiance attenuated throughout the assigned mixed layer depth) and the form of the photosynthesis-irradiance curve, whilst Fe limitation was determined by the assigned dissolved Fe concentration and a Michaelis–Menten equation parameterized with an assumed half saturation Fe concentration. Enveloping lines show simulated transitions when two key controlling phytoplankton physiological parameters are altered by a factor of two: the light limited slope (dashed lines), and the half saturation concentration for Fe uptake (dotted lines). See the Supplementary Discussion 1 for further model details and parameterization. Grey dots show measured values for (i) Fe concentrations outside of the eddies in Figure 3a,b and (ii) MLDs measured throughout the wider North Atlantic on the same research cruise (Browning et al., 2020).
Data Set S1. Dataset of observations made through Eddies 1 and 2. See file ds01.txt.
Supporting Information References
Anderson, T.R., Gentleman, W.C. and Yool, A., 2015. EMPOWER-1.0: an efficient model of planktonic ecosystems written in R. Geosci. Model Dev. 8, 2231-2262.
Browning, T.J., Al‐Hashem, A.A., Hopwood, M.J., Engel, A., Wakefield, E.D. and Achterberg, E.P., 2020. Nutrient regulation of late spring phytoplankton blooms in the midlatitude North Atlantic. Limnol. Oceanogr. 65, 1136-1148.
Eppley, R.W., 1972. Temperature and phytoplankton growth in the sea. Fish.
Bull. 70, 1063-1085.
Evans, G.T. and Parslow, J.S., 1985. A model of annual plankton cycles. Biological Oceanography 3, 327-347.
Moore, C.M., Mills, M.M., Arrigo, K.R., Berman-Frank, I., Bopp, L., Boyd, P.W., Galbraith, E.D., Geider, R.J., Guieu, C., Jaccard, S.L. and Jickells, T.D., 2013.
Processes and patterns of oceanic nutrient limitation. Nat. Geosci. 6, 701–
710.