G-Cubed
Supporting Information for
Core-log-seismic integration in metamorphic rocks and its implication for the regional geology: A case study for the ICDP
drilling project COSC-1, Sweden
Judith Elger1, Christian Berndt1, Felix Kästner1,2, Simona Pierdominici2, Jochem Kück2, Bjarne S. G. Almqvist3, Christopher Juhlin3, Henning Lorenz3
1 GEOMAR Helmholtz Centre for Ocean Research Kiel, Germany
2 Helmholtz Centre Potsdam, GFZ German Research Centre for Geosciences, Germany
3 Department of Earth Sciences, Uppsala University, Uppsala, Sweden
Contents of this file
Figures S1Additional Supporting Information (Files uploaded separately)
Captions for Figure S2Introduction
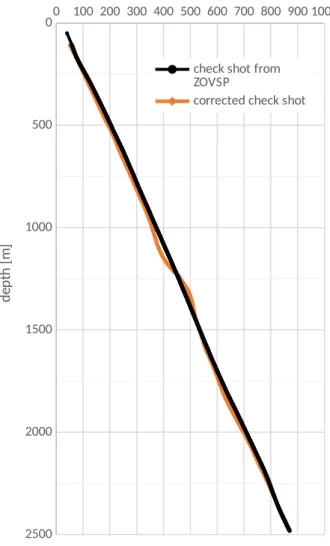
There are two figures in the supplementary information. Figure S1 shows time-depth relationships that were used for the core-log-seismic integration.
The initial relationship is generated from the first arrivals of borehole geophones from the ZOVSP measurements, and the corrected one results from the best adjustment of the synthetic and measured seismogram. Figure S2 shows an overview of logs and classifications along the entire COSC-1 borehole. The large extent of the borehole allows us to show only selected sections from this figure in the manuscript (see Figure 3).
1
0 100 200 300 400 500 600 700 800 900 1000 0
500
1000
1500
2000
2500
check shot from ZOVSP
corrected check shot
TWT [ms]
depth [m]
Figure S1. Time-depth relationships that were used for the core-log-seismic integration. In black the relationship that was generated from the from first arrivals of borehole geophones from the ZOVSP (Krauß, 2018) and in orange the adjusted time-depth relation based on manually picked similar reflections and on the maximal correlation coefficient in HRS-geoview by Hampson- Russell.
Figure S2. An overview of parameters and trend curves (TCs) that were used for the classification along the entire COSC-1 borehole (left to right: total gamma ray, Rb, K, TC 1, Zr, Si, TC 2, Al, Zn, TC 3, bulk density, Fe, Ti, TC 4, P- wave velocity from sonic log, calculated impedance, resistivity, Ca). The classes are highlighted in the measured logs (class I to V material with pink, yellow, white, light grey, dark grey (Table 1)) with the lithological section unit description from the ICDP data base (https://www.icdp-
online.org/projects/world/europe/are-jarpen-sweden/) in the third column from the right.
2
Krauß, F., 2018, Combination of Borehole Seismic and Downhole Logging to Investigate the Vicinity of the COSC-1 Borehole in Western Scandinavia.
3