ATLAS-CONF-2010-024 13July2010
ATLAS NOTE
April 21, 2010
Charged particle multiplicities in pp interactions at √
s = 7 TeV measured with the ATLAS detector at the LHC
The ATLAS Collaboration
Abstract
The first measurements from proton-proton collisions at centre-of-mass energy√ s= 7 TeV recorded with the ATLAS detector at the LHC are presented. Data presented here were collected on 30th March 2010 using a single-arm minimum-bias trigger. The charged particle multiplicity, its dependence on transverse momentum and pseudo-rapidity, and the relationship between mean transverse momentum and charged particle multiplicity are mea- sured for events with at least one charged particle in the kinematic range |η|<2.5 and pT>500 MeV. This analysis follows closely the strategy used in our earlier√
s=900 GeV publication, but with improved track and vertex reconstruction algorithms. The range in both the transverse momentum and charged particle multiplicity is also extended. The√
s=7 TeV results are compared to these published values. The charged particle multiplicity per event and unit of pseudo-rapidity forη=0 is measured to be 2.418±0.004(stat.)±0.076(syst.).
The dependence of the charge particle multiplicity on the centre of mass energy is compared to Monte Carlo model predictions. The energy dependence of the MC09 tune of pT is in reasonable agreement with the data.
1 Introduction
Inclusive charged particle distributions have been measured inppandpp¯collisions at a range of different centre-of-mass energies [1–14]. Many of these measurements have been used to constrain phenomeno- logical models of soft-hadronic interactions and to predict properties at higher centre-of-mass energies.
The measurement presented here at √
s=7 TeV implements a similar strategy to that used in [1]; it uses a single-arm trigger partially overlapping with the acceptance of the inner detector. Results are presented as inclusive-inelastic distributions, with minimal model-dependence, by requiring one charged particle within the acceptance of the measurement. This note reports on a measurement of primary charged particles with a momentum component transverse to the beam direction1 pT >500 MeV and in the pseudo-rapidity range|η|<2.5. Primary charged particles are defined as charged particles with a mean lifetime τ >0.3×10⁻¹⁰ s directly produced in ppinteractions or from subsequent decays of particles with a shorter lifetime. The distributions of tracks reconstructed in the ATLAS inner detector were corrected to obtain the particle-level distributions:
1 Nev·dNch
dη , 1 Nev· 1
2πpT· d2Nch dηdpT, 1
Nev·dNev
dnch and hpTivs.nch,
whereNevis the number of events with at least one charged particle inside the selected kinematic range, Nchis the total number of charged particles,nch is the number of charged particles in an event andhpTi is the average pTfor a given number of charged particles. The factor 2πpT in thepTspectrum is chosen to make the variable Lorentz invariant.
This note presents the latest results at√
s=7 TeV using the first∼6.8µb−1of data recorded by the ATLAS experiment on 30th March 2010. This data sample corresponds to 369673 events containing a total of 3769168 tracks that pass our final event selection. This corresponds to approximately the same number of events as used in the 900 GeV data sample and twice as many tracks because the increased centre-of-mass energy leads to a larger number of charged particles per event. The charged particle multiplicity results are compared to Monte Carlo predictions and to our result at lower centre-of-mass energy [1].
This note concentrates on describing the aspects of the analysis that have changed and on presenting the new results. First the improvements to the configurations for the 2010 data taking period are discussed is Sec 2. The validation procedure for those changes is briefly presented in App. A. We then move on to discussing in Sec. 3 the new√
s=7 TeV data and the event selection applied to these data and show some basic detector level comparisons between √
s=900 GeV and√
s=7 TeV in App. B. As the tracking efficiency is derived from Monte Carlo for this analysis, particular care is taken to ensure that the detector simulation describes our data well. Examples of such studies can be found in Sec. 4, which also contains comparisons of the raw observables to the models. Section 5 describes the different components needed to correct those raw observables for our detector effects as well as the related systematic uncertainties.
No attempt is made to correct the data for any particular physics contribution. The results are thus presented as inclusive inelastic. The data are compared to Monte Carlo predictions with the expected cross sections fromPYTHIA. Finally the results are presented in Sec. 6 and some conclusions are drawn in Sec. 7.
1The ATLAS reference system is a Cartesian right-handed co-ordinate system, with the nominal collision point at the origin.
The anti-clockwise beam direction defines the positivez-axis, while the positivex-axis is defined as pointing from the collision point to the centre of the LHC ring and the positivey-axis points upwards. The azimuthal angleφis measured around the beam axis, and the polar angleθis measured with respect to thez-axis. The pseudo-rapidity is defined asη=−ln tan(θ/2).
2 Improvements to the Detector Configuration for 2010 Data
Relative to the 900 GeV data sample, several improvements were made to the trigger threshold and to the track reconstruction settings. The primary vertex reconstruction algorithm was changed to one able to find multiple primary vertices. These improvements are briefly described in this section.
Following the 2009 data-taking period, several changes have been made to the Minimum Bias Trigger Scintillator (MBTS) detector configuration that is used to trigger the events used in this analysis for readout. The counter thresholds and voltages were tuned to get a better signal to noise separation and therefore we expect a slightly higher trigger efficiency.
Studies performed in the context of the 2009 minimum bias analysis motivated several improvements to the track reconstruction algorithms. The only improvement affecting this measurement is the lowering of the threshold of the track reconstruction algorithm used for this analysis from 500 MeV to 100 MeV;
this removes the turn-on effect due to the algorithm cut being at the samepTas the analysis cut and thus increases the track reconstruction efficiency in that pTregion.
The strategy for the reconstruction of primary vertices in the 7 TeV data differs significantly from the approach used for 900 GeV collisions, as even in this first run the effect of having multiple proton- proton interactions inside the same bunch crossing cannot be neglected. We opted to use an iterative adaptive finder algorithm that has the ability to reconstruct multiple primary vertices [15]. In addition, the constraint that the reconstructed vertices must be consistent with the beam-spot is used. The only change to the selection of the tracks that are considered by the reconstruction algorithm is the lowering of the pTthreshold from 150 to 100 MeV. The vertices are ordered by∑p2T, which is strongly correlated to the total number of tracks at the vertex. Due to the additional constraint of the beam-spot, the requirement of there being at least three tracks in the vertex was no longer needed. The algorithm itself has a limitation of a minimum of two tracks per vertex.
3 Event Selection
The track and event selection used for the 7 TeV analysis is almost identical to that used for the previous analysis except for the addition of a veto on the multiple proton interactions per bunch crossing. The events are thus required
• to have all inner detector sub-systems at nominal conditions,
• to have passed the Level 1 MBTS single-arm trigger,
• to have a primary vertex,
• to not have a second primary interaction in the same bunch crossing (pile-up veto),
• to have at least one good track in the event.
The pile-up veto rejects events that have a second vertex with 4 or more tracks; it is described in more detail in section 3.1. A good track is defined as one that satisfies
• pT>500 MeV,
• a minimum of one Pixel and six Semiconductor Central Tracker (SCT) hits,
• transverse and longitudinal impact parameters calculated with respect to the event primary vertex
|d0|<1.5 mm and|z0| ·sinθ<1.5 mm, respectively.
2
The events selected for this analysis come from a single run on 30th March 2010. nsel refers to the number of tracks per event that pass our final track selection. Due to the increased centre-of-mass energy, this analysis covers an extended range in pTandnchcompared to the 900 GeV analysis. The upper limit in the pT distribution has changed from 20 GeV to 50 GeV and in thench distribution from 60 to 100 particles. In order to allow for direct comparison between the published 900 GeV data and the new results presented here, the bin sizes were kept constant in the regions common to both analyses.
We studied, as for the 900 GeV data, the effect of the beam backgrounds on our data sample. The same method was used; it is based on the MBTS timing difference between the two sides of the detector, and comparing the results from single beam and collision events. Figure 1 shows this distribution at various stages of the analysis cuts. The residual backgrounds, after all cuts, were again found to be below 0.1%.
[ns]
MBTS time
∆
-50 -40 -30 -20 -10 0 10 20 30 40 50
/ bineventsN
1 10 102
103
104
105
= 7 TeV
s ATLAS Preliminary No cuts
Pass L1_MBTS_1 Pass Vertex Pass Pile-up Veto
good track
≥ Pass
Figure 1: The MBTS time difference between the two sides of the detector after various stages of our selection process for the single 7 TeV run considered.
3.1 Multiple Primary Interaction Removal
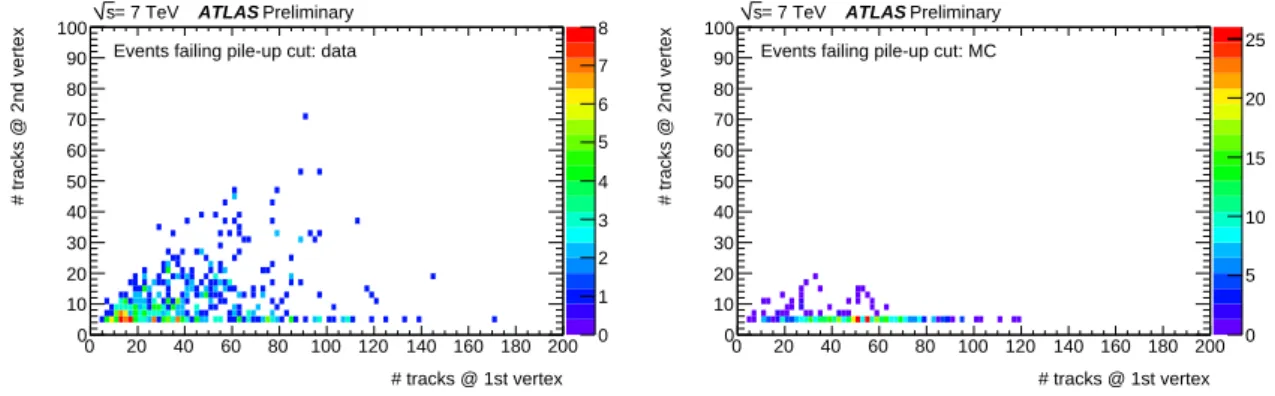
The fraction of events containing a second ppinteraction inside the same bunch crossing is estimated to be ∼10−3 at the LHC conditions of the run used for the analysis. While the absolute number of such events does not have a significant impact on our analysis, it could bias the observed distributions, in particular the dependence on the number of charged particles. We therefore decided to remove as many such events as possible and to estimate any potential residual effects. In this analysis events that have a second vertex with more than 3 tracks are rejected. If the second vertex has 3 or fewer tracks, all tracks from the event that pass our selection are kept. Due to the nature of the vertex reconstruction algorithm, one expects to find, in∼1% of events, additional vertices that either originate from the reconstruction of the decay vertex of secondary particles or are simply fake vertices. In order to illustrate the effect of these multiple-interactions, Fig. 2 shows the two-dimensional distribution of the number of tracks at the vertex for the second versus the first vertex for the events that fail our pile-up removal cut. This illustrates that we do indeed see pile-up events in our detector for this run. In total 487 events were removed by this cut, which corresponds to∼0.1% of our data sample, consistent with expectations.
The residual bias on our sample is estimated by considering four sources of systematic uncertainties
• The fraction of events that are not true pile-up but were removed by the cut is estimated to be
∼0.03%.
• The probability of having a fake second vertex is found to depend on the number of good tracks
0 1 2 3 4 5 6 7 8
# tracks @ 1st vertex 0 20 40 60 80 100 120 140 160 180 200
# tracks @ 2nd vertex
0 10 20 30 40 50 60 70 80 90 100
Events failing pile-up cut: data
= 7 TeV
s ATLAS Preliminary
0 5 10 15 20 25
# tracks @ 1st vertex 0 20 40 60 80 100 120 140 160 180 200
# tracks @ 2nd vertex
0 10 20 30 40 50 60 70 80 90 100
Events failing pile-up cut: MC
= 7 TeV
s ATLAS Preliminary
Figure 2: The two-dimensional distribution of the number of tracks at the vertex for the first versus the second reconstructed vertices, for those events that fail our pile-up removal cut in data (left) and in Monte Carlo (right). The Monte Carlo sample used has no additional vertices simulated and therefore only contains fake second vertices.
• The fraction of pile-up events that are not removed by the cut is estimated to be∼0.01%.
• The fraction of pile-up events that are reconstructed as a single vertex is estimated to be∼0.01%.
With the exception of the second of these uncertainties, all of those effects are derived from data and rely on generating pseudo-experiments based on observed distributions. The estimation of the second uncertainty relies on a Monte Carlo study using a sample without pile-up. All systematics were estimated in a conservative manner: we assume that for events with two vertices all reconstructed tracks from both interactions pass the final track selection constraints with respect to the merged vertex. The effect on the tails of thensel distribution was investigated in the context of the fourth systematic. The fractional change in the number of events in each bin innselis found to be less than 1% for all bins except for the binnsel>80, which is estimated to be∼6%, with large uncertainties due to the small number of data events in that bin. The effect on the tails of that distribution due to the first two sources of systematic is smaller. These pile-up studies all show maximum systematic uncertainties well below those connected to the track reconstruction and the data statistics and are therefore neglected in the final corrections.
4 Comparison Between Data and Monte Carlo at 7 TeV
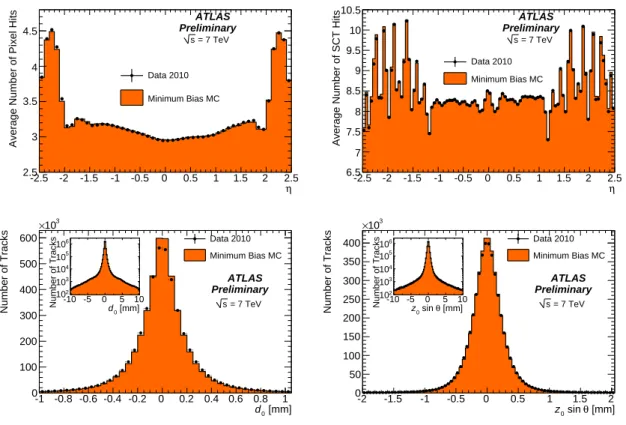
Figure 3 shows that the average number of silicon hits on tracks as a function of the pseudo-rapidity is well described by the simulation at√
s=7 TeV.
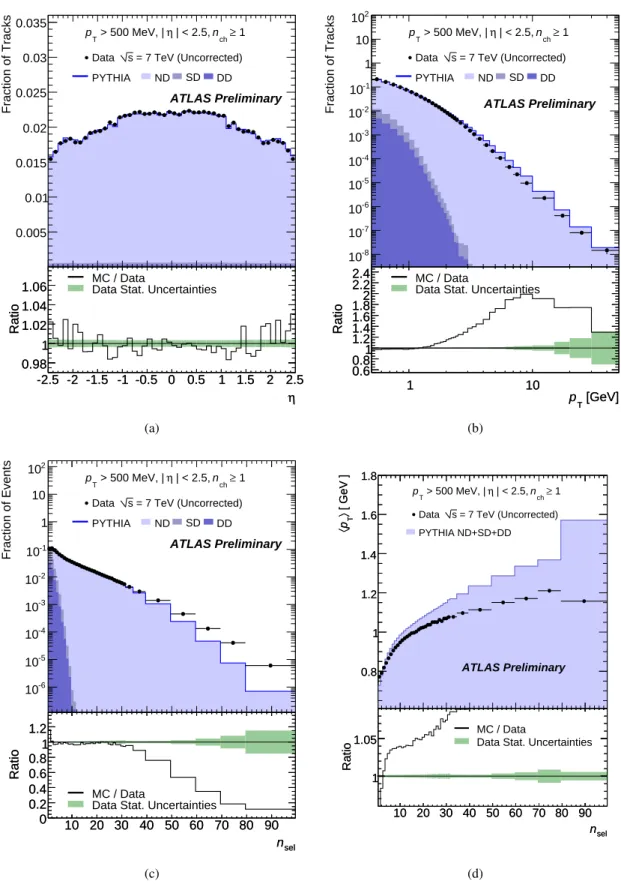
The raw distributions obtained from data and simulation are compared in Fig. 4. The simulation sample is the cross-section weighted mixture of non-diffractive, single- and double-diffractive processes.
These samples were simulated using the PYTHIA 6.4.21 generator with a specific set of optimised pa- rameters, the ATLAS MC09 PYTHIA tune [16], which employs the MRST LO* parton density func- tions [17] and the pT-ordered parton shower. These parameters were derived by tuning to underlying event and minimum-bias data from Tevatron at 630 GeV and 1.8 TeV. The cross sections used for this weighted mixture are: 48.5, 13.7 and 9.17 mb for non-diffractive, single- and double-diffractive respec- tively, corresponding to the inputs used byPYTHIA.
4
-2.5 -2 -1.5 -1 -0.5 0 0.5 1 1.5 2 2.5η
Average Number of Pixel Hits
2.5 3 3.5 4 4.5
Data 2010
Minimum Bias MC ATLAS Preliminary
= 7 TeV s
-2.5 -2 -1.5 -1 -0.5 0 0.5 1 1.5 2 2.5η
Average Number of SCT Hits
6.5 7 7.5 8 8.5 9 9.5 10 10.5
Data 2010 Minimum Bias MC
ATLAS Preliminary
= 7 TeV s
[mm]
d0
-1 -0.8 -0.6 -0.4 -0.2 0 0.2 0.4 0.6 0.8 1
Number of Tracks
0 100 200 300 400 500 600
103
×
[mm]
d0
-10 -5 0 5 10
Number of Tracks
102
103
104
105
106
= 7 TeV s Data 2010 Minimum Bias MC
ATLAS Preliminary
[mm]
θ sin z0
-2 -1.5 -1 -0.5 0 0.5 1 1.5 2
Number of Tracks
0 50 100 150 200 250 300 350 400
103
×
[mm]
θ sin z0
-10 -5 0 5 10
Number of Tracks
102
103
104
105
106
= 7 TeV s Data 2010 Minimum Bias MC
ATLAS Preliminary
Figure 3: The number of silicon hits as a function ofηin data and simulation at√
s=7 TeV (top)(Pixel, left), (SCT, right). Comparison of the transverse and longitudinal impact parameters in data and non- diffractive simulation (bottom).
= 7 TeV (Uncorrected) s
Data
PYTHIA ND SD DD
≥ 1 nch
| < 2.5, η > 500 MeV, | pT
ATLAS Preliminary
Fraction of Tracks
0.005 0.01 0.015 0.02 0.025 0.03 0.035
η -2.5 -2 -1.5 -1 -0.5 0 0.5 1 1.5 2 2.5
Ratio
0.98 1 1.02 1.04
1.06 Data Stat. UncertaintiesMC / Data
η -2.5 -2 -1.5 -1 -0.5 0 0.5 1 1.5 2 2.5
Ratio
0.98 1 1.02 1.04 1.06
(a)
= 7 TeV (Uncorrected) s
Data
PYTHIA ND SD DD
≥ 1 nch
| < 2.5, η > 500 MeV, | pT
ATLAS Preliminary
Fraction of Tracks
10-8
10-7
10-6
10-5
10-4
10-3
10-2
10-1
1 10 102
[GeV]
pT
1 10
Ratio
0.60.81 1.21.4 1.6 1.82 2.22.4
Data Stat. Uncertainties MC / Data
[GeV]
pT
1 10
Ratio
0.60.81 1.21.4 1.6 1.82 2.22.4
(b)
= 7 TeV (Uncorrected) s
Data
PYTHIA ND SD DD
≥ 1 nch
| < 2.5, η > 500 MeV, | pT
ATLAS Preliminary
Fraction of Events
10-6
10-5
10-4
10-3
10-2
10-1
1 10 102
nsel
10 20 30 40 50 60 70 80 90
Ratio
0 0.2 0.4 0.6 0.8 1 1.2
Data Stat. Uncertainties MC / Data
nsel
10 20 30 40 50 60 70 80 90
Ratio
0 0.2 0.4 0.6 0.8 1 1.2
(c)
[ GeV ]〉 Tp〈
0.8 1 1.2 1.4 1.6 1.8
= 7 TeV (Uncorrected) s
Data
PYTHIA ND+SD+DD
≥ 1 nch
| < 2.5, η > 500 MeV, | pT
[ GeV ]〉 Tp〈
0.8 1 1.2 1.4 1.6 1.8
ATLAS Preliminary
nsel
10 20 30 40 50 60 70 80 90
Ratio
1
1.05 Data Stat. Uncertainties
MC / Data
nsel
10 20 30 40 50 60 70 80 90
Ratio
1 1.05
(d)
Figure 4: Uncorrected, detector level distributions of the track pseudo-rapidity (a) and transverse momen- tum (b) distributions, number of selected tracks per event (c) and the average track transverse momentum as a function of the number of tracks per event (d). The prediction fromPYTHIAis shown normalised to the number of events in the data. The total prediction is calculated as the sum of the non-diffractive (ND), single-diffractive (SD) and double-diffractive (DD). The ratio of the data to the simulation is shown as an inset with the statistical uncertainty on the data in green.
6
5 Analysis Procedure Overview
The analysis procedure has not changed since the previous analysis, and is thus not explained again here.
Only the components entering these corrections are briefly presented here. To obtain the charged particle multiplicity, the charged track spectra are corrected for each component of event and track selection.
The three major components are the trigger, vertex and track reconstruction efficiency. In addition, the multiplicity must be corrected for the contribution from secondaries and fakes.
5.1 Trigger Efficiency
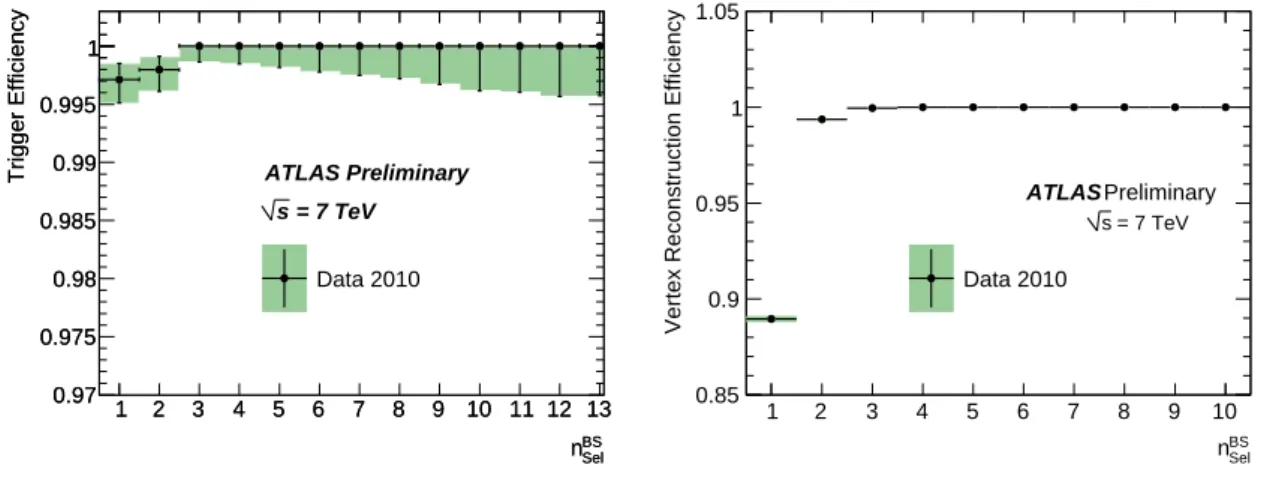
The efficiency of the single-arm MBTS trigger is determined from data using an orthogonal trigger. It consists of a random trigger that requires only the event to be coincident with colliding bunches and some minimal activity in the pixel and SCT detectors. The single-arm trigger used for this analysis is measured to be almost fully efficient. No significant dependence on pT,η orφwas observed. However the trigger is slightly less efficient for low multiplicity events, as shown in the left panel of Fig. 5. The trigger efficiency,εtrig(nBSsel), is quoted as being dependent on the number of tracks per event meeting all analysis selection requirements except for the cuts on the impact parameters with respect to the primary vertex (nBSsel). Instead, a cut at 4 mm is applied on thed0with respect to the beam spot .
BS
nSel
1 2 3 4 5 6 7 8 9 10 11 12 13
Trigger Efficiency
0.97 0.975 0.98 0.985 0.99 0.995 1
BS
nSel
1 2 3 4 5 6 7 8 9 10 11 12 13
Trigger Efficiency
0.97 0.975 0.98 0.985 0.99 0.995 1
Data 2010 ATLAS Preliminary
= 7 TeV s
BS
nSel
1 2 3 4 5 6 7 8 9 10
Vertex Reconstruction Efficiency
0.85 0.9 0.95 1 1.05
Data 2010
ATLAS Preliminary = 7 TeV s
Figure 5: The trigger efficiency (left) and the vertex reconstruction efficiency (right) as a function of the number of selected vertex tracks (nBSsel) at√
s=7 TeV. The total uncertainties on each point are shown as shaded boxes, the vertical error bars represent the statistical uncertainty.
5.2 Vertex Reconstruction Efficiency
The vertex reconstruction efficiency,εvtx(nBSsel,hηi)is also measured in data. The efficiency, shown in the right panel of Fig. 5, is calculated as a function ofnBSsel, the same track definition used to parametrize the trigger efficiency. With the new vertex reconstruction algorithm and the loosening of the track require- ment in the vertex from three to two, the efficiency is higher for low multiplicities. For events containing fewer than three selected tracks, the efficiency was found to depend on the pseudo-rapidity. Therefore the vertex reconstruction efficiency is corrected in bins ofη for such events, but not for higher multiplicity events.
5.3 Track Reconstruction Efficiency
The track reconstruction efficiency,εtrk(pT,η), is taken from the simulation, as for the previous analysis.
Studies are underway to estimate the tracking efficiency from data, but are not mature enough to be in- cluded in this analysis. Extensive comparisons between data and simulation were performed to establish that the simulation of the silicon detectors describes the data to high accuracy.
The track reconstruction efficiency at√
s=7 TeV, as determined from the simulation, is shown in Fig. 6. The content of these plots is identical to those shown in Fig. 14 but with the lower energy curve removed from the plot for clarity and the pTregion extended to the full range of this analysis.
η
-2 -1 0 1 2
Track Reconstruction Efficiency
0.4 0.5 0.6 0.7 0.8 0.9 1
ATLAS preliminary = 7 TeV s
ATLAS MC09
η
-2 -1 0 1 2
Track Reconstruction Efficiency
0.4 0.5 0.6 0.7 0.8 0.9 1
[GeV]
pT
0 10 20 30 40 50
Track Reconstruction Efficiency
0.4 0.5 0.6 0.7 0.8 0.9 1
ATLAS preliminary = 7 TeV
s
ATLAS MC09
[GeV]
pT
0 10 20 30 40 50
Track Reconstruction Efficiency
0.4 0.5 0.6 0.7 0.8 0.9 1
Figure 6: Track reconstruction efficiency as a function ofpTandηfor√
s=7 TeV. The total uncertainties on each point are shown as shaded boxes, the vertical error bars represent the statistical uncertainty.
5.3.1 Systematic Uncertainties on the Track Reconstruction Efficiency
The method used to extract the systematic uncertainties on the track reconstruction efficiency has re- mained unchanged, with the exception that because of the algorithm changes, there is no longer a sys- tematic uncertainty associated to the fact that the algorithm and analysis cuts were both at 500 MeV. A systematic uncertainty remains for the lowestpTbin due to the possible difference in resolution between data and Monte Carlo. A toy Monte Carlo was produced with very conservative 10% changes to the values of the resolution, yet the effect on the efficiency was only 1%, which is taken as a systematic on this first pTbin.
The systematic uncertainties due to the application of the various track reconstruction cuts is ob- tained, as for the previous analysis, by removing each cut in turn and comparing the observed effect between data and Monte Carlo. The difference between them is taken as the systematic associated to that cut. The total systematic associated to the track selection is taken as 1%.
The remaining sources of systematic were not re-evaluated for this analysis. Table 1 summarises the various contributions to the track reconstruction uncertainty and other sources of systematics uncertain- ties. The truth primary definition is the systematic associated to the criteria used to match a hadron level particle with a reconstructed track. The SCT extension efficiency is derived by comparing the fraction of pixel tracks that have an reconstructed extension in the SCT between data and Monte Carlo [1]. The fakes were again found to be negligible for this analysis.
8
Systematic Uncertainty Systematic
Truth Primary Definition ±0.4%
Track Selection ±1%
Material ±3%
Alignment ±1%
SCT Extension ±6%(2.2<|η|<2.5)
±4%(1.6<|η|<2.2)
Particle Composition ±0.2%
Resolution ±1%(0.5<pT<0.6 GeV) Total
3.8 % (pT>0.6 GeV,η=0) 3.9 % (0.5<pT<0.6 MeV,η=0) 7.1 % (pT>0.6 MeV, 2.4<η<2.5)
Table 1: The systematic uncertainties on the tracking efficiency. All uncertainties are quoted relative to the track reconstruction efficiency except for the uncertainty due to the material which is absolute.
5.4 Estimation of the Fraction of Tracks Originating from Secondary Interactions Despite the impact parameter and pixel hit cuts, a small number of secondary particles, produced from the decays of primary particles, pass the track selection cuts. The number of secondary particles is estimated comparing the tails of the impact parameter distribution for primaries and secondaries in data and in simulation. Thed0 distribution in data is shown in Fig. 7. The red and green histograms show the contributions from primaries and secondaries, respectively, after fitting the side-bands; the fit is performed in the region 2.0<|d0|<8.0 mm. The scale factor between data and simulation was found to be consistent with unity.The fraction of secondaries within the impact parameter cut was thus found to be(2.25±0.02(stat)±0.11(syst))%. A smallηdependence of the rate was found but it is within the systematic uncertainties and is not considered explicitly in the corrections.
0[mm]
d
-10 -8 -6 -4 -2 0 2 4 6 8 10
events
102
103
104
105
106
Secondaries Primaries Data
0[mm]
d
-10 -8 -6 -4 -2 0 2 4 6 8 10
events
102
103
104
105
106
ATLAS Preliminary
Figure 7: Thed0distribution used to estimate the contribution from secondaries. The contribution from secondary charged particles is shown in shaded green, the sum of the primary and secondary particles is shown in red and compared to the data (black points). The primary and secondary track distributions are obtained from Monte Carlo.
6 Results
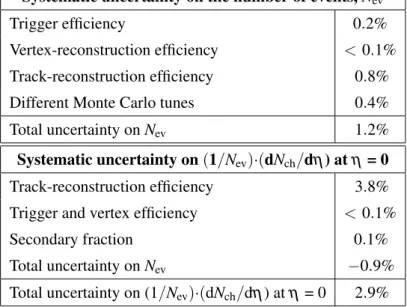
The summary of the systematic uncertainties considered for this analysis are shown in Tab. 2. The largest systematics come from the measurement of the track reconstruction efficiency.
Systematic uncertainty on the number of events,Nev
Trigger efficiency 0.2%
Vertex-reconstruction efficiency <0.1%
Track-reconstruction efficiency 0.8%
Different Monte Carlo tunes 0.4%
Total uncertainty onNev 1.2%
Systematic uncertainty on(1/Nev)·(dNch/dη) atη= 0
Track-reconstruction efficiency 3.8%
Trigger and vertex efficiency <0.1%
Secondary fraction 0.1%
Total uncertainty onNev −0.9%
Total uncertainty on (1/Nev)·(dNch/dη) atη= 0 2.9%
Table 2: Summary of systematic uncertainties on the number of events,Nev, and on the charged-particle density(1/Nev)·(dNch/dη)atη = 0. The uncertainty onNevis anticorrelated with dNch/dη. All other sources are assumed to be uncorrelated.
The corrected distributions of primary charged particles for√
s=7 TeV with pT>500 MeV and
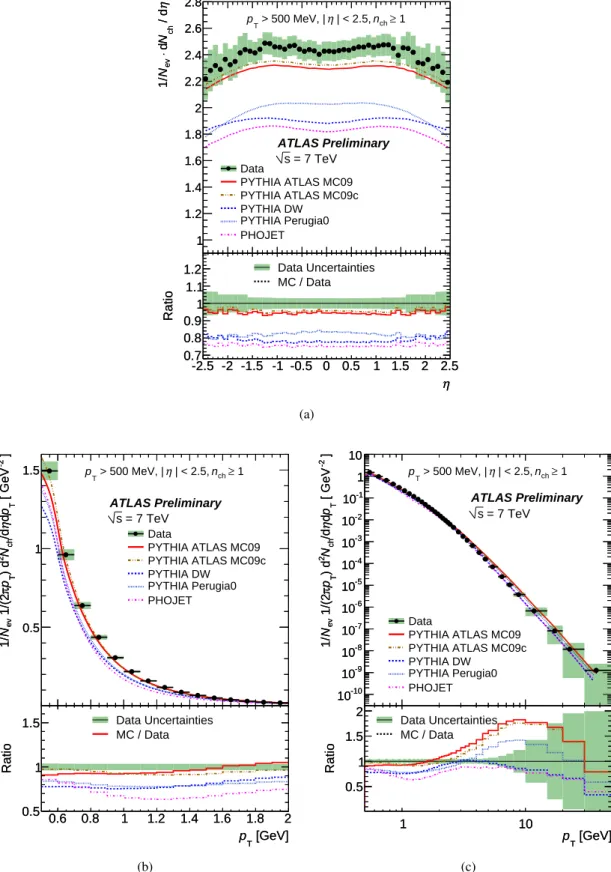
|η|<2.5 for events withnch≥1 are shown in Fig. 8 and 9. They are presented as inclusive-inelastic distributions with minimal model-dependent corrections to facilitate model comparison.
The charged particle pseudo-rapidity density is shown in Fig. 8(a). The average value is 2.418± 0.004(stat.)±0.076(syst.)charged particles per event and unit of pseudo-rapidity in the range|η|<0.2, interpreted as the result atη = 0. The predictions by various Monte Carlo models are all 5-20% lower than observed. The distribution is best described by the ATLAS MC09c tune which has the same shape but is about 5% lower. None of the models are able to describe the data precisely over the whole pT spectrum.
The charged particle pT density is shown in Figs. 8(b) and 8(c) in linear and log-log scales. The data span over eight orders of magnitude. The spectrum is well described by ATLAS MC09 tune up to 2 GeV, but predicts a significantly harder spectrum at higher pT. It is interesting to note that allPYTHIA
tunes based on the pTordered shower (MC09, MC09c, Perugia0 tunes ofPYTHIA) have a similar shape and a harder spectrum, while the tune based on the virtuality ordered shower (DW tune ofPYTHIAand
PHOJET) reproduces the full spectrum within 20%.
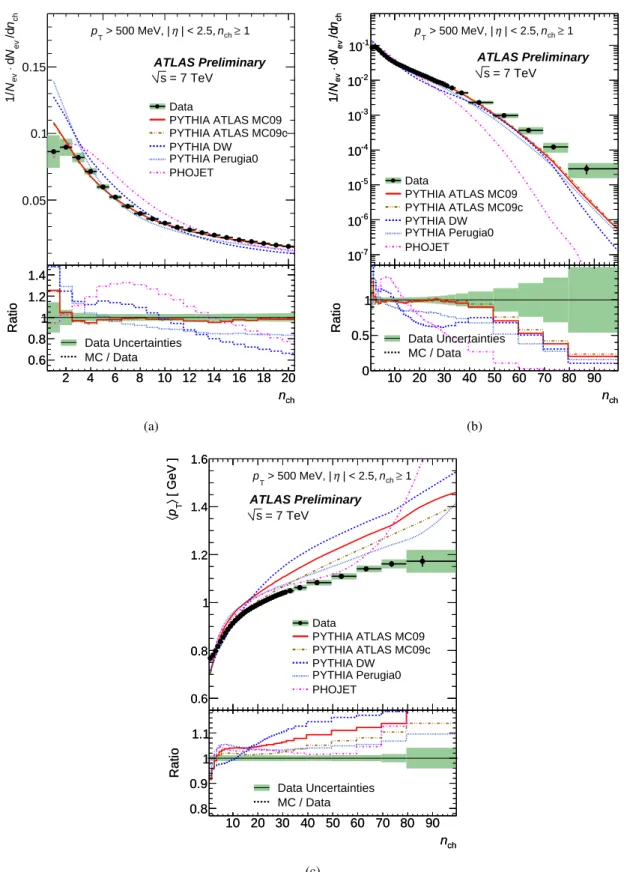
The multiplicity distribution as a function ofnchis shown in Fig. 9(a) and 9(b). The distribution is well described by the ATLAS MC09PYTHIAtune fornch>5 up tonch∼50. The excess of the model over data at lower nch is highly influenced by the modelling of diffractive events in the Monte Carlo predictions. At multiplicities ofnch>50 the data exceedPYTHIAtunes by about 70%. PHOJETfails to describe this distribution abovench∼30.
The averagepTas a function ofnchis shown in Fig. 9(c). This variable was relatively well described by the Monte Carlo at 900 GeV. The distribution is described by PHOJET within 3% up to nch ∼60
10
where the model shows a sudden rise which is not seen in the data. From thePYTHIA tunes, Perugia0 and ATLAS MC09c describe it within 6% up tonch∼70.
Figure 10 shows the comparison of the four observables comparing the published 900 GeV data to the 7 TeV data. The choice of binning was kept identical to the old analysis, but the range was increased for the higher centre of mass energy.
The average charged particle multiplicity extrapolated toη=0.0 is shown as a function of the centre of mass energy in Fig. 11. The energy dependence of the multiplicity is described within 5% by the ATLAS MC09 tune of PYTHIA. This distribution is highly sensitive to the pminT cut-off of multiple interactions in thePYTHIA model. In that respect it is interesting to note that thePYTHIAtunes shown here vary significantly in this distribution even though they use very similar values for this cut-off.
7 Conclusions
Charged-particle multiplicity measurements with the ATLAS detector using the first√
s=7 TeV colli- sions delivered by the LHC during 2010 are presented. Based on over three hundred thousand proton- proton inelastic interactions, the properties of events with at least one primary charged particle produced within the kinematic range |η|<2.5 and pT >500 MeV were studied. The data were corrected with minimal model dependence to obtain inclusive distributions. The charged-particle multiplicity per event and unit of pseudo-rapidity atη=0 is measured to be 2.418±0.004(stat.)±0.076(syst.). The selected kinematic range and the precision of this analysis highlight clear differences between Monte Carlo mod- els and the measured distributions. The rise in charged particle multiplicity as a function of√
sis slightly larger than predicted byPYTHIAusing different tunes. Differences in shapes and normalisation are ob- served when comparing√
s=900 GeV to√
s=7 TeV.
These measurements increase our knowledge of high-energy hadronic collisions. Current models, as fitted to data from previous experiments and encoded in general-purpose Monte Carlo programs, are compared to the data. Some refitting of these models, using these data, will be needed to improve the description, particularly in the pT and multiplicity distributions. However, the fact that the ATLAS MC09PYTHIAtune agrees with the data to within about 10% in the average multiplicity indicates that the models are sufficient to provide a reasonable understanding of the hadronic environment in 7 TeV collision events.
η / d chN d⋅evN1/
1 1.2 1.4 1.6 1.8 2 2.2 2.4 2.6 2.8
≥ 1 nch
| < 2.5, η > 500 MeV, | pT
Data
PYTHIA ATLAS MC09 PYTHIA ATLAS MC09c PYTHIA DW
PYTHIA Perugia0 PHOJET
ATLAS Preliminary = 7 TeV
s η / d chN d⋅evN1/
1 1.2 1.4 1.6 1.8 2 2.2 2.4 2.6 2.8
η -2.5 -2 -1.5 -1 -0.5 0 0.5 1 1.5 2 2.5
Ratio
0.7 0.8 0.9 1 1.1
1.2 Data Uncertainties
MC / Data
η -2.5 -2 -1.5 -1 -0.5 0 0.5 1 1.5 2 2.5
Ratio
0.7 0.8 0.9 1 1.1 1.2
(a)
]-2 [ GeV Tpdη/dchN2) d Tpπ 1/(2evN1/
0.5 1
1.5 > 500 MeV, | η | < 2.5, nch≥ 1 pT
Data
PYTHIA ATLAS MC09 PYTHIA ATLAS MC09c PYTHIA DW
PYTHIA Perugia0 PHOJET ATLAS Preliminary
= 7 TeV s ]-2 [ GeV Tpdη/dchN2) d Tpπ 1/(2evN1/
0.5 1 1.5
[GeV]
pT
0.6 0.8 1 1.2 1.4 1.6 1.8 2
Ratio
0.5 1
1.5 Data Uncertainties
MC / Data
[GeV]
pT
0.6 0.8 1 1.2 1.4 1.6 1.8 2
Ratio
0.5 1 1.5
(b)
]-2 [ GeV Tpdη/dchN2 ) d Tpπ 1/(2evN1/
10-10
10-9
10-8
10-7
10-6
10-5
10-4
10-3
10-2
10-1
1 10
≥ 1 nch
| < 2.5, η > 500 MeV, | pT
Data
PYTHIA ATLAS MC09 PYTHIA ATLAS MC09c PYTHIA DW
PYTHIA Perugia0 PHOJET ]-2 [ GeV Tpdη/dchN2 ) d Tpπ 1/(2evN1/
10-10
10-9
10-8
10-7
10-6
10-5
10-4
10-3
10-2
10-1
1 10
ATLAS Preliminary = 7 TeV
s
[GeV]
pT
1 10
Ratio
0.5 1 1.5
2 Data Uncertainties MC / Data
[GeV]
pT
1 10
Ratio
0.5 1 1.5 2
(c)
Figure 8: Charged-particle multiplicities for events with nch ≥1 within the kinematic range pT ≥ 500 MeV and |η|<2.5 at√
s=7 TeV. The panels show the charged particle multiplicity as a func- tion of the pseudo-rapidity (a), and transverse momentum (b,c). The dots represent the data and the curves the predictions from different Monte Carlo models. The vertical bars represent the statistical un- certainties, while the shaded areas show statistical and systematic uncertainties added in quadrature. The values of the ratio histograms refer to the bin centroids.12
chn/dev N d⋅evN1/
0.05 0.1 0.15
≥ 1 nch
| < 2.5, η > 500 MeV, | pT
Data
PYTHIA ATLAS MC09 PYTHIA ATLAS MC09c PYTHIA DW
PYTHIA Perugia0 PHOJET
ATLAS Preliminary = 7 TeV
s
nch
2 4 6 8 10 12 14 16 18 20
Ratio
0.6 0.8 1 1.2 1.4
Data Uncertainties MC / Data
nch
2 4 6 8 10 12 14 16 18 20
Ratio
0.6 0.8 1 1.2 1.4
(a)
chn/dev N d⋅evN1/
10-7
10-6
10-5
10-4
10-3
10-2
10-1
≥ 1 nch
| < 2.5, η > 500 MeV, | pT
Data
PYTHIA ATLAS MC09 PYTHIA ATLAS MC09c PYTHIA DW
PYTHIA Perugia0 PHOJET
ATLAS Preliminary = 7 TeV
s
chn/dev N d⋅evN1/
10-7
10-6
10-5
10-4
10-3
10-2
10-1
nch
10 20 30 40 50 60 70 80 90
Ratio
0 0.5 1
Data Uncertainties MC / Data
nch
10 20 30 40 50 60 70 80 90
Ratio
0 0.5 1
(b)
[ GeV ]〉 Tp〈
0.6 0.8 1 1.2 1.4 1.6
≥ 1 nch
| < 2.5, η > 500 MeV, | pT
Data
PYTHIA ATLAS MC09 PYTHIA ATLAS MC09c PYTHIA DW
PYTHIA Perugia0 PHOJET [ GeV ]〉 Tp〈
0.6 0.8 1 1.2 1.4 1.6
ATLAS Preliminary = 7 TeV
s
nch
10 20 30 40 50 60 70 80 90
Ratio
0.8 0.9 1 1.1
Data Uncertainties MC / Data
nch
10 20 30 40 50 60 70 80 90
Ratio
0.8 0.9 1 1.1
(c)
Figure 9: Charged-particle multiplicities for events with nch ≥1 within the kinematic range pT ≥ 500 MeV and |η|<2.5 at √
s=7 TeV. The panels show the charged particle multiplicity (a,b), and
η -2.5 -2 -1.5 -1 -0.5 0 0.5 1 1.5 2 2.5 η / d chN d⋅evN1/
0.5 1 1.5 2 2.5 3
ATLAS Preliminary = 7 TeV s Data
= 900 GeV s
Data
≥ 1 nch
| < 2.5, η > 500 MeV, | pT
η -2.5 -2 -1.5 -1 -0.5 0 0.5 1 1.5 2 2.5 η / d chN d⋅evN1/
0.5 1 1.5 2 2.5 3
(a)
[GeV]
pT
0 5 10 15 20 25 30 35 40 45 50 ]-2 [ GeV Tpdη/dchN2 ) d Tpπ 1/(2evN1/
10-10
10-9
10-8
10-7
10-6
10-5
10-4
10-3
10-2
10-1
1 10
ATLAS Preliminary = 7 TeV s Data
= 900 GeV s
Data
≥ 1 nch
| < 2.5, η > 500 MeV, | pT
[GeV]
pT
0 5 10 15 20 25 30 35 40 45 50 ]-2 [ GeV Tpdη/dchN2 ) d Tpπ 1/(2evN1/
10-10
10-9
10-8
10-7
10-6
10-5
10-4
10-3
10-2
10-1
1 10
(b)
nch
0 20 40 60 80 100
chn/dev N d⋅evN1/
10-6
10-5
10-4
10-3
10-2
10-1
1
ATLAS Preliminary = 7 TeV s Data
= 900 GeV s
Data
≥ 1 nch
| < 2.5, η > 500 MeV, | pT
nch
0 20 40 60 80 100
chn/dev N d⋅evN1/
10-6
10-5
10-4
10-3
10-2
10-1
1
(c)
nch
0 10 20 30 40 50 60 70 80 90 100 [ GeV ]〉 Tp〈
0.8 0.9 1 1.1 1.2 1.3 1.4 1.5
ATLAS Preliminary = 7 TeV s Data
= 900 GeV s
Data
≥ 1 nch
| < 2.5, η > 500 MeV, | pT
nch
0 10 20 30 40 50 60 70 80 90 100 [ GeV ]〉 Tp〈
0.8 0.9 1 1.1 1.2 1.3 1.4 1.5
(d)
Figure 10: Charged-particle multiplicities for events with nch ≥1 within the kinematic range pT ≥ 500 MeV and|η|<2.5 at√
s=7 TeV compared to the published results at√
s=900 GeV. The panels compare the charged-particle multiplicities as a function of pseudo-rapidity (a) and of the transverse momentum (b), the charged-particle multiplicity (c), and the average transverse momentum as a function of the number of charged particles in the event (d). The closed and open dots represent the data at
√s=7 TeV and√
s=900 GeV, respectively. The vertical bars represent the statistical uncertainties, while the shaded areas show statistical and systematic uncertainties added in quadrature.
14
[GeV]
s
102 103 104
η
/ d chN d⋅evN1/0.5 1 1.5 2 2.5 3 3.5
≥ 1 nch
= 0, η > 500 MeV, pT
ATLAS Preliminary PYTHIA ATLAS MC09 PYTHIA DW
PYTHIA Perugia0 Data
Figure 11: The average charged particle multiplicity per unit of rapidity forη=0 for events withnch≥1 within the kinematic range pT≥500 MeV and|η|<2.5 as a function of the centre of mass energy.
A Validation of the New Configuration
In order to verify that this new setup is well understood, the 900 GeV results are re-reconstructed using the new setup, all corrections are re-calculated and the new results are compared to the published results.
Figure 12 shows this comparison for the four final distributions. The observed distributions are consistent with the published results.
B Comparison Between 900 GeV and 7 TeV Data
This appendix shows some basic comparisons between 900 GeV and 7 TeV data and Monte Carlo where the 900 GeV data were reconstructed with the new setup.
In Fig. 13 the number of inner detector hits on track is compared between the 900 GeV and 7 TeV samples for the Pixel (left) and SCT (right) detectors. These distributions are only dependent on the detector conditions. The number of hits for the SCT agrees well, and the mean number of pixel hits has increased. The increase in the number of pixel hits is due to the fact that more modules were operational in the 2010 data.
Figure 14 shows the comparison between energies of the primary track reconstruction efficiency as a function ofη andpT. For the same phase-space, the reconstruction efficiency should not depend on the centre-of-mass energy. The pTspectrum is harder at the higher centre-of-mass energy, thus we expect a slight increase in the average efficiency, integrated over the whole sample; it indeed increases by 0.6%
compared to√
s=900 GeV. This small increase is more visible in certain regions ofηdue to the track pTandη correlations. The actual efficiency parametrisation used in the corrections is in bothηandpT and there no significant changes were observed.
References
[1] The ATLAS Collaboration,Charged-particle multiplicities in pp interactions at√
s=900GeV measured with the ATLAS detector at the LHC,arXiv:1003.3124 [hep-ex].
[2] V. Khachatryan et al.,Transverse momentum and pseudorapidity distributions of charged hadrons in pp collisions at√
s = 0.9 and 2.36 TeV, JHEP02(2010) 041,arXiv:1002.0621 [hep-ex].
[3] K. Aamodt et al.,First proton–proton collisions at the LHC as observed with the ALICE detector:
measurement of the charged particle pseudorapidity density at√
s=900 GeV, Eur. Phys. J.C65 (2010) 111–125,arXiv:0911.5430 [hep-ex].
[4] T. Aaltonen et al.,Measurement of Particle Production and Inclusive Differential Cross Sections in pp Collisions at¯ √
s=1.96 TeV, Phys. Rev.D79(2009) 112005,arXiv:0904.1098 [hep-ex].
[5] T. Alexopoulos et al.,Multiplicity dependence of transverse momentum spectra of centrally produced hadrons inpp collisions at 0.3 TeV, 0.54 TeV, 0.9 TeV, and 1.8 TeV center-of-mass¯ energy, Phys. Lett.B336(1994) 599–604.
[6] C. Albajar et al.,A Study of the General Characteristics of pp Collisions at¯ √
s = 0.2 TeV to 0.9 TeV, Nucl. Phys.B335(1990) 261.
[7] F. Abe et al.,√ Pseudorapidity distributions of charged particles produced in pp interactions at¯ s=630 GeV and 1800 GeV, Phys. Rev.D41(1990) 2330.
[8] R. E. Ansorge et al.,Charged particle multiplicity distributions at 200 and 900 GeV c.m. energy, Z. Phys.C43(1989) 357.
16
[9] R. E. Ansorge et al.,Charged particle correlations in pp collisions at c.m. energies of 200, 546,¯ and 900 GeV, Z. Phys.C37(1988) 191–213.
[10] F. Abe et al.,Transverse momentum distributions of charged particles produced inpp interactions¯ at√
s=630 GeV and 1800 GeV, Phys. Rev. Lett.61(1988) 1819.
[11] G. J. Alner et al.,UA5: A general study of proton-antiproton physics at√
s = 546 GeV, Phys.
Rept.154(1987) 247–383.
[12] R. E. Ansorge et al.,Diffraction dissociation at the CERN pulsed pp collider at c.m. energies of¯ 900 and 200 GeV, Z. Phys.C33(1986) 175.
[13] A. Breakstone et al.,Charged Multiplicity Distribution in pp Interactions at ISR Energies, Phys.
Rev.D30(1984) 528.
[14] G. Arnison et al.,Transverse Momentum Spectra for Charged Particles at the CERN Proton anti-Proton Collider, Phys. Lett.B118(1982) 167.
[15] G. Piacquadio, K. Prokofiev, and A. Wildauer,Primary vertex reconstruction in the ATLAS experiment at LHC, J. Phys. Conf. Ser.119(2008) 032033.
[16] G. Aad et al. (The ATLAS Collaboration),ATLAS Monte Carlo Tunes for MC09, . ATL-PHYS-PUB-2010-002.
[17] A. Sherstnev and R. S. Thorne,Parton Distributions for LO Generators, Eur. Phys. J.C55(2008) 553–575,arXiv:0711.2473 [hep-ph].