LOOKING AT OUR GALAXY WITH THE MAGIC EYE
D. HADASCH FOR THE MAGIC COLLABORATION Grup de F´ısica de les Radiacions, Universitat Aut` onoma de Barcelona,
E-08193 Bellaterra
The MAGIC telescope located on the Canary Island of La Palma is a single-dish imaging atmospheric Cherenkov telescope. With a sensitivity in the 25 GeV - 30 TeV energy band it is best suited for studying very high energy γ-ray sources in the Northern hemisphere. Here we give an overview of the most recent experimental results on Galactic sources obtained with MAGIC. These include pulsars, binary systems, supernova remnants and unidentified sources.
1 What is the MAGIC eye and what does it see?
The study of very high energy (VHE, E ≥ 70 GeV) γ-ray emission from objects in our galaxy is one of the major goals of ground-based γ-ray astronomy and one of the main issues of the Major Atmospheric Gamma Imaging Cherenkov (MAGIC) telescope located on the Canary Island of La Palma on the Roque de los Muchachos Observatory at 2250 m above see level. Its energy range spans from 50 GeV-60 GeV (trigger threshold at small zenith angles) and with a special low-energy trigger even from 25 GeV up to tens of TeV thanks to a number of technological improvements in its design. The energy resolution is better than 20% above an energy of 200 GeV. The telescope has a sensitivity of
∼ 1.6% of the Crab Nebula flux in 50 observing hours. From summer 2009 on a second MAGIC telescope will allow stereoscopic observations. So the sensitivity will be increased substantially and make a deeper view in our galaxy possible.
MAGIC contributes to several fields of fundamental physics and astro- physics. It observes galactic and extragalactic objects and is active in search of Dark Matter. In this paper we highlight our latest contributions to Galactic astrophysics. Up to now MAGIC discovered four new VHE γ-ray sources in our galaxy and studied in detail eight of the previously known (see 1 for references).
The results from extragalactic observations as well as the results of the Crab Nebula and the Crab pulsar are presented elsewhere in these proceedings 2 , 3 .
Cassiopeia A The shell type supernova remnant (SNR) Cassiopeia A located
at a distance of ∼3.4 kpc was discovered by HEGRA at TeV energies after
232 hrs of observation time. Eight years later MAGIC observed the source
between July 2006 and January 2007 for a total of 47 good-quality hours. The
observation resulted in the confirmation of the the HEGRA detection with a significance of 5.2 σ and a photon flux above 1 TeV of (7.3 ± 0.7 stat ± 2.2 sys ) × 10 −13 cm −2 s −1 . The spectrum is consistent with that measured by HEGRA for the energies above 1 TeV, i.e., where they overlap (see figure 1). The photon spectrum is compatible with a power law d E d d N A d t ∝ E −Γ with a photon index Γ = 2.3 ± 0.2 stat ± 0.2 sys . Furthermore, MAGIC significantly extends the energy spectrum down to about 250 GeV. The source is point-like within the angular resolution of the telescope. According to the theoretical modeling of Cassiopeia A’s multi-frequency emission leptonic models of TeV emission can be disfavored because they require too low magnetic field values for the low frequency part of the spectrum. A hadronic scenario 6 for the γ-ray production seems likely.
However, it predicts for the 100 GeV - 10 TeV region a harder spectrum than the measured one (see fig. 1).
log(Energy) [eV]
7 8 9 10 11 12 13 14
]
-1s
-2Energy*Flux [TeV cm
10
-1510
-1410
-1310
-1210
-11π
oNB
IC
Crab Nebula HEGRA IACT System MAGIC 2006 EGRET Whipple CAT
Figure 1: Spectra of Cas A as measured by MAGIC. The upper limits given by Whipple, EGRET and CAT are also indicated, as well as the HEGRA detection. The MAGIC and HEGRA spectra are shown in the context of
the model by 6 .
l [deg]
b [deg]
2.6 2.8 3 3.2 3.4
sr
-5excess events / 10
-20 0 20 40 60 80 100 120 140 160
188.5 189
189.5
PSF
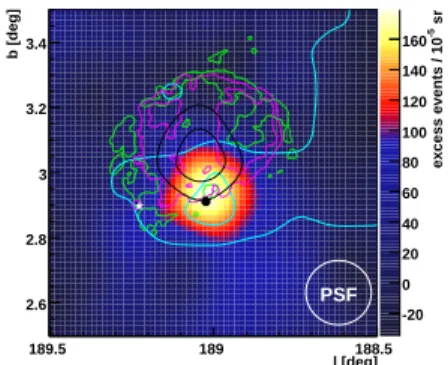
Figure 2: Sky map in direction of MAGIC J0616+225. Overlayed: 12 CO emission contours (cyan), contours of 20 cm VLA radio data (green), X-ray contours (purple), γ-ray contours (black) from EGRET. White star: position of pul- sar CXOU J061705.3+222127. Black dot:
position of 1720 MHz OH mase.
MAGIC J0616+225/ IC 443 In 2007 MAGIC discovered a new source of VHE γ-ray emission, MAGIC J0616+225, located close to the Galactic Plane after an effective observation time of 29 hrs with a significance of 5.7 σ. The measured energy spectrum is well fitted by the following power law: d E d d N A d t = (1.0 ± 0.2) × 10 −11 (E/0.4TeV) −3 . 1±0 . 3 TeV −1 cm −2 s −1 . The source is a point-like source for MAGIC, spatially coincident with the SNR IC 443, a molecular 5 cloud and the location of maser emission 7 (see fig. 2), what suggest that a hadronic origin of the VHE γ -rays is likely.
Wolf-Rayet Binary Systems Wolf-Rayet stars represent an evolved stage
of hot (T eff > 20000K), massive stars and are characterized by their strong
winds with a velocity up to 5000 km/s and by their highest known mass loss rate
M ˙ ∼ 10 −4 ...10 −5 M ⊙ /yr. Colliding winds are theoretically predicted to produce
VHE γ-rays through leptonic or hadronic processes, although the evidence of
this relationship has proven to be elusive so far. After the observation of the
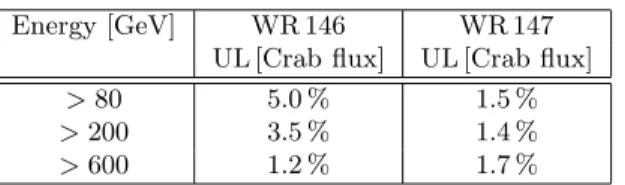
two isolated binary systems WR 146 and WR 147 containing a Wolf-Rayet star and a O8-star or a B0.5V-star, MAGIC presented the first experimental limits on these objects after 30.3 hrs and 44.5 hrs, respectively (see figure 3). These limits are shown in figure 4 for the case of WR 147, compared with a theoretical model 8 .
Energy [GeV] WR 146 WR 147
UL [Crab flux] UL [Crab flux]
> 80 5.0 % 1.5 %
> 200 3.5 % 1.4 %
> 600 1.2 % 1.7 %
Figure 3: Calculated upper limits above a certain energy for two Wolf-Rayet binary systems.
(E/MeV) Log
10-2 -1 0 1 2 3 4 5 6 7
)
-1s
-2N/erg cm
2(E
10Log
-15 -14 -13 -12 -11 -10 -9 -8
MAGIC Phase = 0.5 Phase = 0.25, 0.75 Phase = 0
WR 147
Figure 4: Inverse Compton (IC) spectra of WR 147 for orbital phases 0, 0.25, 0.5 and 0.75 together with MAGIC experi-
mental upper limits.
Cygnus X-1 Cygnus X-1 consists of a black hole turning around an O-type star and is one of the brightest X-ray sources in the sky. During one night (24th Sept 2006) MAGIC observed a hint of a signal from Cygnus X-1 on the level of 4.1 σ (after trials), which seems to be unrelated with the nearby radio structure (see fig. 5). The observed hint of the VHE emission is in coincidence with a historically high flux in X-rays 9 . In total the source was observed for 40 hrs in 26 nights between June and November 2006 and no steady γ -ray signal was detected. MAGIC observations have imposed the first limits to the steady γ-ray emission from this object at the level of 1 % of the Crab Nebula flux above
∼ 500 GeV.
LS I +61 ◦ 303 LS I +61 ◦ 303 is a γ-ray binary discovered by MAGIC at TeV energies at a distance of ∼ 2 kpc. It consists of an unknown compact object (a neutron star or a black hole) orbiting a Be star and displays periodic emission throughout the spectrum from radio to X-ray wavelengths. To test for possible periodic structures in the VHE γ-ray light curve, we apply the formalism developed by Lomb and Scargle to the data taken in 2005 and 2006.
We found a period of (26.8 ± 0.2) days (with a post-trial chance probability of 10 −7 ), close to the orbital period (see fig. 6). This result is compatible with the orbital periodicity measured at other wavelengths. The peak of the emission is found always at orbital phases around 0.6-0.7. During December 2006 we detected a secondary peak at phase 0.8-0.9.
TeV J2032+4130 The first known VHE γ-ray emitting unidentified source,
TeV J2032+4130, was discovered by HEGRA six years ago. MAGIC observed
DEC
o
50’
34
o00’
35
o10’
35
o20’
35
o30’
35
o40’
35
-5 0 5 10 15 20
RA 56
m19
h57
m19
h58
m19
h59
m19
h00
m20
hWeighted excess events
PSF
MAGIC Cygnus X-1
2006-09-24
Figure 5: Sky map of Cygnus X-1 corre- sponding to the flare detected on 2006-09- 24. The cross shows the best-fit position of the γ-ray source. The position of the X-ray source and radio emitting ring-like are marked by the star and contour, re-
spectively.
=0.0377 day
-1ν
0o
303
LS I+61
-1
] Frequency [day
0.03 0.04
Power
0 10 20
IFS
Off data
sinusoidal subtraction sinusoidal+Gaussian subtraction
-1