**FULL TITLE**
ASP Conference Series, Vol. **VOLUME**, **YEAR OF PUBLICATION**
**NAMES OF EDITORS**
The June 2008 flare of Markarian 421 from optical to TeV energies
I. Donnarumma, J. Grube, C. M. Raiteri, S. Vercellone, M. Villata, R.M. Wagner, for the AGILE and GASP-WEBT teams and the MAGIC and VERITAS collaborations
Mrk 421 is one of the best studied BLlac objects in the UV and X-ray energy bands. It is also the first object detected at E > 500 GeV (Punch et al.
1992). It has the typical Spectral Energy Distribution (SED) of the High energy peaked BL Lac objects (Padovani & Giommi 1995). The SEDs of HBLs typically appear double-peaked in a νF ν representation, with a synchrotron peak at soft X-rays and a second high energy component peaking at GeV-TeV energies. The GeV-TeV peak is commonly interpreted as inverse-Compton scattering of the synchrotron photons by the same population of relativistic electrons (Maraschi et al. 1999); this scenario is supported by the observed correlated X-ray/TeV variability (Fossati et al. 2008, Wagner et al. 2008). As an alternative, the hadronic scenario (Aharonian 2000, M¨ ucke et al. 2003) invokes proton-initiated cascades and/or proton-synchrotron emission to account for the GeV-TeV peak;
it predicts no correlation between X-ray and TeV variability.
Here we present optical, X-ray, high-energy and very-high energy gamma- ray observations of Mrk 421 taken between 2008 May 24-June 23.
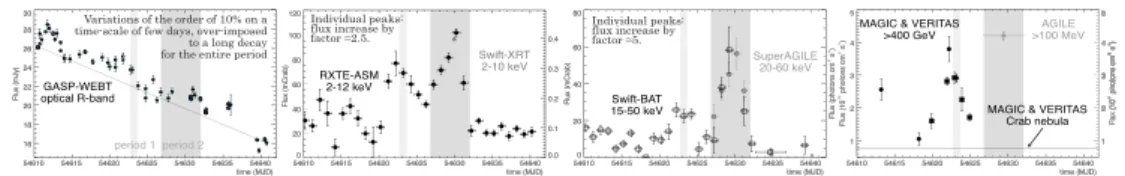
AGILE observations During June 2008 AGILE (Tavani et al. 2009) detected a flare of Mrk 421 in the energy range 20-60 keV with its hard X-ray monitor, SuperAGILE (Feroci et al. 2007). The source was detected at a flux of ∼ 30 mCrab that is ∼ 1 order of magnitude greater than the one in quiescence state.
In the following days, its flux increased up to ∼ 55 mcrab (see gray points in Fig.
1, 3rd panel from left). The hard X-ray data were complemented by Swift/BAT (15-50 keV) data which clearly showed that SuperAGILE detected the maximum brightness of the flare. Mrk 421 was also detected by AGILE-GRID in the energy range 100 MeV-10 GeV with a 5 days integration time. The measured flux was (42 ± 13) × 10
−8photons cm
−2s
−1.
Swift observations 5 ks ToO observations between 2008 June 12 and 13 were used for fitting a spectrum in the energy range 0.7-9.0 keV. A XRT - Su- perAGILE fit, using a log-parabolic model (F (E) = KE
−a−blog(E), see Massaro et al. 2004), resulted in the following values of its parameters a = 1.65 ± 0.012, b = 0.37 ± 0.010. These values implied a peak energy ∼ 3 keV, F(2-10 keV)
= 2.56 × 10
−9erg cm
−2s
−1and F(20-60 keV)=5.7 × 10
−10erg cm
−2s
−1. The RXTE All-Sky Monitor data were used to complement the Swift observations.
These showed (2nd panel in Fig. 1) that Swift catched the maximum brightness of the source in soft X-rays.
GASP-WEBT and UVOT observations Mrk 421 is one of the 28 blazars monitored by the GLAST-AGILE Support Program (GASP; Villata et al. 2008) of the whole Earth Blazar Telescope (WEBT). In Fig. 1, 1st panel, we show the R-band optical light curve between 2008 May 31 - June 24. During the Swift
1
2
pointing on June 12-13, the UVOT instrument also observed Mrk 421 in the UVW1 and UVW2 photometric bands.
TeV observations Mrk 421 was monitored by the VERITAS (Arizona, USA;
Acciari et al. 2008) and MAGIC (Canary islands, Spain; Baixeras et al. 2008) telescope systems for 1.17h and 2.95h, respectively, from May 27 to June 8.
Later observations were not possible because of moonlight. The object was clearly detected during each nightly observation, with a total significance of 44 sigma (VERITAS) and 66 sigma (MAGIC). The combined integral flux E > 400 GeV shows a transient peak near MJD 54622 (4th panel in Fig. 1).
Figure 1. from left to right: Optical-R light curve from GASP-WEBT in the period May 31-June 24; RXTE/ASM light curve over the same period; SuperAGILE (gray circles) and BAT (empty black squares); AGILE and TeV data (black squares and circles, MAGIC and VERITAS respectively).
Mrk 421 showed variability patterns across the optical, the X-ray and the high energy parts of the spectrum. We considered two possible scenarios to interpret this variability. The first (A) invokes a hardening of the electrons distribution caused by particle acceleration, which predicts a comparable X- ray and TeV variations because of the Klein-Nishina regime. The second (B) requires a change of the comoving particle density, as a consequence of additional particle injection/loss by shock processes; in this case a larger flux variability at TeV energies than in the X-rays (∆F/F larger by factor 2) is expected. Our data appear to support case (A). However, the long-term decay observed in optical, but not in X-rays/TeV could open a different scenario in which the emissions may originate from different regions of the jet. Finally, the 2-10 keV flux measured by XRT on June 12-13, ∼ 2.6 × 10
−9erg cm
−2s
−1, is higher than all previous observations (Fossati et al. 2008, Lichti et al. 2008) and the derived peak synchrotron energy of ∼ 3 keV is higher than typical values of 0.5-1 keV for this source. See Donnarumma et al. 2009 for a deeper discussion.
References
Acciari, V. A. et al. (VERITAS Collab.) 2008, ApJ, 679, 1427 Aharonian, F. A. 2000, NewA,5, 377
Baixeras, C. et al., 2004, Nucl. Instrum. Meth. A, 518, 188 Donnarumma, I. et al. 2009, ApJ691L, 13
Feroci, M., Costa, E., Soffitta, P., et al. 2007, Nucl. Instrum. Meth. A,581, 728 Fossati, G., Buckley, J. H., Bond, I. H., et al. 2008, ApJ,677, 906
Lichti, G. G., Bottacini, E., Ajello, M., et al. 2008, A&A, 486, 721 Maraschi, L., Fossati, G., Tavecchio, F. et al. 1999, ApJ, 526L, 81M Massaro, E., Perri, M., Giommi, P. et al. 2004, A&A, 422, 103 M¨ucke, A., Protheroe, R. J., Engel, R., et al. 2003, APh,18, 593 Padovani, P. & Giommi, P. 1995, ApJ, 444, 567
Punch, M., Akerlof, C. W., Cawley, M. F., et al. 1992, Nat,358, 477 Tavani et al. 2009, A&A, 502, 995
Villata, M., Raiteri C. M., Larionov, V. M et al. 2008, A&A,481, L79 Wagner, R.M., 2008, PoS(BLAZARS2008), 63, 013 (arXiv:0809.2843)