• Keine Ergebnisse gefunden

Test of a Low-Power LIDAR for the Study of Temporarily Variable Transmission of the Atmosphere for Corrections in Groundbased γ-ray Astronomy with the 17m Cherenkov Telescope MAGIC

N/A
N/A
Protected

Academic year: 2021

Aktie "Test of a Low-Power LIDAR for the Study of Temporarily Variable Transmission of the Atmosphere for Corrections in Groundbased γ-ray Astronomy with the 17m Cherenkov Telescope MAGIC"

Copied!
127
0
0

Wird geladen.... (Jetzt Volltext ansehen)

Volltext

(1)

Test of a Low-Power LIDAR for the Study of Temporarily Variable Transmission of the Atmosphere for

Corrections in Groundbased γ -ray Astronomy with the 17m Cherenkov

Telescope MAGIC

Masterarbeit

zur Erlangung des akademischen Grades Master of Science in Physics

(M.Sc.)

dem Fachbereich Physik der Universit¨at Siegen

vorgelegt von Christine Merck

April 2004

(2)
(3)

Test of a Low-Power LIDAR for the Study of Temporarily Variable Transmission of the Atmosphere for

Corrections in Groundbased γ -ray Astronomy with the 17m Cherenkov

Telescope MAGIC

Masterarbeit

zur Erlangung des akademischen Grades Master of Science in Physics

(M.Sc.)

dem Fachbereich Physik der Universit¨at Siegen

vorgelegt von Christine Merck

April 2004

(4)
(5)

Abstract

The subject of this thesis is the improvement, the test and the setup of a LIDAR system at La Palma for the MAGIC collaboration. MAGIC is an acronym for Major Advanced Gamma-Ray Imaging Cherenkov - Telesope. The LIDAR system is used for atmospheric transmission studies.

In this thesis an existing LIDAR sytem was technically improved and tested. In order to improve the LIDAR range, a new detector, a prototype of a Hybrid Photomultiplier (HPMT) which is also called Hybrid Photodiode (HPD), was tested and installed as LIDAR detection unit. The quantum efficiency of the HPD prototype was measured. One goal of this thesis was to replace the original PMT with 5 % quantum efficiency by the new type HPD with 40 % quantum efficiency. Successful LIDAR measurements showed an increase of the useful LIDAR range with the HPD as detector about a factor 2. The LIDAR system was tested at the Max-Planck-Institute for Physics in Munich. A box for the LIDAR electronic devices was prepared and mounted to the LIDAR telescope.

The transport of the LIDAR system from Munich to La Palma was organized. LIDAR measurement

were made at La Palma and as a result, the inversion layer was measured at an atmospheric height of

about 1900 meters above sea level. The extinction value for the altitude, where the MAGIC telesope

is located (2200 meters above sea level) was calculated. Cloudy layers could be observed at a distance

of 24-28 km under a zenith angle of 75 . In order to improve the LIDAR data analysis, a correction

for an application of the slope method for non-horizontal shots was introduced.

(6)
(7)

Contents

Contents i

List of Figures iii

List of Tables vi

1 Introduction 1

2 Astrophysical Background 3

2.1 The Role of Gamma-Astronomy Today . . . . 3

2.2 Detection of Extraterrestrial Gamma Rays . . . . 5

2.3 Development of Air showers . . . . 6

2.4 The Cherenkov Effect . . . . 9

2.5 The Longitudinal Shower Development for Electromagnetic Showers . . . . 11

2.6 The Lateral Shower Development for Electromagnetic Showers . . . . 12

2.7 The Imaging Cherenkov Technique . . . . 14

2.8 The MAGIC Telescope . . . . 18

3 The Atmosphere and Light Scattering Processes 20 3.1 The Atmosphere . . . . 20

3.2 Definition of Rayleigh/Mie Scattering Domains . . . . 23

3.3 Rayleigh Scattering . . . . 24

3.4 Mie Scattering . . . . 25

3.5 The U.S. Standard Atmosphere . . . . 27

4 Canary Islands’ Climate and Observing Conditions 28 4.1 Impact of Meteorological Conditions on Observation Quality . . . . 28

4.2 General Aspects of Climate Conditions at the Canary Island . . . . 29

4.3 La Palma . . . . 30

4.4 Possible Impact of Atmospheric Condition on Air Shower Observation . . . . 31

5 LIDAR Fundamentals 35 5.1 The LIDAR principle . . . . 35

5.2 Common LIDAR techniques . . . . 35

5.3 LIDAR: Theoretical Aspects . . . . 36

6 Experimental Setup of the LIDAR-System 40

i

(8)

6.1 Communication between Computer and the LIDAR telescope . . . . 41

6.2 The Laser . . . . 42

6.3 Optics . . . . 44

6.4 The Detector: The Hybrid Photodiode . . . . 46

6.5 Measurement of the HPD Quantum Efficiency . . . . 47

6.6 The HPD operated as LIDAR Detection Unit . . . . 48

7 Measurements and Data Analysis 54 7.1 Laser-Alignment . . . . 55

7.2 Observations . . . . 55

7.3 Taking Pedestal Runs . . . . 56

7.4 Description of LIDAR Data . . . . 56

7.5 Data Analysis LIDAR run00015 . . . . 70

7.6 Data Analysis LIDAR run00019 . . . . 74

7.7 Data Analysis LIDAR run00028 . . . . 81

7.8 Data Analysis LIDAR run00029 . . . . 84

7.9 Data Analysis LIDAR run00030 . . . . 87

7.10 Data Analysis LIDAR run00025 . . . . 90

7.11 Data Analysis LIDAR run00024 . . . . 93

7.12 Data Analysis LIDAR run00026 . . . . 96

7.13 Results . . . . 99

8 Possibilities for Future Development 102 8.1 The LIDAR Dome . . . . 102

8.2 Electronics . . . . 102

8.3 Data Analysis . . . . 102

8.4 Software and Hardware . . . . 103

8.5 Different Methods of Observations . . . . 103

9 Summary and Conclusions 104

A Schematics of the Amplifiers 105

B Datasheets from Hamamatsu 107

Bibliography 111

(9)

List of Figures

2.1 BATSE burst map . . . . 4

2.2 The CT1 telescope from the HEGRA telescope array . . . . 5

2.3 Crab Nebula . . . . 6

2.4 Schematic view of a neutron star . . . . 6

2.5 Simplified model for electromagnetic cascades . . . . 7

2.6 Model for hadronically induced cascades . . . . 8

2.7 The Cherenkov effect . . . . 9

2.8 The refractive index as a function of height . . . . 11

2.9 The Cherenkov angle as a function of atmospheric height . . . . 12

2.10 The number of electrons in an electromagnetic air shower . . . . 13

2.11 Lateral development of electromagnetic air showers . . . . 14

2.12 The imaging technique . . . . 15

2.13 The imaging technique . . . . 16

2.14 Air shower development and Cherenkov photon images . . . . 16

2.15 Examples for cuts applied to the image of an air shower . . . . 17

2.16 The MAGIC telescope . . . . 18

3.1 Vertical structure of the atmosphere . . . . 21

3.2 Column variability of aerosol extinction coefficients . . . . 22

3.3 Aerosol sources and aerosol amount . . . . 23

3.4 Typical aerosol sizes . . . . 24

3.5 Polar mie scattering diagram . . . . 26

3.6 The U.S. Standard Atmosphere . . . . 27

4.1 Hadley circulation . . . . 28

4.2 Saharan sand carried by wind to the Canary Islands . . . . 30

4.3 Average surface level pressure and surface winds . . . . 31

4.4 Vertically integral extinction values for La Palma measured by the CMT . . . . 32

4.5 Temperature deviations from U.S. Standard Atmosphere . . . . 33

4.6 Atmospheric impact on longitudinal shower development . . . . 34

4.7 Atmospheric impact on lateral shower development . . . . 34

5.1 The LIDAR principle . . . . 36

6.1 The LIDAR setup at La Palma . . . . 40

6.2 The LIDAR setup at La Palma . . . . 41

6.3 The 12 foot clamshell dome . . . . 41

iii

(10)

6.4 The LIDAR setup at La Palma:The box for electronics . . . . 42

6.5 The LIDAR setup at La Palma: A LIDAR motor . . . . 43

6.6 The LIDAR setup at La Palma: Laser, HPD and optics . . . . 43

6.7 The Laser . . . . 43

6.8 2 level system absorber for a passive Q-switch . . . . 44

6.9 The LIDAR receiver mirror . . . . 45

6.10 LIDAR optics . . . . 45

6.11 The Detector:Front side of the HPD and principle of the HPD setup . . . . 46

6.12 HPD base side . . . . 47

6.13 Setup for the measurement of the HPD quantum efficiency . . . . 48

6.14 Quantum efficiency for HPD R7117-40 ModXQ0161 . . . . 49

6.15 Quantum efficiency for HPD R7117-01 ModXU0012 . . . . 49

6.16 The Detector: HPD electronics circuit (fast counting mode) . . . . 50

6.17 The Detector: HPD electronics circuit (photon counting mode) . . . . 51

6.18 HPD measurement of single photoelectrons . . . . 51

6.19 Setup for HPD measurement of single photoelectrons . . . . 52

6.20 The LIDAR setup at La Palma: The HPD . . . . 52

6.21 HPD signal after amplification . . . . 52

6.22 Pick-up noise in LIDAR measurements . . . . 52

6.23 Pick-up noise after the stretcher amplifier . . . . 53

6.24 Signal of a single photoelectron after the stretcher amplifier . . . . 53

7.1 A satellite weather image of La Palma . . . . 54

7.2 Pedestal raw data, LIDAR run00016, shot 50-52 . . . . 58

7.3 Raw data, LIDAR run00015, shot 50-52 . . . . 59

7.4 LIDAR signals for the FADC Channels 0-1000 . . . . 60

7.5 LIDAR run00015, shot 50, mean value of 5000 shots subtracted . . . . 61

7.6 LIDAR run00019, 1000 laser shots . . . . 62

7.7 LIDAR run00019, 1000 laser shots . . . . 62

7.8 LIDAR run at a zenith angle of 91.5 . . . . 63

7.9 Pedestal run at a zenith angle of 91.5 . . . . 63

7.10 Sketch for the horizontal LIDAR measurement . . . . 63

7.11 LIDAR run at a zenith angle of 94.5 . . . . 64

7.12 LIDAR run at a zenith angle of 94.5 . . . . 64

7.13 Pedestal run at a zenith angle of 94.5 . . . . 65

7.14 LIDAR run at a zenith angle of 95 . . . . 65

7.15 Pedestal run00032, 3 single laser shots . . . . 66

7.16 Pedestal run00027, 5000 laser shots . . . . 67

7.17 Pedestal run00032, 5000 laser shots . . . . 67

7.18 LIDAR run00029, 5X500 laser shots . . . . 68

7.19 LIDAR run00029, 5X500 laser shots . . . . 69

7.20 LIDAR run00015,Horizontal Shot . . . . 70

7.21 LIDAR run00015,Horizontal Shot . . . . 71

7.22 LIDAR run00015,log-log plot . . . . 72

7.23 LIDAR run00015,Range corrected signal . . . . 72

7.24 LIDAR run00015,S(R) and calculated extinction values . . . . 73

7.25 Data of LIDAR run00019 . . . . 74

(11)

7.26 Data of LIDAR run00019, log-log plot at 5000 shots . . . . 75

7.27 Data of LIDAR run00019 . . . . 76

7.28 LIDAR run00019,log-log plot, 1000 shots . . . . 77

7.29 LIDAR run00019,pedestal subtracted, 1000 shots . . . . 77

7.30 LIDAR run00019,pedestal subtracted, 5000 shots . . . . 78

7.31 LIDAR run00019,Range corrected signal, 1000 shots . . . . 78

7.32 LIDAR run00019,Range corrected signal, 5000 shots . . . . 79

7.33 LIDAR run00019,S(R) and calculated extinction values, 1000 shots . . . . 79

7.34 LIDAR run00019,S(R) and calculated extinction values, 5000 shots . . . . 80

7.35 LIDAR run00028,LIDAR return signal and pedestal fit . . . . 82

7.36 LIDAR run00028,LIDAR return signal without pedestal . . . . 82

7.37 LIDAR run00028,LIDAR range corrected signal . . . . 83

7.38 LIDAR run00028,S(R) and calculated extinction values . . . . 83

7.39 LIDAR run00029,LIDAR return signal and pedestal fit . . . . 84

7.40 LIDAR run00029,LIDAR return signal without pedestal . . . . 85

7.41 LIDAR run00029,LIDAR range corrected signal . . . . 85

7.42 LIDAR run00029,S(R) and calculated extinction values . . . . 86

7.43 LIDAR run00030,LIDAR return signal and pedestal fit . . . . 87

7.44 LIDAR run00030,LIDAR return signal without pedestal . . . . 88

7.45 LIDAR run00029,LIDAR range corrected signal . . . . 88

7.46 LIDAR run00030,S(R) and calculated extinction values . . . . 89

7.47 LIDAR run00025,LIDAR return signal and pedestal fit . . . . 90

7.48 LIDAR run00025,LIDAR return signal without pedestal . . . . 91

7.49 LIDAR run00025,LIDAR range corrected signal . . . . 91

7.50 LIDAR run00025,S(R) and calculated extinction values . . . . 92

7.51 LIDAR run00024,LIDAR return signal and pedestal fit . . . . 93

7.52 LIDAR run00024,LIDAR return signal without pedestal . . . . 94

7.53 LIDAR run00024,LIDAR range corrected signal . . . . 94

7.54 LIDAR run00024,S(R) and calculated extinction values . . . . 95

7.55 LIDAR run00026,LIDAR return signal and pedestal fit . . . . 96

7.56 LIDAR run00026,LIDAR return signal without pedestal . . . . 97

7.57 LIDAR run00026,LIDAR range corrected signal . . . . 97

7.58 LIDAR run00026,S(R) and calculated extinction values . . . . 98

7.59 Extinction coefficients from sea level to 24 km (clear standard atmosphere) . . . . . 100

A.1 Electronic Circuit of the Stretcher Amplifier . . . . 105

A.2 Voltage Amplifier . . . . 106

B.1 Quantum Efficiency of the HPD . . . . 107

B.2 HPD Bombardement Gain and Avalanche Gain . . . . 108

(12)

List of Tables

2.1 Data overview for the MAGIC telescope . . . . 19 3.1 Atmosphere components . . . . 22 5.1 Commonly applied LIDAR techniques . . . . 37 7.1 Comparison of extinction coefficients for vertical and horizontal LIDAR measurements 101 7.2 Comparison of extinction coefficients for LIDAR measurements at different zenith angles101

vi

(13)

Chapter 1

Introduction

Over the years, astroparticle physics has changed from a small, relatively exotic discipline of physics to a serious domain, whose importance is growing not only for astronomers and astrophysicists. It has opened new fields of research for high energy physicists. For scientists, the most interesting aspects of astroparticle physics are, for example, the physical processes in the universe which lead to particle acceleration up to energies above several hundredth of TeV. These are particles with energies which cannot be reached with modern particle accelerators. The universe here serves as laboratory for gener- ating particles of the highest energies ever observed. Nevertheless, the acceleration processes behind the production of highest energy particles, still have to be investigated completely. A large variety of phenomena in the high energy/very high energy region, i.e. gamma ray bursts or the production of cosmic rays are also not fully understood. Objects which are of great importance in astrophysics are quasars, blazars and supernova remnants. Due to the large number of un-revealed or incompletely understood phenomena and unidentified sources, scientists have to build numerous instruments for the detection of the highest energy particles.

Cherenkov telescopes allow measurements of photons in the energy range from about 20 GeV to several hundred TeV. One new generation Cherenkov telescope is the MAGIC-telescope (Major Advanced Gamma-Ray Imaging Cherenkov Telescope). It’s main feature is a 17 meter diameter Cherenkov mirror composed of about 1000 elements. The telescope is located on the Canary Island La Palma, at an altitude of 2200 meters. MAGIC is currently the largest Cherenkov telescope in the world. The principle of detection is based on the fact that cosmic gamma rays of extraterrestrial origin hit the atmosphere and interact with particles or molecules of the air and thus initiate extended air showers in the atmosphere.

The development of extended air showers includes the production of very fast moving, charged par- ticles which generate Cherenkov radiation, provided the particle’s speed exceeds that of light in the atmosphere. Detection of these Cherenkov photons from air showers allow one to draw conclusions about the type of the primary particles, as well as their direction and energy. Atmospheric proper- ties are important, because the propagation of Cherenkov photons depends on atmospheric transmis- sion. Atmospheric fluctuations, affecting for example aerosol content, clouds and ozone density, are possible within short time scales (minutes and hours) as well as within larger time scales (months:

winter/summer). A scientific goal is to investigate the impact of such fluctuations and the extent to which weather conditions will be relevant for observations with the MAGIC-telescope. The intensity of air shower-generated Cherenkov photons penetrating the atmosphere can be reduced due to absorp-

1

(14)

2 CHAPTER 1. INTRODUCTION tion and scattering processes, thus atmospheric transmission (or extinction) is an important parameter for reconstruction of air shower development. The goal of my thesis is to demonstrate the ability to measure differential atmospheric condition on site by means of an experimental LIDAR.

LIDAR is the acronym for Light Detection and Ranging. In LIDAR applications, a certain number of photons is shot via laser pulse into the atmosphere and the backscattered radiation is detected by a telescope. Since the laser-emitted photons interact with atmospheric molecules and particles, mea- surement of the photon runtime allows the spatial localization of backscattering centers. Atmospheric extinction can be retrieved from the data of LIDAR measurements, so that at least rough estimations for the atmospheric quality can be presented. This thesis is part of a multi year effort to build and operate a reliable and simple system on La Palma. The entire program cannot be carried out within one year for a thesis. The prototype LIDAR was build by Robert Schwarz [1], who also carried out first measurements at the Max-Planck-Institute in Munich. This LIDAR allowed atmospheric studies up to 6 km distance. This is unsatisfactory for observations in connection with air shower observations and improvements are needed. The goals of my thesis were

-Update of the software

-Improvement of the sensitivity by installing a new photo sensor of nearly factor 8 increase in quan- tum efficiency at 532nm.

-Set up of the LIDAR in La Palma

-Taking measurements on site

(15)

Chapter 2

Astrophysical Background

2.1 The Role of Gamma-Astronomy Today

In the last century, the development of astronomical observatories, including satellites as well as earth- bound telescopes, has made rapid progress and, coincidentally, gamma astronomy has become an interesting, ever-expanding field of science. Some of the most challenging phenomena, like gamma- ray bursts for example, have now become a main focus of key experiments for testing of the new quantum loop theory, which unifies quantum mechanics and gravitation [2].

Gamma-ray bursts (GRBs) are short outbreaks of energies up to 10 54 erg, thus exceeding the energy release of a supernova by about a factor of 100. One burst can last only milliseconds or up to some 100 seconds. The phenomenon of gamma-ray bursts was discovered by chance in 1967 [3] by the Vela satellites. Scientists had not expected to discover such a phenomenon and GRBs became a topic of speculation. It also became obvious that there was a need for more powerful detection instruments in order to investigate the origin of GRBs.

In 1994, the last high energy gamma-ray satellite mission (Compton Gamma-Ray Observatory, CGRO) confirmed the burst distribution to be isotropic (see Figure 2.1), thus excluding sources of GRBs located in our galactic disk. If burst sources had been of galactic origin, the burst distribution would have been concentrated along the plane of the Milky way.

In 1997, the detection of a gamma-ray burst afterglow showing an optical counterpart again confirmed the extra-galactic origin of gamma-ray bursts, because the afterglow was found to be in a galaxy at a cosmological distance with a redshift at z = 3.42 [5]. Although more afterglows have been observed since, the origin of gamma-ray bursts still has to be explored. The idea of hypernovae, extremely highly energetic supernovae, as burst source is favored by many astrophysicists as an explanation for the GRBs[6]. Gamma-rays from GRBs have been observed up to 17 GeV. But since an unexplored re- gion in the electromagnetic spectrum from 10-100 GeV remains, the development of more powerful satellites is necessary and more sensitive telescopes on earth have to be built.

While the EGRET (Energetic Gamma Ray Experiment Telescope) [7] instrument on board the CGRO satellite had very limited sensitivity above 10 GeV, earthbound telescopes, such as the HEGRA (High Energy Gamma Ray Astronomy) experiment [8] which covers an energy range from 300 GeV up- wards, have not been able to detect any photons from gamma-ray bursts. One problem is that Cherenkov telescopes need to be alerted to be pointed to a GRB. Due to technical reasons telescope

3

(16)

4 CHAPTER 2. ASTROPHYSICAL BACKGROUND

Figure 2.1: BATSE burst map, from [4]

positioning delays of up to 15 minutes have allowed only the study of possible delayed emission. A picture of one of the HEGRA-telescopes can be seen in Figure 2.2.

The exploration of the region between 10-300 GeV is one of the urgent, major tasks of the new sensitive telescopes. The MAGIC telescope (Figure 2.16) is one example of an advanced scientific in- strument which is able to carry out observations above 30 GeV (phase 1) or 15 GeV (phase 2). While ground-based instruments have, up to now only detected 10-15 sources (plerions, AGNs and shell- type supernova remnants) above 300 GeV, the EGRET satellite experiment measured below 10 GeV about 300 objects and 200 of these were unidentifiable. About 90 blazars (AGN), five pulsars, the LMC, as well as a radio-galaxy were identified. Based on the projected sensitivity one expects to detect about 100 sources of gamma radiation in the spectral range which MAGIC is currently opening for astronomers.

Apart from gamma ray bursts, there are a series of other scientifically challenging objects in the high energy region: pulsars and supernova remnants. A standard candle in gamma astronomy is represented by the crab nebula. It is the remnant of a supernova which was observed in the year 1054 and is about 6000 light-years away. This supernova was so bright that old manuscripts tell us the explosion was seen with the naked eye during daylight time. Observatories today can observe the remnant of this explosion: a nebula, the expanding shell of the supernova explosion and a fast spinning neutron star which rotates at a frequency of 30 Hz. A crab image obtained by the Palomar Observatory can be seen in Figure 2.3 at the left. At the right side, Figure 2.3 shows the same source, the crab nebula, as imaged by the Chandra satellite in x-rays [9]. Figure 2.4 illustrates schematically the simplified model of a pulsar.

In pulsars, due to the strong magnetic field of the neutron star, pulsed radiation can be detected

and is mainly observed in the optical and ultraviolet part of the electromagnetic spectrum, as well

as in the x-ray region. Pulsed gamma-ray emission is observed at energies below 10 GeV from

different neutron stars like, for example, Geminga and also from the Crab Nebula. On the other

hand, no pulsed signals, but a very constant flux can be received by Cherenkov telescopes with their

energy threshold above 300 GeV. This raises the question: Which spectral flux will be observed in

(17)

2.2. DETECTION OF EXTRATERRESTRIAL GAMMA RAYS 5

Figure 2.2: The CT1 telescope from the HEGRA telescope array, from [8]

the region between 10 GeV and 300 GeV? The answer to this question may help to discriminate between theoretical models explaining the production mechanism of pulsed signals from neutron stars.

2.2 Detection of Extraterrestrial Gamma Rays

Gamma-rays of extraterrestrial origin hitting the atmosphere interact with atmospheric molecules at altitudes of typically 20-30 km, so that the primarily incident photon can no longer be ”seen” by telescopes placed on earth. The energy of a gamma quantum is transferred to atmospheric particles as well as to photons which then propagate through the atmosphere and can be detected at high altitude locations. The incident gamma quantum leads to the development of atmospheric particle cascades which are also known as extended air showers.

Atmospheric molecule distribution plays an important role in all indirect methods of gamma-ray de- tection when we investigate the gamma ray energy deposit in the atmosphere. The atmosphere as shower-developing material, is actually a major part of the detector. The analysis of Cherenkov data, which relied on a mean model of molecule density and particle distribution in the atmosphere, now has to be complemented by data won from measurements of atmospheric properties such as atmospheric transmission.

While the detection of air shower particles and Cherenkov photons is an indirect method for detection

of gamma radiation, satellites which are placed in an extraterrestrial orbit detect the gamma-rays

directly. Due to the limited weight a satellite can carry, the sensitive area of an space borne detector

(18)

6 CHAPTER 2. ASTROPHYSICAL BACKGROUND

Figure 2.3: Crab Nebula:Image in the optical(left, credits to Palomar Observatory, and in the x-ray region(right) from [10] credits to NASA/CXC/SAO

Figure 2.4: Schematic view of a neutron star, credits to NASA/CXC/SAO from [11]

instrument is also limited. The decreasing photon flux with increasing photon energy emitted by extraterrestrial sources therefore demands satellite borne detectors with a large sensitive area to detect high energy photons. One example for an important new satellite project is the GLAST satellite [12]

which is planned for launch in 2006.

2.3 Development of Air showers

The development of a typical gamma-induced air shower is shown in a simplified schematic in Figure 2.5. An incoming photon produces in the mean an electron-positron pair after one radiation length.

Both new particles generate γ 0 s by Bremsstrahlung (at 7/9 radiation length). The newly generated

photons again undergo pair production. Pair production and Bremsstrahlung are predominantly re-

sponsible for an increase in the number of particles in an air shower. Since the energy of the primary

(19)

2.3. DEVELOPMENT OF AIR SHOWERS 7 photon will be distributed to the air shower particles, at the beginning of an air shower development in the atmosphere, the energy per particle decreases in first order with the number of shower particles.

At the point of shower development, when the energy of each particle is so low that losses due to ionization instead of Bremsstrahlung are dominant, the number of the shower particles no longer increases and the particle cascade dies out. The electromagnetic showers are rather narrow because widening occurs only due to multiple scattering and small deflections due to the earth’s magnetic field.

e e

e e

e

e e e e

e

− + −

+

+

+

+ γ

γ γ

γ

− γ

Figure 2.5: Simplified model for electromagnetic cascades

The atmosphere is not only hit by gamma-rays, but is also hit by different kind of cosmic ray particles which can produce air showers. Electromagnetic air showers, which are described above, can not only be produced by a highly energetic photon, but also by cosmic electrons. There also exist hadronically induced showers, which are produced by highly energetic hadrons (protons or nuclei), which are the main component of cosmic rays. For gamma astronomers, extraterrestrial hadrons and electrons hitting the atmosphere are an unwanted background. Whether and how these background events, which are typically a factor of 1000 - 10 000 more abundant than the number of gamma events, can be suppressed, will be discussed in this section.

It can be shown that different kinds of primary incident particles generate air showers with different shower morphology. The reason for differences in shower morphology is that the interaction of the primary particles differ and, as a result, the shower development itself also shows differences.

The development of an hadronic shower is schematically shown in Figure 2.6 [13]. The following interactions characterize the production of particles in air showers induced by hadrons [14]:

p + N −→± , π 0 , K ± , K 0 , p, n, ...) (2.1)

(20)

8 CHAPTER 2. ASTROPHYSICAL BACKGROUND

Figure 2.6: Model for hadronically induced cascades[13]

In every hadronic interaction about 1/3 of the energy is transferred to π 0 ’s. Neutral pions decay nearly promptly and thus fuel the electromagnetic component of the hadronic shower. At the end of the shower development the hadronic cascade is dominated by the electromagnetic component:

π 0 −→ γ + γ (2.2)

Sometimes the charged mesons can decay before interaction, according to:

π + −→ µ + + ν µ (2.3)

π −→ µ + ¯ ν µ (2.4)

For Kaons, we find the following decays:

K + −→ µ + + ν µ (2.5)

(21)

2.4. THE CHERENKOV EFFECT 9

K + −→ µ + + ν µ + π 0 (2.6)

K + −→ π + + π 0 (2.7)

Reactions of negatively charged Kaons are analogous. Also the following muon decays might take place:

µ + −→ e + + ν e + ¯ ν µ (2.8)

µ −→ e + ν µ + ¯ ν e (2.9)

However as muons have a long lifetime, a fraction of the initial energy is not dumped in the atmo- sphere. Therefore hadronic showers have, in general, a lower measurable energy in the ”atmospheric”

calorimeter. While hadronic showers have about the same longitudinal extension, they are consid- erably wider than electromagnetic showers. The underlying process is the considerable transverse momentum kick to secondary particles. This difference in shower width is an important parameter used to distinguish electromagnetic showers from hadronic showers (see next chapters).

2.4 The Cherenkov Effect

When a charged particle penetrates a transparent dielectrical medium, such as water or air, with a velocity higher than the velocity of light in this medium, Cherenkov radiation will be produced. The

direction of particle propagation

wavefront

cos θ =

θ β ct ct/n

ct/n β ct

= 1/ β n

Figure 2.7: The Cherenkov effect

(22)

10 CHAPTER 2. ASTROPHYSICAL BACKGROUND Cherenkov photons are emitted at a certain angle θ (see Figure 2.7), related to the density of the medium.

The basic formula is given by:

cosθ = 1

(2.10)

where

n : refractive index β = v c

and the angle θ refers to the axis of the particle propagation.

The differential number of Cherenkov photons per path length dN dx as function of wavelength λ is given by [15]:

dN

dx = 2παz 2 Z

βn(λ)>1

µ

1 1

n(λ) 2 β 2

λ 2 (2.11)

where

α : fine structure constant and z : charge of particle

The wavelength dependence of the refractive index is often neglected. The condition for the produc- tion of Cherenkov radiation β > 1/n will be fulfilled only if the particle energy E is equal or exceeds [15]:

E = m 0 c 2

µ 1

1 n −2 1

(2.12) where

m 0 : particle rest mass.

At sea level, the minimum electron energy needed to produce Cherenkov radiation is 22 MeV. In atmospheric air showers, the angle of Cherenkov photon emission depends on the density of air and therefore depends on the atmospheric height at which the emission takes place. The refractive index as a function of atmospheric depth X ν is given by [16]:

n(t) = 1 + η = 1 + 0.0002926X ν

1030g/cm 2 · 273K

204 + 0.091cm 2 /gX ν (2.13) The following relation between atmospheric depth X ν and height h [17] can be used:

X ν (h) = 10 (3.0204−0.050586·h−0.0010286·h 2 +0.000018945·h 3 ) (2.14) The refractive index can therefore be expressed as a function of atmospheric height n = n(h), as shown in Figure 2.8. The relation of the angle of emittance for Cherenkov photons and height:

cosθ = 1

β · n(h) (2.15)

(23)

2.5. THE LONGITUDINAL SHOWER DEVELOPMENT FOR ELECTROMAGNETIC SHOWERS11

Figure 2.8: The refractive index as a function of height, Figure taken from [18]

is illustrated in Figure 2.9.

2.5 The Longitudinal Shower Development for Electromagnetic Show- ers

Most of the Cherenkov radiation in air showers is produced by electrons and positrons with β 1.

The number of electrons and positrons as a function of atmospheric depth t (in units of radiation lengths t) can be calculated by the formula from Greisen [19]:

N (t, E 0 ) = 0.31 q

ln E E 0 c · e

t·[1−1.5·ln( 3t

t+ln E 0 Ec

)]

(2.16)

where E 0 is the energy of the primary incident particle and E c is the critical energy (≈ 84M eV ), at which the production of secondary particles starts to diminish. The number of electrons and positrons as a function of atmospheric depth is shown graphically in Figure 2.10 with examples for different energies of the primary particle. The atmospheric depth of the shower maximum is typically given by:

t max = ln E 0

E c (2.17)

(24)

12 CHAPTER 2. ASTROPHYSICAL BACKGROUND

Figure 2.9: The Cherenkov angle as a function of atmospheric height, Figure taken from [18]

With increasing energy of the primary particle, the shower maximum will be found at greater atmospheric depth, because the particles have more energy with which to penetrate the atmosphere.

2.6 The Lateral Shower Development for Electromagnetic Showers

The lateral shower development can be described analytically by the NKG (Nishimura-Kamata- Greisen) formula [19]. The expression for electron density ρ(r) as a function of distance from the shower axis r is:

ρ(r) = C(s)N e r 2 0 · r

r 0

(s−2)

· µ

1 + r r 0

(s−4.5)

(2.18)

where

N e : total number of shower electrons s : shower age

r 0 : Moliere radius, (r 0 = 79 at sea level) C(s) : constant for normalization

and the so-called age of the shower is given by:

(25)

2.6. THE LATERAL SHOWER DEVELOPMENT FOR ELECTROMAGNETIC SHOWERS 13

Figure 2.10: The number of electrons in an electromagnetic air shower for different energies of the primary particle [19], Figure taken from [18]

s = 3t

t + 2ln ³ E E 0 c ´ (2.19)

where t : atmospheric depth in units of radiation lengths

That means, that the depth of the shower maximum is connected with a shower age of s = 1.

As long as s < 1, the shower is still below its maximum in development. Shower ages s > 1 represent the phase of development after the shower maximum when the number of particles decreases again and the showers dies out. A formula for the normalization constant C(s) can be obtained by using the Gamma function:

C(s) = Γ(4.5 s)

2πΓ(s)(4.5 2s) (2.20)

Monte Carlo simulations show a good agreement with this description of lateral shower development at distances from 10-100 meters to the shower axis. Figure 2.11 shows the lateral structure of the max- imum of an electromagnetic shower calculated by formula 2.20 for different energies of the primary particle.

The typical fraction of primary particle energy released into Cherenkov photon production is about

1000 1 and is relatively constant over a wide range (1 GeV- 1PeV) of the primary particle’s energy. It

also has to be mentioned that the lateral and longitudinal shower development was applied to showers

(26)

14 CHAPTER 2. ASTROPHYSICAL BACKGROUND which developed vertically in the atmosphere. Deviations to these calculations have to be expected for showers produced by primary particles which hit the atmosphere at larger zenith angles.

Figure 2.11: Lateral shower development: electron density in 1/m 2 against the distance to the shower axis in the shower maximum for different energies of the primary particle, Figure taken from [18]

2.7 The Imaging Cherenkov Technique

When Cherenkov radiation, generated in an air shower, arrives at ground or detection level, the pho- tons typically cover a circular area with a diameter of about 240 meters with uniform density. If the energy of the primary particle is low, fluctuations in photon density will make shower reconstruction much more difficult. Cherenkov telescopes collect part of these shower photons. As mentioned in chapter 2.3 hadronic and electromagnetic showers differ significantly in their lateral extension and less in their longitudinal extension. The effect shows up in the distribution of the Cherenkov light.

By means of Cherenkov telescopes with fine pixalized cameras, it is possible to detect the above- mentioned differences. This principle of imaging is shown in Figure 2.12, where Cherenkov photons generated in an air shower are collected and imaged. The effective collection area of a Cherenkov telescope is determined by the maximum distance between shower axis and telescope axis at which sufficient photons can be collected and showers can be resolved. An example of a shower image which can be obtained by photon collection with a Cherenkov telescope is shown in Figure 2.13.

Examples of differences between hadron showers and electromagnetic showers images are shown in

Figure 2.14. In the images different parts of the airshower are imaged to different locations in the

camera. Thus, the observation of Cherenkov photon densities in air showers allows reconstruction of

the particle distribution in air showers. In order to draw physical conclusions about the differences in

(27)

2.7. THE IMAGING CHERENKOV TECHNIQUE 15

Figure 2.12: The imaging technique

the shape, the Cherenkov signals are parameterized, see Figure 2.13. The better the shower image is resolved, the more effectively the hadronic background can be suppressed.

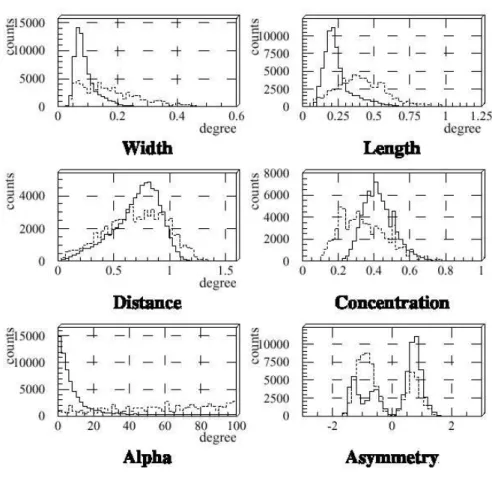
Dedicated cuts [21], which are applied to eliminate events with deviations in the shape of the signal, help to suppress the rate of noise events to a factor of about 100, however this technique cuts the rate of gamma-induced events only by a factor of 2. In order to describe images recorded by a Cherenkov telescope, an ellipse is fitted to the image. The following parameters are typically applied to characterize air shower images:

-Length:

length of the large half axis of a fitted ellipse -Width:

length of the small half axis of a fitted ellipse

-Alpha:

(28)

16 CHAPTER 2. ASTROPHYSICAL BACKGROUND

Figure 2.13: The imaging technique

Figure 2.14: Air shower development and Cherenkov photon images [20]

angle between the large half axis of the ellipse and the line drawn from the image center to the center of the camera

-Conc:

ratio of the amount of light of the two most intense pixels to the total amount of image light -Dist:

distance of the image center to the center of the camera Size:

total amount of light of the shower image

(29)

2.8. THE MAGIC TELESCOPE 17 Some examples for cut parameters used for separation of hadron- and gamma-induced shower images are shown in Figure 2.15. First generation Cherenkov telescopes had a gamma-hadron separation of

5-10, whereas modern Cherenkov telescopes reach a gamma-hadron separation of up to 1000.

Figure 2.15: Examples for cuts applied to the image of an air shower

In air shower development, the number of Cherenkov photons generated can vary with atmospheric

molecule density mainly because of scattering processes. The presence of clouds and bad weather bias

air shower images most significantly. Measurement of Cherenkov photons from air showers therefore

was restricted to good weather condition only. Nevertheless, very thin high clouds which cannot be

seen by eye, can also bias air shower images, because the high density of molecules or ice crystals in

high clouds leads to the effect of Cherenkov photon scattering. If photons produced in such a biased

shower are detected, the shape of the detected shower will show deviations when compared to image

shapes of showers which develop in clear atmosphere. How far the Cherenkov photon distribution

depends on parameters such as varying molecule size and density distribution and the height above

sea level of clouds, is a topic to be studied in future. The experimental part of the investigation of these

effects can be done using an experimental LIDAR and data of a Cherenkov telescope coincidentally.

(30)

18 CHAPTER 2. ASTROPHYSICAL BACKGROUND

Figure 2.16: The MAGIC telescope [8]

2.8 The MAGIC Telescope

The MAGIC-telescope, shown in Figure 2.16, is a 17 m diameter Cherenkov telescope and currently the largest Cherenkov telescope in the world. It is located on the Canary Island La Palma (28.8 N, 17.8 W) nearly on top of the Roque de los Muchachos at an altitude of about 2200 meters above sea level. More technical data for the MAGIC-telescope can be found in Table 2.1. The optical axis of the telescope has to point directly into the direction of the observed source, so that gamma-rays emitted by the extraterrestrial source produce air showers parallel to the optical axis. Hence direction and location of the imaged air shower, with reference to the optical axis of the telescope, determine whether the signal will be accepted as being produced by the emitting gamma-ray source or not. The MAGIC-telescope camera consists of 577 photomultipliers. The signals are transferred via optical fiber to the control room and are digitized by 300 MHz FADCs. Cherenkov photons of a single air shower hit the earth or the mirror surface of the MAGIC telescope within about three nanoseconds.

In order to suppress background, e.g. from stars in the field of view, a trigger system which only

selects signals with a relatively high intensity and short duration compared to signals from the night

sky background or from stars, is used.

(31)

2.8. THE MAGIC TELESCOPE 19

energy threshold 30 GeV

expected mean trigger rate 300 Hz effective detection area for γ ’s 10 4 m 2

mirror reflectivity 85%

area of the telescope mirror 234m 2 mirror surface material AlM gSi 1.0 positioning accuracy 2 00

number of camera pixels 577 camera field of view 3.5

Table 2.1: Data overview for the MAGIC telescope

(32)

Chapter 3

The Atmosphere and Light Scattering Processes

3.1 The Atmosphere

The airmass which is attracted by the earth’s gravitational force is called atmosphere (in Greek Atmos:

dust, sphairia: sphere). A main feature of the atmosphere is its vertical structure and its exponentially decreasing density with increasing distance to the surface of earth. There exists no sharp edge which defines the upper limit of the atmosphere. Figure 3.1 shows the vertical structure of the atmosphere as named by the meteorologists and geophysicists. The pressure and the temperature as a function of altitude is shown. The troposphere, which extends up to 11-12 km in altitude is the lower part of the atmosphere. Here, there might be inversion layers, in which the temperature increases with increasing height. These layers can be typically found at heights of 1-2 kilometers. The troposphere plays an important role for weather development and weather conditions due to the formation of clouds and rain. The troposphere contains the main part of atmospheric water vapor. It also contains a considerable amount of aerosols and particles. Water vapor, aerosols and particles can significantly affect the observation of air showers because of absorption and scattering processes which can not be simulated precisely and therefore have to be measured by the LIDAR-system.

The region between troposphere and stratosphere is called tropopause. The altitude of the tropopause varies between 17 km (tropics) and 9 km (polar regions). The tropopause is characterized by negligible amount of water vapor. The tropopause is also the upper limit of weather variation. The stratosphere extends to heights of about 35 km, the temperature decreasing only slightly and increasing when it reaches the mesosphere. The stratosphere and the mesosphere are also called the chemosphere, when the mesosphere extends up to 100 km height. UV-photons are absorbed in the chemosphere and the most ozone is found at about 18-25 km altitude. The region from 100-400 km altitude is known as the ionosphere and the ionization processes can lead to temperatures up to 1000 C. Therefore this region is also known as the thermosphere. Solar x-rays ionize air molecules in regions above 100 km.

Because of the resulting plasma of ions and electrons, the air is electrically conductive. Electrical currents can flow in these regions of the atmosphere and radio waves can be reflected, for example.

The ionosphere is divided into different layers: the D-layer extends from 80-100 km altitude, the E-layer from 100-160 km altitude and the F-layer ranges from 200-600 km. The ionization strength varies in these layers and also different kind of ions are produced (N O + and O + 2 in the E-layer and O +

20

(33)

3.1. THE ATMOSPHERE 21 in the F-layer). The ionosphere is strongly influenced by solar activity. Moreover, particles from the magnetosphere can produce an additional ionization and excite gaseous molecules. This phenomenon is known as polar lights [22].

Figure 3.1: Vertical structure of the atmosphere [23]

The atmosphere consists of a mixture of different gaseous elements. Since the single atmospheric components have different particle masses, one would expect those components to be found as layers in different heights. Due to the strong turbulent mixing in the atmosphere, elements layers can only be found in the very upper parts of the atmosphere starting at heights of about 100 kilometers, ending with only hydrogen in the highest regions. This region of dissociation is called the heterosphere, the lower region of turbulent mixing is called the homosphere and the border in between is known as the turbopause. A list of the main components of the atmosphere (close to surface of earth) is shown in Table 3.1. Considerable amount of water can be found in the troposphere. The amount of water vapor normally fluctuates depending on it’s distribution in time and space. The amount of water vapor in the atmosphere is four vol. % as a maximum in humid tropical regions and 1. 3 vol. % during warm seasons and 0. 4 vol. % during cold season in the mid latitudes. Due to the decrease in temperature the amount of water vapor also decreases with increasing atmospheric height.

Another component which is also of some importance for measurements with LIDAR systems is

aerosols. Aerosols are defined to be a suspension of fine particles in the air. Aerosols are produced

by natural or anthropogene sources and are emitted into the atmosphere. The particles remain in the

atmosphere for a certain time and then settle down as emissions somewhere, as long as they have

not undergone a chemical reaction before. They include stratospheric liquid droplets of sulfuric acid

(34)

22 CHAPTER 3. THE ATMOSPHERE AND LIGHT SCATTERING PROCESSES Element vol.%

N 2 78.084

O 2 20.948

Ar 0.934

CO 2 0.03(variable)

N e 0.001818

H 2 0.001-0.00005

CH 4 0.0002

He 0.00052

Kr 0.000114

SO 2 0.0001

N 2 O 0.00005

Xe 0.0000087

N H 3 0.0000026

O 3 0.000002 (variable) Table 3.1: Atmosphere components from [24]

which make the background stratospheric aerosols and ice crystals.

Aerosols are in an unstable state, between molecules and solid powders. The global production of aerosols is about 10 millions tons per day. While primary aerosols are emitted as particles, secondary aerosols are formed from gas emissions in the atmosphere. One major feature of aerosols is their variability and heterogeneity in time and space. An example for aerosol variability is given in Figure 3.2. The values are column aerosol extinction of solar light. Data are derived from Meteosat and show short term, seasonal and inter-annual variability. There are multiple sources of aerosols [25].

Figure 3.2: Column variability of aerosol extinction coefficients [25]

On the one hand, there are widespread surface sources (primary aerosols) from arid surfaces (mineral

dust), the ocean (sea salt) to the biosphere (pollen, debris). Aerosols are also generated in biomass

and fuel burning (fly ash). On the other hand, there are intense point sources of aerosols such as

volcano eruptions (dust and ash), man-made explosions (atmospheric nuclear tests) or accidents with

radioactive fallout particles, for example. Examples for spatial sources within the atmospheric volume

are:

(35)

3.2. DEFINITION OF RAYLEIGH/MIE SCATTERING DOMAINS 23 -primary aerosols (air traffic)

and

-secondary aerosols (gas-to-particle conversion, cloud evaporation, ice condensation/crystallization).

An overview of aerosol sources and numbers for typical aerosol amount is given in Figure 3.3. The

Figure 3.3: Aerosol sources and aerosol amount [25]

particles are divided into gaseous and solid aerosols as well as into the groups particles and microor- ganisms. Typical aerosol sizes are shown in Figure 3.4.

3.2 Definition of Rayleigh/Mie Scattering Domains

The scattering of photons in the atmosphere includes molecules and particles as scattering center.

The scattering target can, therefore, be larger or smaller than the wavelength of the incident particle.

If multiple scattering processes can be neglected, there are two main cases of scattering processes:

Simple Rayleigh scattering and simple Mie scattering.

Simple Mie scattering refers to particles of arbitrary size and thus includes simple Rayleigh scattering as a limiting case when the scattering particle is small compared to the wavelength of the incident light. By introducing the scattering parameter x [27]:

x ka = 2πa

λ (3.1)

with

a : radius of aerosol or particle

and λ : wavelength of the passing light

(36)

24 CHAPTER 3. THE ATMOSPHERE AND LIGHT SCATTERING PROCESSES

Figure 3.4: Typical aerosol sizes [26]

the domain of Rayleigh scattering is defined by the case x 0. The Mie scattering theory should be used for reasonable accuracy for x 0.3. The Rayleigh theory implies large errors approaching x = 0 due to phase differences, which makes Rayleigh theory insufficient [27].

3.3 Rayleigh Scattering

The Rayleigh scattering theory, which was proposed by Lord Rayleigh in 1871, is used to describe the process of light scattering by atmospheric molecules. The probability of scattering into a given solid angle is given by [28]:

d 2 N ph dldΩ = 3

16π

¯ ¯

¯ ¯ dN ph dl

¯ ¯

¯ ¯ (1 + cos 2 Θ) (3.2)

where

N ph : Number of photons l : length

Ω : Solid angle θ : polar angle

A remarkable result is the 1 + cos 2 θ dependence of the scattering probability. The Rayleigh

differential cross section is [29]:

(37)

3.4. MIE SCATTERING 25

Rayleigh (θ, φ)

dΩ = π 2 (n 2 1) 2

N L 2 λ 4 (cos 2 φcos 2 θ + sin 2 φ) (3.3) where

θ : angle between the incident and scattering direction φ : polarization angle

n : refractive index N L : Loschmidt constant

λ : wavelength of incident particle

The total Rayleigh scattering cross section is [29]:

σ Rayleigh (λ) = 8π 3

π 2 (n 2 1) 2

N L 2 λ 4 (3.4)

The Rayleigh backscattering cross section can then be written as:

σ π,Rayleigh (λ) Rayleigh (θ = π)

dΩ = π 2 (n 2 1) 2

N L 2 λ 4 (3.5)

In the homospheric region of the atmosphere, the backscatter coefficient can also be described by [29]:

σ π,Rayleigh (λ) = 19.5

µ 400nm λ[nm]

4

· 10 −28 cm 2

sr (3.6)

The volume backscatter coefficient β π is the fraction of incident energy scattered per unit solid angle in the backward direction.

A formula for the volume backscatter coefficient is given by β π,Rayleigh (λ) N σ π,Rayleigh (λ) = 4.97

µ 400nm λ[nm]

4

· 10 −8 1

cm · sr (3.7)

The value for the backscatter coefficient at 532 nm at sea level is with N 2.55 ·10 19 molecules/cm 3 1.59 · 10 −8 cm −1 sr −1

3.4 Mie Scattering

The description of Mie scattering is more complex than that of Rayleigh scattering. The results for applied Mie theory are also much more complex than for Rayleigh scattering. The first formal rigorous solution was published by Gustav Mie in 1908. He stated the angular distribution of scattered radiation to be:

M ie (θ, φ) dΩ = λ 2

2 [i 1 (θ, x, n)sin 2 φ + i 2 (θ, x, n)cos 2 φ] (3.8)

where x is the scattering parameter defined in (3.1) and i 1 (θ, x, n) and i 2 (θ, x, n) represent the per-

pendicular and the parallel Mie intensity functions [29] [30].

(38)

26 CHAPTER 3. THE ATMOSPHERE AND LIGHT SCATTERING PROCESSES The most notable difference between Rayleigh and Mie scattering is the forward energy peak for all particles except the very smallest. For those very small scatterers, the scattering diagram is symmetric in both the forward and backward directions, whereas if particle size increases, an asymmetric scat- tering pattern will result, implying more forward directed scattering. When the scattering parameter exceeds unity, the scattering diagram will show peaks and troughs, but a maximum of forward scat- tering will still remain. Approaching x = 10, the peak structure becomes finer and for larger sizes it becomes oscillatory and very complex (see Figure 3.5 from [27]).

Figure 3.5: Polar mie scattering diagrams [27]. The size parameter x = 2πa/λ is shown for each

diagram

(39)

3.5. THE U.S. STANDARD ATMOSPHERE 27

3.5 The U.S. Standard Atmosphere

In 1976 American scientists described the mean values of fundamental atmospheric properties such as pressure, temperature, molecule density and some more atmospheric parameters. The result is the U.S.

Standard Atmosphere. The equations were adopted 15 October 1976 by the United States Committee on Extension to the Standard Atmosphere (COESA) representing 29 U.S. scientific and engineering organizations. The values selected in 1976 are slight modifications of those adopted in 1962. The standard level values for sea level temperature is 288.15 K, and sea level pressure is 288.15 m N 2 . The value for the hydrostatic constant is 34.1631947 km K . Figure 3.6 shows the values for temperature and pressure given by the U.S. Standard Atmosphere [31].

Figure 3.6: The U.S. Standard Atmosphere [31]

(40)

Chapter 4

Canary Islands’ Climate and Observing Conditions

4.1 Impact of Meteorological Conditions on Observation Quality

Most large earthbound telescopes are located within the subtropical high pressure belts in latitudes at 15-35 on the western side of continents or in the eastern oceans [32]. As a consequence of a thermally driven circulation (Hadley circulation) between equatorial and subtropical latitudes and the added effect of earth rotation, high pressure cells are produced and the atmosphere is dominated by fair weather systems in these regions. The vertical component of Hadley circulation is characterized by ascending motion near the equator and descending motion in subtropics. The effect of Hadley circulation is shown in Figure 4.1. Due to the broad scale subsidence in high pressure cells, adia-

Figure 4.1: Hadley circulation, from [33]

batic compression leads to warming, drying and stabilization of the atmosphere there, thus favoring astronomical observations in these regions.

In opposition, regions characterized by high levels of humidity and cloud formation are generally connected to disturbed weather such as thunderstorms and cyclones. Although atmospheric distur- bances can occur in subtropical regions, normally the equatorial and polar latitudes are associated with disturbed weather and unstable air masses.

In high pressure systems, the vertical structure of the atmosphere determines cloud formation. Sub- sidence in the middle and upper troposphere (see Figure 3.1) stabilizes the air at these levels while

28

(41)

4.2. GENERAL ASPECTS OF CLIMATE CONDITIONS AT THE CANARY ISLAND 29 surface heating and mechanical heating are destabilizing effects near the ground. Therefore, a well mixed layer favoring cloud formation near the ground is produced. At the boundary between stable subsiding air and the mixed layer, a temperature inversion occurs. Since the layer of temperature in- version suppresses vertical air motions through it, this layer is very stable. The air above the inversion therefore is typically dry, stable and cloud free, while below, the air is cloudy, unstable and moist.

The strength and the height of the inversion layer varies diurnally, seasonally and geographically. It is clear, that observatories should be located in altitudes above the inversion layer. Also the importance of inversion layer stability is evident. The inversion undergoes a daily cycle resulting from surface heating during the day and cooling at night. Radiative cooling at night suppresses mixing near the ground and therefore lowers the inversion layer. If surface heating is not too strong, the inversion layer may also be below the typical altitude of a telescope site during the day.

Seasonal variations depend on latitude. In the subtropical regions, atmospheric disturbances occur more often during summer, thus destabilizing the inversion layer, while more temperate latitudes are affected by atmospheric disturbances in the winter months. The height and the strength of the inversion layer is also influenced by oceanic versus continental effects. Daily cycles in oceanic regions are more moderate than in continental regions because ground generally heats up and cools down more than water. In continental sites, surface heating in the summer can be so extreme that convection starts to dominate the effects of subsidence. Thus, the altitude of the inversion layer is increased, the layer itself is weakened or disappears completely.

The diurnal cycle of heating and cooling is moderated by the water’s high heat capacity. Moreover, a large fraction of incident solar energy is used for evaporation. As a consequence, the depth of the mixed layer, as well as strength and height of the inversion, are more diurnally and seasonally stable.

The advantage of oceanic sites, like the Canary Island La Palma, therefore, is the semi-permanent inversion layer with small diurnal and seasonal variations.

The passage of cyclones from west to east across mid-latitudes can also cause the break down of the inversion layer in subtropical regions, see Figure 4.1. Since most observatory sites are located at an altitude above the inversion layer, atmospheric transparency almost entirely depends on the concentration of suspended particles in the air. Dust is one of the most common particulates affecting atmospheric transmission. The amount of dust particles depends on the distance and prevailing winds between the observatory site and the dust source. Convection can cause the dust particles to ascend where they can be trapped in stable layers. As a result, they can move horizontally with upper-level winds. An example is the easterly wind above the inversion layer which can carry Saharan dust to the Canary Islands. A satellite image of a sandstorm in the year 2001 and sand blown to the Canaries is also shown in Figure 4.2.

4.2 General Aspects of Climate Conditions at the Canary Island

The Canary Islands are located near the coast of the west African continent and they consist of seven islands: La Palma, El Hierro, La Gomera, Tenerife, Gran Canaria, Fuerteventure and Lanzarote.

Located in the southern edge of the Azores’ high, this group of islands is under the influence of trade winds. The trade winds are northeasterly winds caused by the deflection of the wind by the Coriolis force [36].

Azores’ high pressure causes the usual weather conditions to be dry and stable. The subsidence

(42)

30 CHAPTER 4. CANARY ISLANDS’ CLIMATE AND OBSERVING CONDITIONS

Figure 4.2: Saharan sand carried by wind to the Canary Islands, Credits to ESA and NASA, taken from [34] and [35]

inversion layer normally stabilizes the atmosphere, but if any atmospheric disturbance occurs, the inversion layer can be broken. The inversion layer at La Palma can frequently be found at an altitude of around 600-1500 meters.

Atmospheric disturbances typically occur during autumn and winter and are often connected to a displaced or weakened Azores’ high, while Atlantic low systems cross the latitude of the Canary Islands. Moreover, fresh water and wet air is carried by the cold Canaries’ current to the northern slope of the islands, see Figure 4.3. The northern slopes and high levels are most affected by precipitation. The following disturbances were detected and explain 80% of total precipitation [37]:

-Atlantic surface Lows over Canaries -Mediterranean surface Low

-Upper Air Low over Canaries -Upper Air trough

-Deep Atlantic Low

4.3 La Palma

At 26.8 N latitude and 17.9 W longitude La Palma is the western-most of the Canary Islands, about 400 km off the Moroccan coast of north-west Africa. The oceanic location ensures a mild and equitable climate throughout the year.

La Palma extends to 2.400 meters in altitude, well above the inversion layer. Due to the prevailing fresh wind coming from the north or north-west, low-cloud and mist often develop and lap at north slopes. The subsidence inversion layer of the Azores’ high is usually coincident with the top of these low clouds. As a result, higher altitude areas can often have more sunshine and clearer skies than northern coastal regions. Visibility conditions also improve with altitude, since a large drop in absolute humidity occurs above subsidence layer. The MAGIC-telescope is located at an altitude of about 2250 meters a.s.l., nearly on top of the Roque de los Muchachos.

Very occasionally, visibility can be reduced by dust storm clouds shown for example in Figure 4.2.

(43)

4.4. POSSIBLE IMPACT OF ATMOSPHERIC CONDITION ON AIR SHOWER OBSERVATION31

Figure 4.3: Average surface level pressure and surface winds [37]

These storms, which move eastward from the Saharan interior, also bring the hottest weather [38].

The Carlsberg Meridian Telescope on the Roque de los Muchachos measures column extinction values for the site every night. These values also show typical seasonal variability, like shown in Figure 4.4.

4.4 Possible Impact of Atmospheric Condition on Air Shower Observa- tion

The impact of atmospheric conditions on air shower development and the results for Cherenkov pho-

ton densities at ground are discussed in this subsection. The production of Cherenkov radiation de-

pends besides on the particle parameters on the refractive index, which in turns depends on air density

and therefore also on atmospheric temperature. A realistic vertical temperature profile can differ from

the vertical temperature profile of the U.S. Standard Atmosphere, since the U.S. Standard Atmosphere

presents mean values for an atmosphere at America. The deviations will depend on the location owing

to specific climatological conditions. Seasonal differences can be observed in atmospheric parameters.

Abbildung

Figure 2.2: The CT1 telescope from the HEGRA telescope array, from [8]
Figure 2.4: Schematic view of a neutron star, credits to NASA/CXC/SAO from [11]
Figure 2.8: The refractive index as a function of height, Figure taken from [18]
Figure 2.9: The Cherenkov angle as a function of atmospheric height, Figure taken from [18]
+7

Referenzen

ÄHNLICHE DOKUMENTE

If the raw blank is put onto a rotating plate, the final shape is a spherical surface of radius R according with the formula: R = sin r ϑ where r is the radius of curvature of

In this work we intend to provide a quantitative estimate of the MAGIC capabilities in observing GRBs, taking into account the main constraints which influence GRB observation which

† In the telescope, 162 m long optical fibers are used, instead of the 2 m long fibers utilized in this setup. However, no additional effects are expected due to the tiny attenuation

The analog signals are transmitted via optical fibers to the electronics hut where they are stretched, split into high and low gain channels and digitized with 300 MHz 8 bit Flash

The MAGIC (Major Atmospheric Gamma Imaging Cherenkov) Telescope was designed in 1998 [1] with the main goal of being the Imaging Atmospheric Cherenkov Telescope (IACT) with the

Ratio of L2T accepted events with a discriminator threshold of 6 phe , to the L1T accepted events with an higher discriminator threshold (8 phe ) as a function of energy, for

where T parameterizes the combination of intrinsic arrival time spread of the photons from the light pulser and the transit time spread of the PMT, T parameterizes the

In the MAGIC telescope the measure of the absolute time is provided by a high-precision atomic clock (Rubclock), formed by a Rubidium standard frequency oscillator in conjunction with