For Review Only
Patterns of deoxygenation - sensitivity to natural and anthropogenic drivers
Journal: Philosophical Transactions A Manuscript ID RSTA-2016-0325.R1
Article Type: Research Date Submitted by the Author: n/a
Complete List of Authors: Oschlies, Andreas; Helmholtz-Zentrum fur Ozeanforschung Kiel Standort Westufer Duteil, Olaf; Helmholtz-Zentrum fur Ozeanforschung Kiel Standort Westufer Getzlaff, Julia; Helmholtz-Zentrum fur Ozeanforschung Kiel Standort Westufer Koeve, Wolfgang; Helmholtz-Zentrum fur Ozeanforschung Kiel Standort Westufer Landolfi, Angela; Helmholtz-Zentrum fur Ozeanforschung Kiel Standort Westufer Schmidtko, Sunke; Helmholtz-Zentrum fur Ozeanforschung Kiel Standort Westufer Issue Code: Click <a
href=http://rsta.royalsocietypublishing.org/site/misc/issue- codes.xhtml target=_new>here</a> to find the code for
your issue.:
DM0916
Subject: Biogeochemistry < EARTH SCIENCES, Oceanography < EARTH SCIENCES
Keywords: marine oxygen, deoxygenation, climate change
For Review Only
Phil. Trans. R. Soc. A.
doi:10.1098/not yet assigned
1
Patterns of deoxygenation – sensitivity to natural and anthropogenic drivers
Andreas Oschlies, Olaf Duteil, Julia Getzlaff, Wolfgang Koeve, Angela Landolfi and Sunke Schmidtko
GEOMAR Helmholtz Centre for Ocean Research Kiel, and Kiel University, Germany Keywords: marine oxygen, deoxygenation, climate change
Summary
Observational estimates and numerical models both indicate a significant overall decline in marine oxygen levels over the past decades. Spatial patterns of oxygen change, however, differ considerably between observed and modelled estimates. Particularly in the tropical thermocline that hosts open-ocean oxygen minimum zones, observations indicate a general oxygen decline, whereas most state-of-the-art models simulate increasing oxygen levels.
Possible reasons for the apparent model-data discrepancies are examined. In order to attribute observed historical variations in oxygen levels, we here study mechanisms of changes in oxygen supply and consumption with sensitivity model simulations.
Specifically, the role of equatorial jets, of lateral and diapycnal mixing processes, of changes in the wind-driven circulation and atmospheric nutrient supply, and of some poorly
constrained biogeochemical processes are investigated. Predominantly wind-driven
changes in the low-latitude oceanic ventilation are identified as possible factor contributing to observed oxygen changes in the low-latitude thermocline during the past decades, while the potential role of biogeochemical processes remains difficult to constrain. We discuss implications for the attribution of observed oxygen changes to anthropogenic impacts as well as research priorities that may help to improve our mechanistic understanding of oxygen changes and the quality of projections into a changing future.
*Author for correspondence (aoschlies@geomar.de).
†Present address: GEOMAR Helmholtz Centre for Ocean Research Kiel, Düsternbrooker Weg 20, 24105 Kiel, Germany
3 4 5 6 7 8 9 10 11 12 13 14 15 16 17 18 19 20 21 22 23 24 25 26 27 28 29 30 31 32 33 34 35 36 37 38 39 40 41 42 43 44 45 46 47 48 49 50 51 52 53 54 55 56 57 58 59 60
For Review Only
Introduction
Analyses of historical measurements of dissolved marine oxygen have revealed a systematic decline of oxygen levels in the tropical thermocline over the recent decades.
Stramma et al.’s [1] compilation of oxygen measurements over the past five decades revealed the first robust evidence for an almost continuous decline of dissolved oxygen in several regions of the tropical ocean’s thermocline. All but one out of the six regions chosen showed a decline in thermocline oxygen. Oxygen concentrations in the Atlantic and Pacific tropical oceans declined and no clear oxygen trend could be found for the region in the eastern part of the tropical Indian Ocean. Concentrating on the shorter period of 1970 to 1992, Helm et al. [2] could extend the analysis to zonal and vertical averages of global-ocean oxygen changes. Their results indicated that, over the time interval chosen, the volumetric oxygen decline was most pronounced at high latitudes throughout the water column and in the tropical thermocline. This was mostly confirmed by a recent full-depth linear trend analysis of oxygen change [3]. A zonally averaged oxygen increase is only found in narrow bands in the upper few hundred meters of the subtropical ocean and also well below a thousand meters in the tropical ocean (Figure 2 of Helm et al. [2]). Focussing on the upper ocean, Stramma et al. [4] presented a global map of estimated linear oxygen trends in the thermocline (at about 300 m depth) over the five decades 1960 to 2010. For this longer time interval, and consistent with other observational analyses by Helm et al. [2] and Schmidtko et al. [3], their spatially resolved analysis revealed an oxygen decline in the tropical
thermocline and at high latitudes, separated by subtropical areas with positive oxygen trends (top left panel of Figure 1).
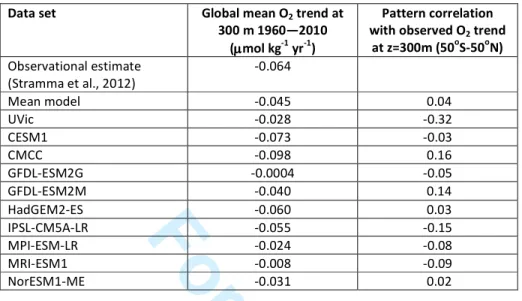
While there is some consistency among different observational estimates of recent multi- decadal oxygen trends in the upper ocean, our analysis of the results of the most recent fifths phase of the Climate Model Intercomparision Project (CMIP5, [5]) reveals a rather different picture (Fig.1). Most of the models that included oxygen in the archived output ([6, 7, 8, 9, 10, 11, 12, 13], Table 1) show increasing linear oxygen trends over the period 1960- 2010 over large areas of the tropical thermocline. Trends become more negative in the subtropics, reaching largest oxygen declines at mid to high latitudes. In fact the pattern correlation between simulated oxygen trends and the observational trend estimate is very weak for all models, and even slightly negative for 6 out of 10 models (computed over the
http://mc.manuscriptcentral.com/issue-ptrsa 3
4 5 6 7 8 9 10 11 12 13 14 15 16 17 18 19 20 21 22 23 24 25 26 27 28 29 30 31 32 33 34 35 36 37 38 39 40 41 42 43 44 45 46 47 48 49 50 51 52 53 54 55 56 57 58 59 60
For Review Only
latitude range 50o S – 50o N, Table 2). The weak pattern correlations of any model with the observational estimate, as well as among the different models themselves, is per se not unexpected: All CMIP5 model runs used here are forced by historical CO2 emissions (and those of other greenhouse gases and land-use change), but have their own internal ocean- atmosphere dynamics and thus cannot be expected to simulate patterns associated with internal climate variability in phase with the observations. The UVic model of intermediate complexity [14], on the other hand, is driven by prescribed monthly varying climatological winds and thus cannot display realistic levels of internal climate variability. The common forcing of all models is greenhouse-driven global warming. The absence of statistically significant correlations between observed and simulated patterns of multi-decadal oxygen change suggests that this global warming alone cannot explain the observed patterns of multi-decadal oxygen trends. Could this mean that the observed oxygen decline in the tropical thermocline is not related to anthropogenic climate change but, for example, a result of internal natural variability in the ocean-climate system? Or does the absence of significant correlations indicate some systematic model deficiencies?
In the following we investigate the discrepancies between observed and simulated oxygen trends in more detail and aim to identify the causes of these differences. From our results we infer research priorities that may help to reduce uncertainties and yield more robust model projections. In the final section of the paper we will discuss, based on our model results, to what extent the observed changes in thermocline oxygen levels may be natural variability or anthropogenically driven change.
Possible causes of model-data mismatch
The zonally averaged pattern of the observational estimate of the 1960—2010 thermocline oxygen trend is shown in Figure 2 together with the zonal average of the mean of all CMIP5 model simulations. Also shown is the zonally averaged oxygen trend obtained by
resampling and interpolating each individual CMIP5 model simulation in the same way the observations were obtained – using space and time of every individual 300 m observation.
The averaged resampled model trend is almost identical to that of the full models, which gives some confidence into the robustness of the mapping algorithm applied to the still
http://mc.manuscriptcentral.com/issue-ptrsa 3
4 5 6 7 8 9 10 11 12 13 14 15 16 17 18 19 20 21 22 23 24 25 26 27 28 29 30 31 32 33 34 35 36 37 38 39 40 41 42 43 44 45 46 47 48 49 50 51 52 53 54 55 56 57 58 59 60
For Review Only
sparse observational data [4]. Since the computationally efficient UVic model will in the following be used for a number of sensitivity studies we show in Figure 2 along with the CMIP5 models the results of the UVic reference simulation UVic REF. Important for justifying the use of the UVic model for sensitivity experiments, the CMIP5 model mean and the UVic REF model yield very similar results for the zonally averaged 50-yr oxygen trend in the thermocline. In the tropical thermocline, only a small oxygen decline (less than 0.04 µmol kg-1 yr-1) and, in the case of the UVic model, even a slight oxygen gain is
simulated in the tropical thermocline, with larger oxygen losses in the subtropics and mid latitudes. This zonally averaged pattern is essentially inverse to that of the observational trend estimate that indicates a substantial oxygen decline in the tropics (more than 0.2 µmol kg-1 yr-1) accompanied by small oxygen gains in the subtropics. Only poleward of about 55 degrees south and 40 degrees north do both simulated and observed oxygen trends show a decline and even some quantitative agreement. Despite the spatial anti-correlation of the zonally averaged trends, the globally averaged oxygen decline at 300m depth is very similar. The observational estimate (0.06 µmol kg-1 yr-1) and the CMIP5 model mean (0.05 µmol kg-1 yr-1) and the UVic REF model (0.03 µmol kg-1 yr-1) closely agree with each other, despite some variability among the individual models (Table 2), see also Bopp et al. [15] and Cocco et al. [16] for inter-model variations in simulated oxygen.
The common forcing of the CMIP5 models and the UVic model are historical CO2 emissions.
However, neither the CMIP5 model mean nor the UVic model reproduces the observed oxygen decline in the tropical thermocline. To the extent that current models are
dynamically realistic, this suggests that CO2-driven global warming alone cannot explain the negative oxygen trend in the tropical thermocline. In an attempt to understand why current models do not reproduce the observed multi-decadal oxygen decline in the tropical thermocline, in the following we investigate potential impacts of other processes on
thermocline oxygen trends by running a number of sensitivity simulations with the UVic model. Restricting the sensitivity experiments to a single, relatively coarse-resolution model, can yield only first-order estimates, and more robust inferences will require follow- on studies with other earth system models. Nevertheless, the UVic results are useful for pointing to the mechanisms worthwhile exploring in more elaborate follow-on studies. For the analysis, we begin here with possible model deficiencies in physical transport and
http://mc.manuscriptcentral.com/issue-ptrsa 3
4 5 6 7 8 9 10 11 12 13 14 15 16 17 18 19 20 21 22 23 24 25 26 27 28 29 30 31 32 33 34 35 36 37 38 39 40 41 42 43 44 45 46 47 48 49 50 51 52 53 54 55 56 57 58 59 60
For Review Only
ventilation before moving to potential impacts of poorly represented biogeochemical processes and finally speculating about the possible role of fisheries.
(i) Mixing: Previous studies have already investigated the role of mixing processes in simulating thermocline oxygen distributions. Sensitivity studies using the UVic model revealed that, for a business-as-usual CO2 emissions scenario low oxygen regions expanded for high diapycnal mixing rates, and shrank for low diapycnal mixing rates [17]. This finding could be related to the larger decline of export production under global warming for lower diapycnal mixing [17]. The same behaviour is also found for oxygen levels in the tropical thermocline simulated over the period 1960-2010 with oxygen trends being
somewhat more negative (by about 0.04 µmol kg-1 yr-1) for high diapycnal mixing (kv=0.3 cm2 s-1) relative to low (kv=0.01 cm2 s-1) diapycnal mixing (Fig. 5 of Stramma et al. [4]). The reference simulation uses a background diapycnal mixing intensity of kv=0.15 cm2 s-1. Although systematic, this sensitivity of simulated tropical thermocline oxygen trends to diapycnal mixing remains small compared to the model data misfit displayed in Figure 2.
Sensitivity studies with different strenghts of isopycnal mixing have demonstrated a
significant impact on the mean state of simulated oxygen distributions [18], but have, as far as we know, not yet been analysed in terms of oxygen trends. Simulations with enhanced zonal isopycnal mixing in the tropical ocean as a pragmatic way to parameterise the effects of unresolved equatorial current bands [19] did affect the simulated evolution of eastern boundary oxygen minimum zones, but had little effect on the zonally averaged oxygen trends.
(ii) Winds: Wind changes have already been suggested by Stramma et al. [4] as possible mechanism that can substantially impact multi-decadal thermocline oxygen trends. Since the CMIP5 models are all coupled atmosphere-ocean models that simulate their own internal variability, it is plausible that atmospheric modes will be out of phase with observations. If winds play a dominant role in controlling tropical thermocline oxygen levels, this could then explain the poor agreement of coupled climate models with observed oxygen trends. For tropical oxygen, both local wind changes in the tropics and also remote wind changes at higher latitudes may be important.
http://mc.manuscriptcentral.com/issue-ptrsa 3
4 5 6 7 8 9 10 11 12 13 14 15 16 17 18 19 20 21 22 23 24 25 26 27 28 29 30 31 32 33 34 35 36 37 38 39 40 41 42 43 44 45 46 47 48 49 50 51 52 53 54 55 56 57 58 59 60
For Review Only
Changes in tropical trade winds have been observed and their possible impact on marine oxygen patterns was investigated in experiments using the UVic model [20]. Results indicated a see-saw like impact on oxygen levels in the tropical oceans. The compensatory nature of changes in the eastern and western parts of the basins does not make tropical trade wind changes a likely candidate for zonally averaged oxygen changes. Remote wind changes in the Southern Ocean, on the other hand, may impact the ocean without being bounded by continents and therefore have no straightforward mechanism for zonal compensation of zonal wind-induced changes.
Southern Ocean wind changes have been identified as one of the most dominant changes in global wind patterns during the past decades [21]. We tested the potential impact of the observed increase and poleward migration of the southern hemispheric westerlies by applying these wind anomalies to the UVic model [22]. Starting from a spun-up pre- industrial state in year 1800, the increasing westerly winds south of 40°S lead to a small reduction of tropical thermocline oxygen levels (by up to 0.03 µmol kg-1 yr-1) compared to the reference experiment during the time period 1960-2010 in our model (Fig.3a). This oxygen reduction is primarily related to the southward shift of the subtropical gyre circulation that increases the distance between mid-latitude subduction regions and the tropics and, in turn, leads to a decrease of the oxygen supply via newly ventilated oxygen- rich waters of subantarctic origin [22] This effect might be underestimated in CMIP5 models that do not fully reproduce the observed trends in speed and position of the southern hemispheric westerlies [23], but it appears an order of magnitude too small to explain the discrepancy between observed and simulated oxygen changes.
Long-term wind changes have also been reported for other regions of the planet and are often associated with climate modes such as the North Atlantic Oscillation (NAO) [24] or Pacific Decadal Oscillation (PDO) [25]. There is robust evidence that the NAO has some impacts on winter mixed-layer depths, ventilation and nutrient supply to the mid and high latitudes of the North Atlantic and the upwelling region off Mauretania [26] and can significantly affect mid- and high-latitude oxygen levels [27] and marine ecosystems in the western and eastern North Atlantic [28]. However, the NAO seems to have little direct impacts on oxygen levels in the low-latitude North Atlantic [29].
http://mc.manuscriptcentral.com/issue-ptrsa 3
4 5 6 7 8 9 10 11 12 13 14 15 16 17 18 19 20 21 22 23 24 25 26 27 28 29 30 31 32 33 34 35 36 37 38 39 40 41 42 43 44 45 46 47 48 49 50 51 52 53 54 55 56 57 58 59 60
For Review Only
For the Pacific Ocean, significant impacts of the PDO on tropical oxygen changes have been inferred from observations and models. PDO-driven changes in the depth of the tropical thermocline have been suggested to affect the upper-ocean supply of nutrients, associated biological production and subsequent respiratory oxygen consumption [30]. This
mechanism would explain observed oxygen changes by changes in oxygen demand.
Alternative mechanisms have been proposed, focusing on variations in oxygen supply.
These include PDO-driven variations in the subduction-driven injection of oxygenated surface waters into the thermocline [31], the above-mentioned imprint of Southern Ocean wind changes on the source waters that eventually feed tropical oxygen minimum zones [22] and also wind-driven changes in the subtropical cells [32] and subtropical gyres [33].
The individual contributions of the different mechanisms to the observed oxygen changes are still not well understood and are a matter of ongoing research.
Forcing the UVic model with monthly mean CORE (Co-ordinated Ocean-ice Reference Experiments [34]) reanalysis winds over the period 1958-2007 (and then repeating 2007 winds for another three years until year 2010), the simulated linear 50-year oxygen trend can either be positive or negative, depending on the winds used in the model spin-up prior to the observational period (1960-2010): When the 1958-1967 mean CORE winds are used to spin up the model until year 1958 with interannually varying CORE winds applied
thereafter, oxygen levels in the tropical thermocline increase in the UVic model and also in a 0.5 degree resolution forced ocean model of the NEMO (Nucleus for European Modelling of the Ocean) consortium. However, when the model is spun up with the NCEP wind
climatology [35] prior to year 1958, with interannually varying CORE winds applied thereafter, oxygen levels in the tropical thermocline decrease during the period 1960-2010 (Fig. 3b). The different behavior of the two model simulations during the analysis period 1960-2010 can be related to the different model states at the end of the spin up. Although large-scale thermocline oxygen patterns at the end of the spin-ups are similar for the
NCAR/NCEP and CORE wind stress forcing, some regional differences exist: At the end of the spin-up, the simulation forced with NCAR/NCEP winds shows lower thermocline oxygen concentrations (by up to 60-80 µmol kg-1) along the equatorward margins of the Pacific subtropical gyres than the simulation forced with the 1958-1967 CORE winds (Figure 4a). In contrast, thermocline oxygen levels are higher (by up to 20-40 µmol kg-1) at the end of the NCAR/NCEP spin-up in the western equatorial Pacific. These end-of-spin-up oxygen
http://mc.manuscriptcentral.com/issue-ptrsa 3
4 5 6 7 8 9 10 11 12 13 14 15 16 17 18 19 20 21 22 23 24 25 26 27 28 29 30 31 32 33 34 35 36 37 38 39 40 41 42 43 44 45 46 47 48 49 50 51 52 53 54 55 56 57 58 59 60
For Review Only
differences are related to weaker trade winds in the NCEP/NCAR forcing compared to the 1958-1968 CORE reanalysis period (Figure 4b). In year 2010, i.e. at the end of the simulation forced with interannual 1958-2010 CORE forcing, the initial thermocline oxygen levels have been considerably reduced and in the western tropical Pacific even reverted (Figure 4c).
This is consistent with the more negative oxygen trend in the tropical thermocline
simulated by the run spun up with NCEP/NCAR climatological winds (Fig. 4d, Fig. 3b).
Our sensitivity simulations with different wind forcing fields during the spin-up reveal that despite identical wind forcing during the period 1960-2010, the simulated oxygen trends during this period are very sensitive to the applied wind forcing prior to the 1960s. Thus we conclude that the actual oxygen trend in the tropical thermocline is influenced by oxygen anomalies that may have been set during the formation of thermocline waters decades ago.
Given our still relatively poor knowledge of the oceanic wind forcing in the decades before the 1960s, we thus cannot rule out that the failure of forced models to reproduce the
observed 1960-2010 oxygen trend is caused by an unrealistic representation of the legacy of oxygen anomalies already `in the pipeline’ prior to the observational period. Further research into the potential immediate and lagged impacts of temporally varying wind patterns on tropical oxygen levels should help to clarify this issue.
(iii) Model resolution: Current climate models and even most stand-alone global ocean models have a grid resolution not fine enough to resolve the equatorial current bands that are known to be important agents of lateral oxygen transport in the tropical oceans [36, 37].
Evidence from 0.1o tropical ocean nests embedded into global models shows considerable improvement in the mean state of the simulated oxygen distributions [38]. However, effects of refined grid resolution on simulated oxygen trends have not yet been investigated. As found for the simulations with interannually varying CORE wind forcing, a 0.5o model revealed roughly similar oxygen trends as the coarser (1.8o x 3.6o) UVic model that only includes a pragmatic parameterisation of the effects of zonal current bands via enhanced zonal mixing close to the equator [19] (Fig.3b). Investigations of interannual changes in sea level height have also found little impact of refined model resolution (at least not up to ¼ degree grid resolution) in the tropical and subtropical oceans [39]. Interannually forced model simulations at much higher resolution should help to further clarify the role of small- scale equatorial transport processes for the observed multi-decadal oxygen trends. It also
http://mc.manuscriptcentral.com/issue-ptrsa 3
4 5 6 7 8 9 10 11 12 13 14 15 16 17 18 19 20 21 22 23 24 25 26 27 28 29 30 31 32 33 34 35 36 37 38 39 40 41 42 43 44 45 46 47 48 49 50 51 52 53 54 55 56 57 58 59 60
For Review Only
remains to be investigated whether changes in eddy activity and associated transport in oxygen, nutrients or organic matter may have played a role in observed oxygen changes.
(iv) Changes in atmospheric nutrient deposition: In addition to changes in physical transport of nutrients and oxygen within the ocean, there are also changes in the supply from the atmosphere. Changes in atmospheric oxygen concentrations are dominated by the seasonal cycle of biological production and respiration and by a long-term decline due to the burning of fossil fuels [40]. These changes are, however, of the order of parts per million and thus negligibly small compared to the observed changes in tropical thermocline
oxygen.
Much larger changes have occurred in atmospheric nutrient-containing aerosols and subsequent deposition, predominantly from anthropogenic sources. Deposition of nitrogen from the atmosphere to the ocean has more than tripled over the past century and is likely to increase further in the future [41]. Adding the increasing deposition of anthropogenic nitrogen to the ocean during the historical period [42] in our model simulations, we find a reduction of the simulated tropical-thermocline oxygen increase by some 0.015 µmol kg-1 yr-
1 (Figure 5a). This simulated impact of nitrogen deposition on thermocline oxygen is only
about half the size of that inferred from the model study by Ito et al. [43], and is also smallest of all the factors investigated in the current study. The considerable discrepancy between the two model solutions may be explained by the difference in the treatment of nitrogen cycle feedbacks, in particular via nitrogen fixation. While diazotrophs are ignored in the Ito et al. [43] study, they are included in our model simulations, where nitrogen fixation declines in response to the addition of fixed nitrogen to the surface ocean, limiting the net impact of anthropogenic nitrogen deposition on marine biogeochemistry and exerting a stabilizing negative feedback on the oceanic nitrogen inventory [44]. The importance of nitrogen fixation for the biogeochemical model response presents a serious caveat, as neither the absolute rates nor the environmental controls of marine nitrogen fixation are very well understood [e.g., 45]. Further studies are required to better constrain the potential impact of atmospheric nitrogen deposition on marine biogeochemistry, including oxygen concentrations.
http://mc.manuscriptcentral.com/issue-ptrsa 3
4 5 6 7 8 9 10 11 12 13 14 15 16 17 18 19 20 21 22 23 24 25 26 27 28 29 30 31 32 33 34 35 36 37 38 39 40 41 42 43 44 45 46 47 48 49 50 51 52 53 54 55 56 57 58 59 60
For Review Only
Another biotically important element with a substantial atmospheric supply to the ocean is iron. Though mostly derived from desert soils, with some contributions from combustion sources, substantial changes in iron have been reported over the past century, with substantial decadal variability [46]. Recent modelling studies suggest that changes in atmospheric deposition of iron may have had a larger impact on marine biogeochemistry than those in nitrogen deposition [47, 43], though models differ in the treatment of the marine iron cycle with still large conceptual and parametric uncertainties [48] and in the simulated response of nitrogen fixation to the supply of iron. A robust estimate of the possible contribution of atmospheric iron supply to the observed tropical oxygen decline will require further study.
(v) Changes related to ocean acidification: Another anthropogenic impact on ocean biogeochemistry is ocean acidification [49], which may give rise to a number of direct and indirect impacts on ocean biogeochemical cycles [50]. We here investigate the two main potential effects on oxygen, one arising from likely acidification impacts on the production of inorganic carbon [51], the other one on possible impacts on organic carbon production [52].
If calcium carbonate production is attenuated under ongoing acidification, there may be less ballast available to efficiently sink organic particles to great depth [51]. One consequence could be that remineralisation and hence oxygen consumption occurs at shallower depths, possibly leading to a further expansion of low oxygen regions [53]. According to their model simulations, regional oxygen changes in the upwelling area off Peru are in a range of 0.2-0.5 µmol kg-1 yr-1 and thus similar to observational estimates in that region (Figure 1).
The zonally averaged oxygen changes in the tropical thermocline are, however, smaller than 0.04 µmol kg-1 yr-1 in the same model, and can therefore explain only a small fraction (<20%) of the observational estimate of thermocline oxygen decline.
Another possible effect of ocean acidification might be the enhanced fertilization of marine algae by increased availability of carbon, leading to increasing carbon-to-nutrient ratios in the biological uptake and possibly export as inferred from mesocosm experiments [52]. A model simulation that extrapolated the local and short-term experimental results to centennial time scales and the global ocean hypothesised substantial effects of increasing carbon to nitrogen ratios in organic matter export on the respiratory oxygen demand and
http://mc.manuscriptcentral.com/issue-ptrsa 3
4 5 6 7 8 9 10 11 12 13 14 15 16 17 18 19 20 21 22 23 24 25 26 27 28 29 30 31 32 33 34 35 36 37 38 39 40 41 42 43 44 45 46 47 48 49 50 51 52 53 54 55 56 57 58 59 60
For Review Only
hence the extent of oxygen minimum zones [54]. While the volume of the tropical oxygen minimum zones increased by more than 50% in that simulation by the end of the century, changes remain relatively small over the historical time period 1960-2010 (Figure 5b). The model predicts an oxygen decline of about 0.05 µmol kg-1 yr-1in the tropical thermocline due to the hypothetic enhancement of C:N ratios over the period 1960-2010, similar in size as the proposed effect due to a predicted reduction in calcium carbonate ballast [53] and again a small portion of the model-data discrepancy. Both acidification-related effects would not be limited to the tropical oceans and be roughly proportional to the amount of export production.
(vi) Potential impacts of fisheries: An anthropogenic forcing that has, until now, not been considered with respect to ocean biogeochemistry is that of industrial fisheries. These are known to have substantially depleted the higher trophic levels over large areas of the global ocean [55]. Whether and to what extent this drastic modification at the upper end of the food chain has had, and will have, significant impacts on marine biogeochemistry and on oxygen levels is currently unknown. General biogeochemical circulation models commonly include only lower trophic levels with zooplankton constituting the highest trophic level.
Thus the explicit interaction with fish is generally neglected, but still implicitly included by the closure terms for energy and mass. These are typically prescribed by globally constant linear or quadratic zooplankton mortalities [e.g., 14].
It is not immediately clear how zooplankton biomass will change in response to fisheries.
Fishing pressure on large predators can lead to a decrease on the grazing pressure on smaller (planktivorous) fish, which in turn could lead to an increase of the grazing pressure on zooplankton, whereas fishing pressure on smaller fish can lead to a direct decrease of the grazing pressure on zooplankton. Any changes in zooplankton and phytoplankton biomass will affect export production and eventually oxygen utilisation. It is therefore possible that the expansion of fisheries over the historical period has left an imprint on changing oxygen concentrations, the possible extent of which has not been estimated yet.
In a heavily idealised sensitivity study we varied the parameter that determines the strength of the quadratic zooplankton mortality in the UVic model such that changes in zooplankton loss amount to about 10 times the estimated yield of global fisheries (2.3-3.4
http://mc.manuscriptcentral.com/issue-ptrsa 3
4 5 6 7 8 9 10 11 12 13 14 15 16 17 18 19 20 21 22 23 24 25 26 27 28 29 30 31 32 33 34 35 36 37 38 39 40 41 42 43 44 45 46 47 48 49 50 51 52 53 54 55 56 57 58 59 60
For Review Only
TgN/yr [56, 57]), reflecting an assumed 10% transfer efficiency between trophic levels [58].
This was obtained for alterations of the quadratic zooplankton mortality parameter from its standard value of 0.06 (mmol N/m3)-1day-1 to 0.09 (mmol N/m3)-1day-1 (simulation HIGH) and 0.03 (mmol N/m3)-1day-1 (simulation LOW), respectively (Figure 5b). Results of these idealised models show that local changes in export production can have some impact on thermocline oxygen levels. Under historical climate change and an assumed linear increase of industrial fisheries between 1900 and 2000 (staying constant afterwards), the simulated impact on the zonally averaged oxygen changes is of similar magnitude than the impacts found for potential CO2-induced changes in elemental stoichiometry. A robust estimate about the detailed impact on regional oxygen distributions or even the sign of oxygen change would require a more elaborate food-web model [e.g. 59] and will require further study.
Discussion and implications for future research
We have identified a systematic discrepancy between the observational estimate of tropical thermocline deoxygenation during the past 50 years and the oxygen trend simulated by hindcasts of current state-of-the-art biogeochemical climate models. In general, models driven by anthropogenic CO2 emissions do not reproduce the observed significant decline in tropical thermocline oxygen levels. Based on our current state-of-the-art models, we cannot, at present, mechanistically link CO2-induced global warming and tropical upper- ocean deoxygenation. This is consistent with results of a recent fingerprint analysis [60].
A number of sensitivity experiments performed with the UVic model and employing
different wind fields as well as parameterisations of anthropogenic perturbations other than CO2-induced global warming did find systematic impacts of increasing atmospheric
nutrient deposition, possible direct CO2 impacts on marine biogeochemistry, and also possible fisheries impacts on oxygen levels in the tropical thermocline. While the individual effects are, with the possible exception of changes in applied wind-stress fields (Fig.3b), small compared to the model-data misfit (Fig. 5), this reveals that anthropogenic impacts on marine oxygen levels may not be restricted to CO2-induced climate warming, but that atmospheric nutrient deposition, changes linked to ocean acidification, and impacts of global ocean fisheries may be factors that need to be considered in order to explain
http://mc.manuscriptcentral.com/issue-ptrsa 3
4 5 6 7 8 9 10 11 12 13 14 15 16 17 18 19 20 21 22 23 24 25 26 27 28 29 30 31 32 33 34 35 36 37 38 39 40 41 42 43 44 45 46 47 48 49 50 51 52 53 54 55 56 57 58 59 60
For Review Only
observed oxygen changes. Other mechanisms not investigated here may also have the potential to impact thermocline oxygen levels. These include potential changes in plankton size [61] or stoichiometry [62], ecological changes with possible impacts on biogeochemistry [63], and also changes in physical transport processes, e.g. via the tropical zonal current bands [64] that are not yet resolved by current models. Table 3 is an attempt to list the different causes and mechanisms of thermocline oxygen changes as well as our current level of understanding.
While the current study relies heavily on sensitivity experiments with a single, relatively coarse-resolution earth system model of intermediate complexity, future research will have to address and hopefully reduce the large uncertainties that remain about the degree of realism in the model description of these individual mechanisms that may have been responsible for observed changes in marine oxygen concentrations. The process that was found to generate largest changes in simulated oxygen trends was variability in the wind forcing, including forcing prior to the observational period. Better observational constraints on winds before the 1960s will help to yield more robust simulations of oxygen changes during the 50 years between 1960 and 2010. Information contained, for example, in ship logbooks, reanalyses combining historical pressure data and dynamical models, and proxy information may all help to improve the historical wind products. The fact that current models do not seem to be able to reproduce the patterns of thermocline oxygen changes that have been identified by decades of high-quality oxygen observations is a scientific challenge that has to be resolved in order to raise confidence in our models’ reliability when it comes to simulating the response, and possible feedbacks, of biogeochemical cycles to expected future environmental change.
Additional Information
Acknowledgments
We thank the CMIP5 modelling consortium for making the model results publicly available, and two anonymous reviewers for their valuable suggestions to improve the presentation.
Funding Statement
http://mc.manuscriptcentral.com/issue-ptrsa 3
4 5 6 7 8 9 10 11 12 13 14 15 16 17 18 19 20 21 22 23 24 25 26 27 28 29 30 31 32 33 34 35 36 37 38 39 40 41 42 43 44 45 46 47 48 49 50 51 52 53 54 55 56 57 58 59 60
For Review Only
Funding by the Deutsche Forschungsgemeinschaft via the SFB 754 (to AO and OD) and by the BMBF via BIOACID (grant 03F0728A to JG and WK) and SOPRAN (grant 03F0662A to AL) is acknowledged.
Data Accessibility
CMIP5 model data have been obtained from the Earth System Grid Federation (ESGF) CMIP5 repository (e.g. cmip-pcmdi.llnl.gov/cmip5/data_portal.html) and have been accessed in February 2014. All own model output reported in this this article is available via
http://thredds.geomar.de
Competing Interests
The authors have no competing interests.
Authors' Contributions
AO conceived the study and drafted the manuscript. SS analysed the historical oxygen data, WK analysed and resampled the CMIP5 modelled oxygen fields, JG and AL ran UVic model simulations, OD ran NEMO simulations. All authors contributed to the analysis, discussion and writing of the paper.
References
1 Stramma, L., Johnson, G. C., Sprintall J. & Mohrholz, V. 2008 Expanding oxygen-minimum zones in the tropical oceans. Science 320, 655–658, 05.
2 Helm, K. P., Bindoff, N. L. & Church, J. A. 2011 Observed decreases in oxygen content of the global ocean. Geophys. Res. Lett. 38, L23602. (doi:10.1029/2011GL049513)
3 Schmidtko, S., Stramma, L.& Visbeck, M. 2017 Decades of decline for oceanic oxygen. Nature 542, 335-339. (doi:10.1038/nature21399)
4 Stramma, L., Oschlies, A. & Schmidtko, S. 2012 Mismatch between observed and modeled trends in dissolved upper-ocean oxygen over the last 50 yr. Biogeosci. 9, 4045–4057.
5 Taylor, K.E., Stouffer R.J. & Meehl, G.A. 2012 An Overview of CMIP5 and the experiment design. Bull.
Amer. Meteor. Soc. 93, 485-498. (doi:10.1175/BAMS-D-11-00094.1)
6 Bentsen, M., Bethke, I., Debernard, J. B., Iversen, T., Kirkevåg, A., Seland, Ø., Drange, H., Roelandt, C., Seierstad, I. A., Hoose, C. & Kristjánsson, J. E. 2013 The Norwegian Earth System Model, NorESM1-M – Part 1: Description and basic evaluation of the physical climate. Geosci. Model Dev. 6 687–720. (doi:10.5194/gmd-6-687-2013)
7 Collins, W.J., Bellouin, N., Doutriaux-Boucher, M., Gedney, N., Halloran, P., Hinton, T., Hughes, J., Jones, C. D., Joshi, M., Liddicoat, S. et al. 2011 Development and evaluation of an Earth-System model – HadGEM2. Geosci. Model Dev. 4, 1051–1075 (doi:10.5194/gmd-4-1051-2011)
http://mc.manuscriptcentral.com/issue-ptrsa 3
4 5 6 7 8 9 10 11 12 13 14 15 16 17 18 19 20 21 22 23 24 25 26 27 28 29 30 31 32 33 34 35 36 37 38 39 40 41 42 43 44 45 46 47 48 49 50 51 52 53 54 55 56 57 58 59 60
For Review Only
8 Dufresne, J.-L., Foujols, M.-A., Denvil, S., Caubel, A., Marti, O., et al. 2013 Climate change projections using the IPSL-CM5 Earth System Model: from CMIP3 to CMIP5. Clim. Dyn. 40, 2123–2165.
(doi:10.1007/s00382-012-1636-1)
9 Dunne, J. P., John, J., Adcroft, A., Griffies, S. M., Hallberg, R. W., Shevliakova, E., Stouffer, R. J., et al. 2012 GFDL’s ESM2 global coupled climate-carbon Earth System Models Part I: Physical
formulation and baseline simulation characteristics. J. Clim. 25, (doi:10.1175/JCLI-D-11-00560.1)
10 Gent, P. R., Danabasoglu, G., Donner, L. J., Holland, M. M., Hunke, E. C., Jayn, S. R., Lawrence, D.
M., Neale, R. B., Rasch, P. J., Vertenstein, M., Worley, P. H., Yang, Z.-L. & Zhang, M. 2011 The Community Climate System Model version 4. J. Climate 24, 4973–4991.
11 Giorgetta, M. A., Jungclaus, J. H., Reick, C. H., Legutke, S., Brovkin, V., Crueger, T., Esch, M., Fieg, K., Glushak, K., Gayler, V., et al. 2013 Climate change from 1850 to 2100 in MPI-ESM simulations for the Coupled Model Intercomparison Project 5. JAMES (doi:10.1002/jame.20038)
12 Vichi, E., Manzini, P., Fogli G., Alessandri, A., Patara, L., Scoccimarro, E., Masina, S. & Navarra, A.
2011 Global and regional ocean carbon uptake and climate change: Sensitivity to a substantial mitigation scenario. Clim. Dyn. 37, 1929-1947.
13 Yukimoto, S., Yoshimura, H., Hosaka, M., Sakami, T., Tsujino, H., Hirabara, M., Tanaka, T.Y., Deushi, M., Obata, A., Nakano, H., et al. 2011 Meteorological Research Institute-Earth System Model v1 (MRI- ESM1) - Model Description. Technical Report of MRI, No. 64, 83 pp.
14 Keller, D. P., Oschlies, A. & Eby M. 2012 A new marine ecosystem model for the University of Victoria earth system climate model. Geosci. Model Dev. 5, 1195–1220.
15 Bopp, L., Resplandy, L., Orr, J. C., Doney, S. C., Dunne, J. P., Gehlen, M., Halloran, P., Heinze, C., Ilyina, T., Séférian, R. et al. 2013 Multiple stressors of ocean ecosystems in the 21st century:
projections with CMIP5 models. Biogeosci. 10, 6225–6245.
16 Cocco, V., Joos, F., Steinacher, M., Frölicher, T. L., Bopp, L., Dunne, J., Gehlen, M., Heinze, C., Orr, J., Oschlies A. et al. 2013 Oxygen and indicators of stress for marine life in multi-model global warming projections. Biogeosci. 10, 1849–1868.
17 Duteil, O. & Oschlies, A. 2011 Sensitivity of simulated extent and future evolution of marine suboxia to mixing intensity. Geophys. Res. Lett. 38, L06607.
18 Gnanadesikan, A., Bianchi, D. & Pradal, M.-A. 2013 Critical role for mesoscale eddy diffusion in supplying oxygen to hypoxic ocean waters. Geophys. Res. Lett. 40, (doi:10.1002/grl.50998)
19 Getzlaff, J. & Dietze, H. 2013 Effects of increased isopycnal diffusivity mimicking the unresolved equatorial intermediate current system in an earth system climate model. Geophys. Res. Lett. 40, 2166– 2170.
20 Ridder, N. N. & England, M. H. 2014 Sensitivity of ocean oxygenation to variations in tropical zonal wind stress magnitude. Global Biogeochem. Cycles 28, 909–926.
21 Thompson, D. W. J. & Solomon, S. 2002 Interpretation of recent southern hemisphere climate change. Science 296, 895—899.
22 Getzlaff, J., Dietze, H. & Oschlies, A. 2016 Simulated effects of southern hemispheric wind changes on the Pacific oxygen minimum zone. Geophys.Res. Lett. 43, 728–734.
23 Swart, N. C. & Fyfe, J. C. 2012 Observed and simulated changes in the southern hemisphere surface westerly wind-stress. Geophys. Res. Lett. 39 (doi:10.1029/2012GL052810)
24 Hurrell, J. W., Kushnir, Y. & Visbeck, M. 2001 The North Atlantic Oscillation. Science 291, 603—604.
25 Newman, M., Alexander, M. A., Ault, T. R., Cobb, K. M., Deser, C., Di Lorenzo, E., Mantua, N. J., Miller, A. J., Minobe, S., Nakamura, H., et al. 2016 The Pacific Decadal Oscillation, revisited. J. Clim.
29, 4399–4427.
http://mc.manuscriptcentral.com/issue-ptrsa 3
4 5 6 7 8 9 10 11 12 13 14 15 16 17 18 19 20 21 22 23 24 25 26 27 28 29 30 31 32 33 34 35 36 37 38 39 40 41 42 43 44 45 46 47 48 49 50 51 52 53 54 55 56 57 58 59 60
For Review Only
27 Stendardo, I. & Gruber, N. 2012 Oxygen trends over five decades in the North Atlantic. J. Geophys.
Res. Oceans 117, C11004.
28 Drinkwater, K. F., Belgrano, A., Borja, A., Conversi, A., Edwards, M., Greene, C. H., Ottersen, G., Pershing, A. J. & Walker, H. 2003 The Response of Marine Ecosystems to Climate Variability Associated with the North Atlantic Oscillation, pp. 211–234. American Geophysical Union.
29 Montes, E., Muller-Karger, F. E., Cianca, A., Lomas, M. W., Lorenzoni, L. & Habtes, S. 2016 Decadal variability in the oxygen inventory of North Atlantic subtropical underwater captured by sustained, long- term oceanographic time series observations. Global Biogeochem. Cycles 30, 460–478.
30 Deutsch, C., Brix H., Ito T., Frenzel, H. & Thompson, L. 2011 Climate-forced variability of ocean hypoxia. Science 333, 336–339, 07.
31 Kwon, E. Y., Deutsch, C., Xie, S.-P., Schmidtko, S. & Cho, Y.-K. 2016a The North Pacific oxygen uptake rates over the past half century. J.Clim. 29, 61–76.
32 Duteil, O., Böning, C. W. & Oschlies, A. 2014a Variability in subtropical-tropical cells drives oxygen levels in the tropical Pacific Ocean. Geophys. Res. Lett. 41, 8926–8934.
33 Kwon, E. Y., Kim, Y. H., Park, Y.-G., Park, Y.-H., Dunne, J. & Chang, K.-I. 2016b Multidecadal wind- driven shifts in northwest Pacific temperature, salinity, O2, and PO4. Global Biogeochem. Cycles 30, 1599–1619.
34 Large, W. G. & Yeager, S. G. 2004 Diurnal to decadal global forcing for ocean and sea-ice models:
The data sets and flux climatologies. NCAR technical note, NCAR/TN-460+STR.
35 Kalnay, E., Kanamitsu, M., Kistler, R., Collins, W., Deaven, D., Gandin, L., Iredell, M., Saha, S., White, G. & Woollen, J. 1996 The NCEP/NCAR 40-year reanalysis project. Bulletin of the American
Meteorological Society, 77, 437–471.
36 Brandt, P., Bange, H. W., Banyte, D., Dengler, M., Didwischus, S.-H., Fischer, T., Greatbatch, R. J., Hahn, J., Kanzow, T., Karstensen, J. et al. 2015 On the role of circulation and mixing in the ventilation of oxygen minimum zones with a focus on the eastern tropical North Atlantic. Biogeosci.12, 489–512.
37 Dietze, H. & Loeptien, U. 2013 Revisiting “nutrient trapping” in global coupled biogeochemical ocean circulation models. Global Biogeochem. Cycles 27(2):265–284.
38 Duteil, O., Schwarzkopf, F. U., Böning, C. W. & Oschlies, A. 2014b Major role of the equatorial current system in setting oxygen levels in the eastern tropical Atlantic Ocean: A high-resolution model study.
Geophys. Res. Lett. 41, 2013GL058888.
39 Penduff, T., Juza, M., Brodeau, L., Smith, G. C., Barnier, B., Molines, J.-M., Treguier, A.-M. & Madec, G. 2010 Impact of global ocean model resolution on sea-level variability with emphasis on interannual time scales. Ocean Sci. 6, 269–284.
40 Keeling, R. F. & Shertz, S. R. 1992 Seasonal and interannual variations in atmospheric oxygen and implications for the global carbon cycle. Nature 358, 723–727.
41 Duce, R. A., LaRoche, J., Altieri, K., Arrigo, K. R., Baker, A. R., Capone, D. G., Cornell, S., Dentener, F., Galloway, J., Ganeshram, R. S. et al. 2008 Impacts of atmospheric anthropogenic nitrogen on the open ocean. Science 320, 893–897.
42 Lamarque, J.-F., Dentener, F., McConnell, J., Ro, C.-U., Shaw, M., Vet, R., Bergmann, D., Cameron- Smith, P., Dalsoren, S., Doherty, R., et al. 2013 Multi-model mean nitrogen and sulfur deposition from the Atmospheric Chemistry and Climate Model Intercomparison Project (ACCMIP): evaluation of historical and projected future changes. Atmos. Chem. Phys. 13, 7997–8018.
43 Ito, T., Nenes, A., Johnson, M. S., Meskhidze, N. & Deutsch, C. 2016 Acceleration of oxygen decline in the tropical Pacific over the past decades by aerosol pollutants. Nature Geosci. 9, 443–447.
http://mc.manuscriptcentral.com/issue-ptrsa 3
4 5 6 7 8 9 10 11 12 13 14 15 16 17 18 19 20 21 22 23 24 25 26 27 28 29 30 31 32 33 34 35 36 37 38 39 40 41 42 43 44 45 46 47 48 49 50 51 52 53 54 55 56 57 58 59 60
For Review Only
deposition on marine productivity due to biogeochemical feedbacks in a global ocean model.
Geophys. Res. Lett. 43, 4500–4509.
45 Landolfi, A., Koeve, W., Dietze, H., Kähler, P. & Oschlies, A. 2015 A new perspective on environmental controls of marine nitrogen fixation. Geophys. Res. Lett. 42, 4482—4489.
46 Mahowald, N. M., Engelstaedter, S., Luo, C., Sealy, A., Artaxo, P., Benitez-Nelson, C., Bonnet, S., Chen, Y., Chuang, P. Y., Cohen, D. D., Dulac, F., et al. 2008 Atmospheric iron deposition: Global distribution, variability, and human perturbations. Annu. Rev. Mar. Sci. 1, 245–278.
47 Krishnamurthy, A., Moore, J. K., Mahowald, N., Luo, C., Doney, S. C., Lindsay, K. & Zender, C. S.
2009 Impacts of increasing anthropogenic soluble iron and nitrogen deposition on ocean biogeochemistry. Global Biogeochem. Cycles 23, GB3016. (doi:10.1029/2008GB003440)
48 Tagliabue, A., Aumont, O., DeAth, R., Dunne, J. P., Dutkiewicz, S., Galbraith, E., Misumi, K., Moore, J. K., Ridgwell, A., Sherman, E. et al. 2016 How well do global ocean biogeochemistry models simulate dissolved iron distributions? Global Biogeochem. Cycles 30, 149–174.
49 Doney, S.C., Fabry, V. J., Feely, R. A. & Kleypas, J. A. 2009 Ocean acidification: the other CO2 problem. Annu. Rev. Mar. Sci. 1, 169–192. (doi: 10.1146/annurev.marine.010908.163834)
50 Gehlen, M., Gruber, N., Gangsto, R., Bopp, L. & Oschlies, A. 2011 Biogeochemical consequences of ocean acidification and feedback to the Earth system. In Ocean Acidification, Eds. J.-P. Gattuso and L. Hansson, Oxford University Press., pp 230—248.
51 de Jesus Mendes, P. A. & Thomsen, L. 2012 Effects of ocean acidification on the ballast of surface aggregates sinking through the twilight zone. PLoS ONE 7(12), e50865.
(doi:10.1371/journal.pone.0050865, 2012)
52 Riebesell, U., Schulz, K. G., Bellerby, R. G. J., Botros, M., Fritsche, P., Meyerhoefer, M., Neill, C., Nondal, G., Oschlies, A., Wohlers, J. & Zoellner, E. 2007 Enhanced biological carbon consumption in a high CO2 ocean. Nature 450, 545–548.
53 Hofmann, M. & Schellnhuber, H.-J. 2009 Oceanic acidification affects marine carbon pump and triggers extended marine oxygen holes. Proc. Nat. Acad. Sci. 106, 3017–3022.
54 Oschlies, A., Schulz, K. G., Riebesell, U. & Schmittner, A. 2008 Simulated 21st century’s increase in oceanic suboxia by CO2-enhanced biotic carbon export. Global Biogeochem. Cycles 22, GB4008, (doi:10.1029/2007GB003147)
55 Christensen, V., Coll, M., Piroddi, C., Steenbeek, J., Buszowski, J. & Pauly, D. 2014 A century of fish biomass decline in the ocean. Mar. Ecol. Prog. Ser. 512, 155–166.
56 Maranger, R., Caraco, N., Duhamel, J. & Amyot, M. 2008 Nitrogen transfer from sea to land via commercial fisheries. Nature Geosci. 1, 111–112.
57 Pauly, D. & Zeller, D. 2006 Catch reconstructions reveal that global marine fisheries catches are higher than reported and declining. Nature Comm. 7, 10244. (doi:10.1038/ncomms10244)
58 Pauly, D. & Christensen, V. 1995 Primary production required to sustain global fisheries. Nature 374, 255–257.
59 Travers-Trolet, M., Shin, Y.-J., Shannon, L. J., Moloney, C. L. & Field, J. G. 2014 Combined fishing and climate forcing in the southern Benguela upwelling ecosystem: An end-to-end modelling approach reveals dampened effects. PLoS ONE 9(4), e94286. (doi:10.1371/journal.pone.0094286)
60 Andrews, O. D., Bindoff, N. L., Halloran, P. R., Ilyina, T. & Le Quéré, C. 2013 Detecting an external influence on recent changes in oceanic oxygen using an optimal fingerprinting method. Biogeosci. 10, 1799–1813.
61 Sommer, U., Paul, C. & Moustaka-Gouni, M. 2015 Warming and ocean acidification effects on phytoplankton—from species shifts to size shifts within species in a mesocosm experiment. PLoS ONE 10, e0125239.
http://mc.manuscriptcentral.com/issue-ptrsa 3
4 5 6 7 8 9 10 11 12 13 14 15 16 17 18 19 20 21 22 23 24 25 26 27 28 29 30 31 32 33 34 35 36 37 38 39 40 41 42 43 44 45 46 47 48 49 50 51 52 53 54 55 56 57 58 59 60
For Review Only
63 Dutkiewicz, S., Scott, J. R. & Follows, M. J. 2013 Winners and losers: Ecological and biogeochemical changes in a warming ocean. Global Biogeochem. Cycles 27, 463–477.
64 Brandt, P., Funk, A., Hormann, V., Dengler, M., Greatbatch, R. J. & Toole, J. M. 2011 Interannual atmospheric variability forced by the deep equatorial Atlantic Ocean. Nature 473, 497–500.
Tables
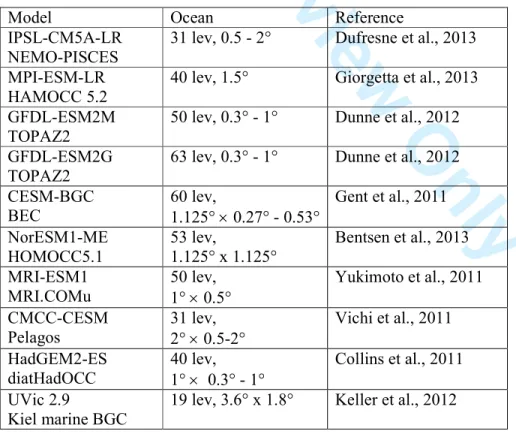
Table 1: Model configurations used in Figure 1.
Tab. 1: Brief description of the CMIP5 [Taylor et al., 2012)] and UVic models used in this study.
Column (1) indicates the Earth System Model (first line) and the respective biogeochemical ocean module (second line) used. Column (2) indicates vertical and horizontal resolution of the ocean model. For details see the references given in columns (3) and references therein. For our analysis we combined model output from emission driven Earth System Model runs from the historical period (1960-2005; esmHistorical) with runs from the RCP85 scenario (2006-2010; esmrcp85). CMIP5 model data are available from the Earth System Grid Federation (ESGF) CMIP5 repository (e.g.
cmip-pcmdi.llnl.gov/cmip5/data_portal.html) and have been accessed in February 2014.
Model Ocean Reference
IPSL-CM5A-LR NEMO-PISCES
31 lev, 0.5 - 2° Dufresne et al., 2013 MPI-ESM-LR
HAMOCC 5.2
40 lev, 1.5° Giorgetta et al., 2013 GFDL-ESM2M
TOPAZ2
50 lev, 0.3° - 1° Dunne et al., 2012 GFDL-ESM2G
TOPAZ2
63 lev, 0.3° - 1° Dunne et al., 2012 CESM-BGC
BEC
60 lev,
1.125° × 0.27° - 0.53°
Gent et al., 2011 NorESM1-ME
HOMOCC5.1
53 lev,
1.125° x 1.125°
Bentsen et al., 2013 MRI-ESM1
MRI.COMu
50 lev, 1° × 0.5°
Yukimoto et al., 2011 CMCC-CESM
Pelagos
31 lev, 2° × 0.5-2°
Vichi et al., 2011 HadGEM2-ES
diatHadOCC
40 lev, 1° × 0.3° - 1°
Collins et al., 2011 UVic 2.9
Kiel marine BGC
19 lev, 3.6° x 1.8° Keller et al., 2012
http://mc.manuscriptcentral.com/issue-ptrsa 3
4 5 6 7 8 9 10 11 12 13 14 15 16 17 18 19 20 21 22 23 24 25 26 27 28 29 30 31 32 33 34 35 36 37 38 39 40 41 42 43 44 45 46 47 48 49 50 51 52 53 54 55 56 57 58 59 60
For Review Only
simulated thermocline oxygen trends over the period 1960 to 2010.
Data set Global mean O2 trend at
300 m 1960—2010 (µµµµmol kg-1 yr-1)
Pattern correlation with observed O2 trend
at z=300m (50oS-50oN) Observational estimate
(Stramma et al., 2012)
-0.064
Mean model -0.045 0.04
UVic -0.028 -0.32
CESM1 -0.073 -0.03
CMCC -0.098 0.16
GFDL-ESM2G -0.0004 -0.05
GFDL-ESM2M -0.040 0.14
HadGEM2-ES -0.060 0.03
IPSL-CM5A-LR -0.055 -0.15
MPI-ESM-LR -0.024 -0.08
MRI-ESM1 -0.008 -0.09
NorESM1-ME -0.031 0.02
Table 3: Summary of causes, mechanisms and likely sign of tropical thermocline oxygen changes.
Cause Mechanism Sign of
O2
change
Magnitude Level of understanding
Warming Decrease in solubility
Enhanced stratification: reduced vertical mixing, less O2 ventilation (less O2), lower nutrient supply (more O2)
- +/-
medium small
high low for net effect
Acidification Reduced CaCO3 ballasting: shallower respiration
CO2 fertilisation
- -
small small
medium
low
Atmospheric nutrient supply
N fertilisation Fe fertilisation
- -
small small
medium medium Wind-driven
circulation changes
Strengthening and poleward
displacement of Southern Ocean winds Changes in tropical trade winds Changes in low & mid-latitude winds, including wind changes prior to O2
changes
-
+/- +/-
small
small large (?)
medium
medium low
Fisheries Impact on pelagic foodweb and carbon export
? small very low
Ecological changes
Size, export & remineralisation;
Stoichiometry
?
?
?
?
very low very low
http://mc.manuscriptcentral.com/issue-ptrsa 3
4 5 6 7 8 9 10 11 12 13 14 15 16 17 18 19 20 21 22 23 24 25 26 27 28 29 30 31 32 33 34 35 36 37 38 39 40 41 42 43 44 45 46 47 48 49 50 51 52 53 54 55 56 57 58 59 60
For Review Only
Figure and table captions
Figure 1. Linear trend of dissolved oxygen at 300 m depth computed over the 50-year period 1961 to 2010. The top left panel shows the observational estimate of Stramma et al.
[4], all other panels show results of numerical model simulations with trends computed from the simulated annual means. Model names indicated at each panel are resolved in Table 1. The “mean model” is the trend averaged over all shown model trends. UVic is the reference simulation by the Kiel version of the University of Victoria model used by
Getzlaff et al. [22], all other model data are taken from the Coupled Model Intercomparison Project CMIP5. Units are µmol kg-1 yr-1.
Figure 2. Zonally averaged linear trend of thermocline (z=300m) oxygen change over the 1960-2010 period as derived from observations (black) [4], the CMIP5 model mean (red dashed) and the reference UVic model (red solid) [22]. The blue dashed curve shows the zonally averaged trends resulting from the data mapping algorithm applied to the resampled model, with a resampling scheme that corresponds to the time and location of the oxygen observations.
Figure 3. Zonally averaged linear trend of thermocline oxygen (z=300m) as derived from observations (black) and the reference UVic model solution (red), together with (a) oxygen trends simulated by a UVic model run applying observed increasing westerly winds in the Southern Ocean (blue dashed) [22], and (b) results of simulations with CORE wind forcing over the period 1958-2010, and with either CORE wind climatology (cyan for UVic, grey for the somewhat higher resolution 0.5 degree NEMO model) or NCEP wind climatology (dashed blue) used in the model spin-up prior to year 1958.
Figure 4. (a) Annual mean oxygen difference at z=300m in year 1960 between the runs with NCEP/NCAR wind stress applied during spin up minus the run with CORE wind stress applied. (b) Difference in wind stress applied during the spin up: NCEP/NCAR
climatology (1957-1996 period) minus 10-year CORE climatology (1958-1967 period).
Length of the reference vector corresponds to 0.1 N m-2. (c) Annual mean oxygen difference between the two runs as in (a) at z=300m in year 2010 after interannual CORE wind stresses have been applied for the period 1958 to 2010. (d) Difference in the linear oxygen trend over the 50-year period 1960-2010 simulated by the run with NCEP/NCAR climatology spin up minus the run with CORE climatology spin up. Units are µmol kg-1 in (a) and (b), and µmol kg-1 yr-1 in (c).
Figure 5. Zonally averaged linear trend of thermocline oxygen (z=300m) as derived from observations (black) and the reference UVic model solution (red), together with (a) results of UVic model simulations applying an observational estimate of atmospheric nitrogen deposition (dashed blue) and CO2 dependent variable C:N stoichiometry (green) [54], and (b) results of idealised sensitivity simulations with increased (dashed blue) and decreased (dashed red) zooplankton mortality (see text).
Table 1. List of the models used.
Table 2. Mean trend and pattern correlations between observational estimate and simulated thermocline oxygen trends over the period 1960 to 2010.
http://mc.manuscriptcentral.com/issue-ptrsa 3
4 5 6 7 8 9 10 11 12 13 14 15 16 17 18 19 20 21 22 23 24 25 26 27 28 29 30 31 32 33 34 35 36 37 38 39 40 41 42 43 44 45 46 47 48 49 50 51 52 53 54 55 56 57 58 59 60
For Review Only
Table 3: Summary of causes, mechanisms and likely sign of tropical thermocline oxygen changes.
http://mc.manuscriptcentral.com/issue-ptrsa 3
4 5 6 7 8 9 10 11 12 13 14 15 16 17 18 19 20 21 22 23 24 25 26 27 28 29 30 31 32 33 34 35 36 37 38 39 40 41 42 43 44 45 46 47 48 49 50 51 52 53 54 55 56 57 58 59 60
For Review Only
http://mc.manuscriptcentral.com/issue-ptrsa 3
4 5 6 7 8 9 10 11 12 13 14 15 16 17 18 19 20 21 22 23 24 25 26 27 28 29 30 31 32 33 34 35 36 37 38 39 40 41 42 43 44 45 46 47 48 49 50 51 52 53 54 55 56 57 58 59
http://mc.manuscriptcentral.com/issue-ptrsa 2
3 4 5 6 7 8 9 10 11 12 13 14 15 16 17 18 19 20 21 22 23 24 25 26 27 28 29 30 31 32 33 34 35 36 37 38 39 40 41 42 43 44 45 46 47 48 49 50 51 52 53 54 55 56 57 58 59
For Review Only
(b) (a)
http://mc.manuscriptcentral.com/issue-ptrsa 3
4 5 6 7 8 9 10 11 12 13 14 15 16 17 18 19 20 21 22 23 24 25 26 27 28 29 30 31 32 33 34 35 36 37 38 39 40 41 42 43 44 45 46 47 48 49 50 51 52 53 54 55 56 57 58 59
For Review Only
(b) (a)
(c)
µ −1
∆ mol kg
O2
(d)
http://mc.manuscriptcentral.com/issue-ptrsa 3
4 5 6 7 8 9 10 11 12 13 14 15 16 17 18 19 20 21 22 23 24 25 26 27 28 29 30 31 32 33 34 35 36 37 38 39 40 41 42 43 44 45 46 47 48 49 50 51 52 53 54 55 56 57 58 59
For Review Only
(a)
(b)
http://mc.manuscriptcentral.com/issue-ptrsa 3
4 5 6 7 8 9 10 11 12 13 14 15 16 17 18 19 20 21 22 23 24 25 26 27 28 29 30 31 32 33 34 35 36 37 38 39 40 41 42 43 44 45 46 47 48 49 50 51 52 53 54 55 56 57 58 59