Metabolic preference of nitrate over oxygen as an electron acceptor in foraminifera from the Peruvian oxygen minimum zone
Nicolaas Glocka,1, Alexandra-Sophie Royb, Dennis Romeroc, Tanita Weinb, Julia Weissenbachb,2, Niels Peter Revsbechd, Signe Høgslunde, David Clemensa, Stefan Sommera, and Tal Daganb
aMarine Geosystems, GEOMAR Helmholtz Centre for Ocean Research Kiel, 24148 Kiel, Germany;bInstitute of Microbiology, Kiel University, 24118 Kiel, Germany;cDirección General de Investigaciones Oceanográficas y Cambio Climático, Instituto del Mar del Perú, Callao 01, Peru 17;dAarhus University Centre for Water Technology, Department of Bioscience, Aarhus University, DK-8000 Aarhus C, Denmark; andeSection of Marine Ecology, Department of Bioscience, Aarhus University, DK-8000 Aarhus C, Denmark
Edited by David M. Karl, University of Hawaii, Honolulu, HI, and approved January 4, 2019 (received for review August 11, 2018) Benthic foraminifera populate a diverse range of marine habitats.
Their ability to use alternative electron acceptors—nitrate (NO3−) or oxygen (O2)—makes them important mediators of benthic nitrogen cycling. Nevertheless, the metabolic scaling of the two alternative respiration pathways and the environmental determinants of fora- miniferal denitrification rates are yet unknown. We measured de- nitrification and O2 respiration rates for 10 benthic foraminifer species sampled in the Peruvian oxygen minimum zone (OMZ). De- nitrification and O2respiration rates significantly scale sublinearly with the cell volume. The scaling is lower for O2respiration than for denitrification, indicating that NO3−metabolism during denitrifica- tion is more efficient than O2metabolism during aerobic respiration in foraminifera from the Peruvian OMZ. The negative correlation of the O2respiration rate with the surface/volume ratio is steeper than for the denitrification rate. This is likely explained by the presence of an intracellular NO3−storage in denitrifying foraminifera. Fur- thermore, we observe an increasing mean cell volume of the Peru- vian foraminifera, under higher NO3−availability. This suggests that the cell size of denitrifying foraminifera is not limited by O2but rather by NO3−availability. Based on our findings, we develop a mathematical formulation of foraminiferal cell volume as a predic- tor of respiration and denitrification rates, which can further con- strain foraminiferal biogeochemical cycling in biogeochemical models. Our findings show that NO3−is the preferred electron ac- ceptor in foraminifera from the OMZ, where the foraminiferal con- tribution to denitrification is governed by the ratio between NO3−
and O2.
eukaryotic denitrification
|
foraminifera|
oxygen minimum zone|
nitrogen cycle
B
ioavailable nitrogen (N) is an essential building block of amino and nucleic acids in all living organisms (1). Nitrate (NO3−) is the most abundant form of reactive inorganic N within the oceans and a limiting nutrient for primary productivity within the surface ocean (2–4). The two main sinks for bioavailable N within the oceans are heterotrophic denitrification (i.e., the re- duction of NO3−to N2during organic matter degradation) and anaerobic ammonium (NH4+) oxidation (anammox) (5–7).About 20–40% of the oceanic N loss takes place in oxygen minimum zones (OMZs), making them key regions for global oceanic nutrient cycling (2, 4, 8).
Benthic foraminifera are able to use NO3−as an electron acceptor for denitrification, which is a rare ability among eukaryotes (9–11).
The only other eukaryotes known to date to perform incomplete denitrification of NO3−are two fungi (12) and the protistLoxodes (13). Additional eukaryotes that are able to use NO3−as an electron acceptor are two diatom species, which perform dissimilatory NO3− reduction to NH4+(DNRA) (14, 15). Notably, benthic foraminifera are the only eukaryotes known to perform complete denitrification to N2gas (9, 15). While denitrification seems to be performed by
endobionts in some groomiid and allogromiid species (16, 17), some rotaliids surely have an eukaryotic denitrification pathway (18, 19).
A recent study of the enzymes involved in the foraminiferal de- nitrification pathway in rotaliids showed that they are of an ancient prokaryotic origin (19). The uptake of NO3−and O2in foraminifera is likely facilitated by the pores present in the foraminiferal tests, whereas the pore density can be used as a quantitative NO3−proxy [e.g., inBolivina spissa(20–22)]. Recent studies estimated that fo- raminifera account for a major part of benthic denitrification in OMZs due to their high abundance in those habitats and their contribution to biological NO3− transport (11, 23, 24). In the Peruvian OMZ, foraminifera and sulfur bacteria that perform DNRA compete for the available NO3−(23–25). The latter process produces NH4+ that feeds the environment with reactive N. The NH4+can subsequently be removed by anammox either by benthic endosymbiotic bacteria or in the water column (26, 27). Anammox appears to be the main pelagic sink for dissolved reactive N in the Peruvian OMZ (28). These complex interactions pinpoint the im- portance of benthic foraminiferal denitrification for the global N cycling. Nevertheless, species-specific foraminiferal denitrification rates are very scarce in the literature and the measured rates vary by one to two orders of magnitude (9–11, 29, 30). Equally less is known about foraminiferal O2respiration rates (11, 31–38). Thus,
Significance
Foraminifera are able to respire nitrate instead of oxygen, a rare ability amongst eukaryotes. Here, we show that benthic forami- nifera from the Peruvian oxygen minimum zone are not just facultative anaerobes by switching to nitrate respiration when oxygen is depleted but that denitrification is their preferred res- piration pathway. Their metabolic adaptations allow some spe- cies to grow larger than predicted by cell physiology of aerobic organisms due to oxygen limitation. Finally, we formulate, from our observations, mathematical equations to predict the amount of foraminiferal denitrification using their cell volume. Nitrate is an important macronutrient, and denitrification is the main oce- anic nitrate sink. Our equations will help to constrain bio- geochemical models for marine nitrate cycling.
Author contributions: N.G., A.-S.R., N.P.R., S.H., and T.D. designed research; N.G., A.-S.R., D.R., T.W., J.W., D.C., S.S., and T.D. performed research; N.P.R. contributed new reagents/
analytic tools; N.G., D.C., and S.S. analyzed data; and N.G. wrote the paper.
The authors declare no conflict of interest.
This article is a PNAS Direct Submission.
Published under thePNAS license.
1To whom correspondence should be addressed. Email: nglock@geomar.de.
2Present address: Faculty of Biology, Technion–Israel Institute of Technology, 320000 Haifa, Israel.
This article contains supporting information online atwww.pnas.org/lookup/suppl/doi:10.
1073/pnas.1813887116/-/DCSupplemental.
Published online February 6, 2019.
additional rate measurements are crucial to calculate sound esti- mates for the total benthic foraminiferal denitrification rates and to constrain the role of foraminifera in benthic O2respiration and carbon degradation.
Various characteristics of organisms, from energy consumption to population growth rate, are known to correlate with body size (39).
The scaling of these characteristics with body size is well described by a power function with a scaling exponentα(39). The function is considered superlinear ifα>1, linear ifα=1 and sublinear ifα<1.
According to“Kleiber’s law,” the scaling of metabolic rates with body size in mammals and birds is sublinear (α = 0.75) (40).
Nonetheless, recent studies showed that the scaling of metabolic rates with body size varies among different taxa. Metabolic scaling is superlinear in prokaryotes, linear in protists, and sublinear in metazoans (39). At extremely large cell sizes,αdecreases for pro- karyotes and protists, leading to an overlap between large pro- karyotes and small protists as well as between large protists and small metazoans. The larger classes of organisms are more efficient and competitive at larger body sizes, because more complex re- spiratory systems help to sustain higher demands for electron ac- ceptors (39). Notably, the concept of metabolic scaling is useful to compare the efficiency between different metabolic pathways. Thus, when the rate of different metabolic pathways within a taxon—e.g., O2respiration and denitrification—scale with different exponents (α), the pathway with the largerαis considered to be more efficient.
Here, we determined rates of denitrification and O2respira- tion in benthic foraminifera from the Peruvian OMZ. We ana- lyzed the relationship between these metabolic rates and the individual cell volume and the surface to volume ratio of the foraminifera. Finally, we tested for a metabolic preference be- tween denitrification and O2 respiration in foraminifera from OMZs by comparing the metabolic scaling of the two processes.
Results
Foraminiferal Denitrification Rates. Denitrification rates were measured for nine benthic foraminiferal species from the Peru- vian OMZ (n=34;SI Appendix, Tables S1 and S2). Active de- nitrification was determined in all 34 incubations, whereas all negative controls and blanks showed no N2O production, i.e., no denitrification (SI Appendix, Fig. S1). Here, we term the meta- bolic rate of a single foraminifer“individual rate,”while the term
“specific rate”refers to the rate normalized by the cell volume.
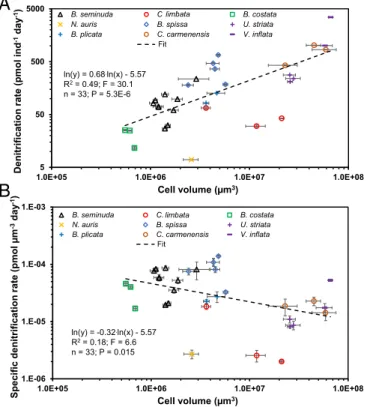
Our results show that the individual denitrification rates were significantly positively correlated with cell volume (Fig. 1A;R2= 0.49;F =30; P< 0.0001; power regression). Additionally, the specific denitrification rates and the cell volume were weakly correlated (Fig. 1B;R2=0.18;F=6.6;P=0.015). The corre- lation between cell volume and individual denitrification rates can be described according to Eq.1:
ln RdenðindÞ
=0.68·lnðVbioÞ–5:57 or
RdenðindÞ=3:80E−3·Vbio0:68, [1]
whereRden(ind)is the individual denitrification rate in pmol indi- vidual (ind)−1d−1, andVbiois the cell volume inμm3. We note that throughout the presented statistical analyses, all underlying assumptions of the power regression are fulfilled unless men- tioned otherwise (SI Appendix, Table S3). We further found a significant correlation between individual denitrification rates and the water depth where the foraminifera individuals were sampled; this observation may be explained by the higher abun- dance of larger foraminifera in deeper water depth (SI Appendix, Fig. S2A;R2=0.53;F=37;P<0.0001; power regression).
Foraminiferal O2Respiration Rates. Oxygen respiration rates were determined for nine benthic foraminiferal species from the Peru- vian OMZ and two additional species from the hypoxic Alsbäck deep of the Gullmar Fjord, Sweden (n=24;SI Appendix, Table S4).
The mean respiration rates measured within this study are within the range of the O2respiration rates previously published for other
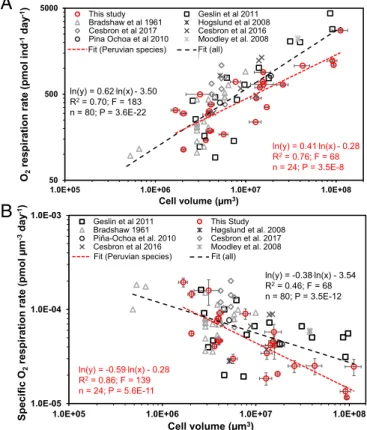
foraminiferal species (SI Appendix, Table S5). To test for a corre- lation between individual O2respiration rates and cell volume, we normalized all O2respiration rates from the literature according to the temperature present during the experiments (Fig. 2). Fitting a power regression to the whole dataset, including data from the lit- erature and our measurements, revealed that the individual O2 respiration rates were significantly positively correlated with the cell volume (Fig. 2A;R2=0.70;F=183;P<0.0001; power regression).
In contrast, the volume-specific O2 respiration rates were signifi- cantly negatively correlated with cell volume (Fig. 2B;R2=0.46;
F=68;P<0.0001; power regression). The correlation between cell volume and individual O2 respiration rates can be described according to Eq.2:
lnROxðindÞ
=0:62·lnðVbioÞ−3:50 or
ROxðindÞ=3:03E−2·Vbio0:62, [2]
whereROx(ind)is the individual O2respiration rate in pmol ind−1 d−1(andVbioas above). The correlation between cell volume and the volume-specific O2 respiration rates [ROx(vol)] is described according to Eq.3:
lnROxðvolÞ
=−0:38·lnðVbioÞ−3:54 or
ROxðvolÞ=2:90E−2·Vbio−0:38. [3]
To further characterize the relation of O2respiration rates and cell volume in species from strongly O2-depleted habitats, we divided the available O2respiration data into another subset. This dataset includes the data available for species from the Peruvian OMZ, including our data and data by Piña-Ochoa et al. (11). Our results show that the individual O2respiration rate in the Peruvian dataset is significantly positively correlated with cell volume, and yet the slope is much smaller in comparison with that within the dataset,
1.E-06 1.E-05 1.E-04 1.E-03
1.0E+05 1.0E+06 1.0E+07 1.0E+08
Specific denitrification rate (pmolµm-3day-1)
Cell volume (µm3)
B. seminuda C. auka B. costata
N. auris B. spissa U. striata
B. plicata C. carmenensis V. inflata
all Pot. (all)
5 50 500 5000
1.0E+05 1.0E+06 1.0E+07 1.0E+08
Denitrification rate (pmolind-1day-1)
Cell volume (µm3)
B. seminuda C. auka B. costata
N. auris B. spissa U. striata
B. plicata C. carmenensis V. inflata
all Pot. (all)Fit
A
ln(y) = 0.68.ln(x) - 5.57 R2= 0.49; F = 30.1 n = 33; P = 5.3E-6
B
ln(y) = -0.32.ln(x) - 5.57 R2= 0.18; F = 6.6 n = 33; P = 0.015
Fit limbata
limbata
Fig. 1. Log–log plots and power regressions for individual foraminiferal denitrification rates (A) and volume-specific foraminiferal denitrification rates (B) against cell volume for benthic foraminifera from the Peruvian OMZ. Error bars are SEM (1SEM).“Individual rate”refers to the rate per single foramin- ifer. The cell volume is the mean individual cell volume in each incubation.
EARTH,ATMOSPHERIC, ANDPLANETARYSCIENCESPHYSIOLOGY
which includes all of the species, even the ones from well- oxygenated environments (Fig. 2A). A comparison of the volume- specific O2respiration rates in both datasets showed that the neg- ative slope with cell volume is steeper for the Peruvian species (Fig.
2B). Additionally, the individual O2 respiration rates and water depth were significantly positively correlated for the Peruvian spe- cies (SI Appendix, Fig. S2B;R2=0.25;F=6.8;P=0.017; power regression). This correlation may be linked to the higher abundance of larger foraminifera in deeper water depths.
The Ratio of Denitrification and O2Respiration.Combining the rates of denitrification and O2respiration measured for the Peruvian species showed that the ratio of species-specific denitrification and O2respiration rates increased with the water depth that is typical for the sampled species (Fig. 3).“Species-specific”refers to the mean value of an individual from a specific species. The species-specific denitrification/O2 respiration ratio revealed a similar relation with water depth as the [NO3−]/[O2] ratios dur- ing the sampling period (Fig. 3).
Cell Volumes and Surface/Volume Ratios.The cell volume dependency to electron acceptor availability was evaluated by testing for a correlation between individual cell volume, water depth, and electron-acceptor concentration. This revealed that the individual cell volume of the foraminifera analyzed here is significantly
positively correlated with the water depth at the sampling location (SI Appendix, Fig. S3A;R2=0.47;F=361;P<0.0001; logarithmic regression). The presence ofBolivina seminudain samples from a wide range of water depths enabled us to further test for the above correlation within a single species. This revealed that the meanB.
seminuda cell volume was significantly positively correlated with water depth at the sampling location (SI Appendix, Fig. S3B;R2= 0.77;F=55;P<0.0001; logarithmic regression). The observation adds further support to the observed positive correlation between foraminiferal cell size and water depth. Notably, the distribution of individual cell volumes for all analyzed species is comparable to the distribution of dissolved [NO3−] at 12°S off Peru (SI Appendix, Fig. S4A). Furthermore, the correlation between the mean indi- vidual foraminiferal cell volume and the mean [NO3−] measured in the same water depth was significantly positively correlated (R2
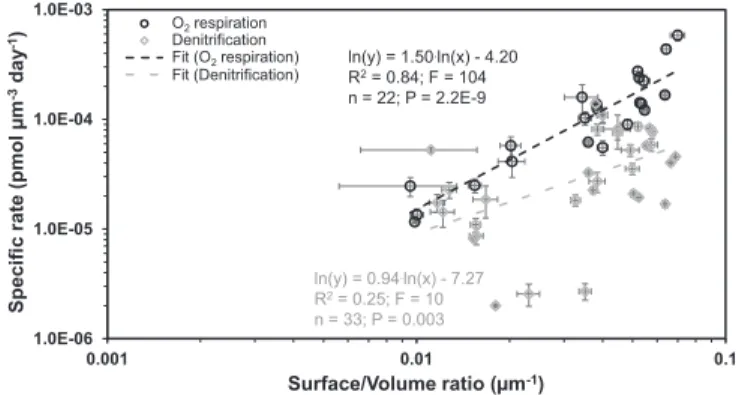
=0.84;F=32;P=0.001;SI Appendix, Fig. S4B; logarithmic re- gression). Similarly, the volume-specific O2 respiration rate was significantly positively correlated with the surface/volume ratio of the individual foraminiferal tests (Fig. 4;R2=0.84;F=104;P<
0.0001; power regression). Additionally, we observed a weak but significant positive correlation between the volume-specific de- nitrification rates and the surface/volume ratio of the test (Fig. 4;
R2=0.25;F=10;P=0.003; power regression).
Discussion
Metabolic Preference for Denitrification over O2Respiration. Our results reveal a positive correlation of the individual rates of de- nitrification and O2respiration to the cell volume as described by the power law equations Eqs.1and2(Figs. 1A and 2A). These equations are a valuable tool to further constrain foraminiferal denitrification and O2respiration rates in biogeochemical models for marine NO3−and C cycling. Data for species-specific rates of benthic foraminifera are limited in the literature. Additionally, the scaling of such functions can be used to determine if foraminifera have a metabolic preference for denitrification or O2respiration.
The exponent in the power law relationship between foraminiferal O2respiration and cell volume (Eq.2) is sublinear (α<1). Such sublinear metabolic scaling can be found for a wide range of or- ganisms (40, 41). A recent study argued that the sublinear scaling (α<1) does not extend to protists (α,∼1) (39). However, fora- minifera are relatively large protists, where the bigger species overlap in size with many metazoans. The metabolic rates ob- served in large protists and small metazoans are similar as well.
Consequently, it has been hypothesized that the decrease in metabolic scaling in large protists is related to the increased de- mand of electron acceptors to the respiratory complexes. In large
1.0E-05 1.0E-04 1.0E-03
1.0E+05 1.0E+06 1.0E+07 1.0E+08
Specific O2respiration rate (pmolµm-3day-1)
Cell volume (µm3) Geslin et al 2011 This Study Bradshaw 1961 Høgslund et al. 2008 Piña-Ochoa et al. 2010 Cesbron et al. 2017 Cesbron et al 2016 Moodley et al. 2008
All Peruvian species
Rest Pot. (All)
50 500 5000
1.0E+05 1.0E+06 1.0E+07 1.0E+08
O2respiration rate (pmolind-1day-1)
Cell volume (µm3)
This study Geslin et al 2011
Bradshaw et al 1961 Hogslund et al 2008 Cesbron et al 2017 Cesbron et al 2016 Pina Ochoa et al 2010 Moodley et al. 2008
All Peruvian species
Rest Pot. (All)
Pot. (Peruvian species)
A
ln(y) = 0.62.ln(x) - 3.50 R2= 0.70; F = 183 n = 80; P = 3.6E-22
Fit (all)
B
ln(y) = -0.59.ln(x) - 0.28 R2= 0.86; F = 139 n = 24; P = 5.6E-11
Fit (all)
ln(y) = 0.41.ln(x) - 0.28 R2= 0.76; F = 68 n = 24; P = 3.5E-8 Fit (Peruvian species)
Fit (Peruvian species)
ln(y) = -0.38.ln(x) - 3.54 R2= 0.46; F = 68 n = 80; P = 3.5E-12
Fig. 2. Log–log plots for individual foraminiferal O2respiration rates (A) and volume-specific foraminiferal O2respiration rates (B) against cell volume for benthic foraminifera from the Peruvian OMZ and compared with the litera- ture. The regressions are shown globally for all available data points (all) and for the Peruvian OMZ only. Error bars are 1 SEM. The data for each replicate are shown when available, but some data points consist only of averages for each species (10, 11, 36). The rates of ref. 33 were not included due to their exceptionally high values.“Individual rate”refers to the rate per single fora- minifer. The cell volume is the mean individual cell volume in each incubation.
The legends denoting the symbols inAandBcite the following references:
Bradshaw et al. (31), Cesbron et al. (38), Piña-Ochoa et al. (29), Geslin et al. (36), Høgslund et al. (10), Cesbron et al. (37), and Moodley et al. (35).
0 10 20 30 40 50 60
0 200 400 600 800 1000
[O2µ( ]molON[ ro )gk/3- )Mµ( ]
Water depth (m)
[NO3]
[O2]
[NO3-] [O2]
0 5 10 15 20 25 30 35
0.001 0.01 0.1 1 10
50 150 250 350 450
B. plicata V. inflata
B. costata C. auka
B. seminuda B. spissa C. carmenensis N. auris Ratio [NO3-]/[O2]
[NO3-]/[O2]
Ratio (denitrification/O2respiration) [NO3-]/[O2]
Water depth (m)
A B
Fig. 3. (A) Distribution of near bottom water [O2] and [NO3−] at 12°S within the Peruvian OMZ during cruise M137. (B) Ratios of [NO3−]/[O2] fromAand ratios of mean species-specific denitrification/O2respiration rates for benthic foraminifera from the Peruvian OMZ in relationship to the living depth of the different species.“Species-specific”refers to the mean value of an in- dividual from a species. The color fields represent the relative abundances of living specimens from these species within the different water depths.
Abundances are taken from refs. 23 and 53.
protists, the cell volume and number of mitochondria are increased;
however, their cell surface area is a limiting factor for the uptake of resources from the environment (39). The Peruvian OMZ is one of the most O2-depleted regions in the world’s oceans (42). Indeed, the O2respiration rates of foraminifera from the Peruvian OMZ scale with the cell volume with a much lower exponent (α=0.41; Fig. 2A) in comparison with the dataset from an earlier study, which mostly contains species from more oxygenated environments (from ref. 36 excluding our data from Peru:α=0.80). Consequently, we conclude that the Peruvian species metabolize O2less efficiently compared with species from other regions. We further show that the exponent for individual denitrification (α=0.68, Fig. 1A) is higher than the exponent calculated for O2respiration in the Peruvian species (α= 0.41; Fig. 2A). This indicates that denitrification is more efficient than O2respiration in species from the Peruvian OMZ.
The foraminiferal volume-specific O2respiration rate significantly decreases with cell volume (Fig. 2B). This finding is in agreement with earlier reports in the literature (33). We suggest that this neg- ative correlation is related to the decrease of the surface/volume ratio with increasing cell volume, which is a limiting factor for O2
uptake. Indeed, the volume-specific O2respiration rates were posi- tively correlated with the individual surface/volume ratio (Fig. 4).
Notably, the volume-specific O2 respiration rate of the Peruvian species decreased with cell volume with a steeper slope compared with the general trend found for foraminifera, including species from oxygenated habitats (Fig. 2B). This indicates that the Peruvian spe- cies are unable to sustain an increased O2supply with an increase in cell size. However, we note that the O2respiration rates we mea- sured here are potential rates because most of the presented Peru- vian species reside within a permanently anoxic habitat. Our results further revealed that the volume-specific O2respiration rates of the Peruvian species scales more strongly with their cell volume and their surface/volume ratio in comparison with their volume-specific denitrification rate (Figs. 1B, 2B, and 4). This might be explained by the supply pathway of the two electron acceptors to the respiratory complex. Since O2cannot be stored in the cell, its supply depends on the environmental [O2]. In contrast, NO3−is readily available for denitrification through the intracellular NO3− storage. Conse- quently, the rate of denitrification is not expected to decrease in bigger cells due to a decrease in surface to volume ratio. We further hypothesize that the foraminifers even overcome the limitation of electron acceptor supply imposed by the outer cell surface area, by performing denitrification. The enigmatic observation that the cell volume of some foraminiferal species from the Santa Barbara Basin is negatively correlated with [O2] (43) can be explained by this availability of an alternative electron acceptor storage. Indeed, sev- eral foraminifera in that habitat have been shown to denitrify (18).
Foraminiferal Ecology and the Availability of Electron Acceptors.Our results indicate that the preference of denitrification over O2 respiration strongly relies on the microhabitat of the foraminiferal
species. The microhabitat is, among other parameters, characterized by different ratios of the electron acceptors NO3−and O2 in the environment. Based on our findings, we propose a conceptual biogeochemical model describing foraminiferal denitrification in OMZs according to the environmental [NO3−]/[O2] ratio (Fig.
5; details inSI Appendix, Note 1). Foraminifera residing in the upper boundary of the Peruvian OMZ (Fig. 5A) showed a rel- atively low ratio of denitrification/O2respiration (Fig. 3B). The upper OMZ boundary is a highly fluctuating environment where the oxycline can vary between 0–125 m and strong O2intrusions from above are common at these water depths (44, 45). The bottom water [NO3−] is relatively low (SI Appendix, Figs. S4 and S5) and can, during sulfidic events, be completely consumed (25) (SI Appendix, Fig. S6). Furthermore, mats of sulfur bacteria ca- pable of performing DNRA are often clustered around the up- per OMZ boundary (25, 46); hence, the competition for NO3− uptake in this region may be intense. The most common fora- miniferal species living in these depths is the smallB. costata(cell volume between 2×10⁵and 10×105μm3;n=67). This species is characteristic for sulfidic sediments containing high amounts of labile organic matter, but it can also thrive in well-oxygenated sediments (45). From previous observations ofB. costata(45), we can assert that species at the upper OMZ boundary are well adapted to fluctuations of the oxycline, periodic sulfidic conditions, and limited NO3−availability. In summary, foraminifera thriving in this environment are small, have a low ratio of denitrification/O2 respiration, and, thus, generally have a low denitrification capacity, even if they occur in high abundances (Fig. 5A).
In contrast, foraminifera thriving at the lower OMZ boundary (Fig. 5C) have a relatively high denitrification/O2respiration ratio, indicating that they metabolize NO3−more efficiently than O2. In- deed, the [O2] below the OMZ are variable, but only weakly, below 500 m water depth (47). The bottom water in these depths is con- sidered to be anoxic most of the time (see also Fig. 3A andSI Appendix, Figs. S5Aand S6B). Additionally, the [NO3−] is relatively high at these depths due to the increase of [NO3−] with water depth (SI Appendix, Fig. S5C). Competition for NO3−is restricted to the present foraminifers and to denitrifying bacteria. Some of the fo- raminiferal species present at these depths, e.g.,Cancris carmenensis orValvulineria inflata, can reach relatively large cell volumes (be- tween 100 ×105and 1,000×105μm3, n=24). Notably, the in- tracellular NO3−uptake rate of foraminifera can be 10-fold higher than the denitrification rate (10). This observation further supports our notion according to which there is no limitation of electron acceptor uptake through the surface/volume ratio due to the avail- ability of an intracellular NO3−storage. In summary, foraminifera can grow larger with increasing NO3−availability (thus water depth) and have an increasing denitrification capacity (Fig. 5BandC).
The species-specific ratio of denitrification/O2respiration for the most abundant species at the Peruvian OMZ is directly coupled to the availability of NO3−and O2within their habitat (Fig. 3B). Our results indicate that the availability of different electron acceptors influences the community structure, and thus the ecology of benthic foraminifera. Even within individual species, the cell volume can be a plastic phenotypic trait that can depend on the electron acceptor concentration in the environment, as shown for B. seminuda(SI Appendix, Fig. S3). Benthic foraminifera are known to widely dis- perse as small juveniles or propagules and to form propagule banks in sediments (48). These banks contain abundant and diverse fo- raminiferal propagules that grow to maturity when exposed to the appropriate environmental conditions (48, 49). We hypothesize that the availability of different electron acceptors constitutes an addi- tional selecting factor for the composition of species that develop from a propagule bank, in addition to other factors such as water depth, salinity, pH, and organic matter (Corg) supply. Indeed, the influence of O2 and Corg on the distribution of foraminifera in benthic microhabitats has been described by the conceptual trophic oxygen model (50). A later study pointed out that the influence of alternative electron acceptors (NO3−in particular) (51) should be considered as well. Thus, species having high species-specific de- nitrification rates, likeC. carmenensisandV. inflata, could develop
1.0E-06 1.0E-05 1.0E-04 1.0E-03
0.001 0.01 0.1
cificepS etar(lompµm-3day-1)
Surface/Volume ratio (µm-1)
O2 respiraon Denitrificaon Pot. (O2 respiraon) Pot. (Denitrificaon)
Fit (O2respiration) Fit (Denitrification) O2respiration Denitrification
ln(y) = 1.50.ln(x) - 4.20 R2= 0.84; F = 104 n = 22; P = 2.2E-9
ln(y) = 0.94.ln(x) - 7.27 R2= 0.25; F = 10 n = 33; P = 0.003
Fig. 4. Log–log plots and power regressions for volume-specific foraminif- eral denitrification and O2respiration rates against surface/volume ratios for benthic foraminifera from the Peruvian OMZ. Error bars are 1 SEM.
EARTH,ATMOSPHERIC, ANDPLANETARYSCIENCESPHYSIOLOGY
when [NO3−] is high and competition for NO3− uptake is low.
Other species can grow to larger cell size due to increased [NO3−] (SI Appendix, Fig. S3B). Such a community composition might lead to increased denitrification in the habitat. Furthermore, in habitats where NO3−is scarce and competition for NO3−uptake high (e.g., due to the presence of sulfur bacteria), species with a low species-specific denitrification rates (i.e., smaller species) would be favored. Consequently, the total foraminiferal de- nitrification is expected to decrease as NO3−availability will be- come a limiting factor for the total benthic denitrification. Our data, in combination with data of an earlier study (23) suggest that the ratio of foraminiferal denitrification over bacterial de- nitrification is around 20–50% within the Peruvian OMZ core but only 5% below the lower OMZ boundary (SI Appendix,Note 2and Table S8).
Conclusions
Benthic foraminifera are able to perform complete de- nitrification (9, 11). Nevertheless, benthic foraminifera from O2- depleted environments have always been considered only as facultative anaerobes. Here, we compared the scaling of de- nitrification and O2 respiration rates of benthic foraminifera from the Peruvian OMZ to their cell volume. Our findings reveal that benthic foraminifera from the Peruvian OMZ are not only able to survive under anoxia, rather, they find favorable condi- tions in such environments. In contrast to foraminifera from more oxygenated environments, the Peruvian species studied here show a metabolic preference for denitrification over O2
respiration. Consequently, these species are better described as facultative aerobes rather than facultative anaerobes.
Methods
Sampling of Living Foraminifera.Sixteen short-sediment cores from the Peru- vian OMZ were retrieved during Research Vessel (R/V) Meteor cruise M137
(May 2017) using a video-guided multiple corer (inner tube diameter, 10 cm).
A map with the sampling locations is shown in theSI Appendix, Fig. S6 and Table S6. After retrieval, the supernatant water of each core was removed and the top 3 cm of sediment sliced in 1-cm intervals. The sediment core slices were immediately sieved through a 63-μm mesh using fresh surface seawater, and the 63- to 2,000-μm fraction was collected in polypropylene beakers. Living foraminiferal specimens within this residue were identified according pseu- dopodial activity as well as cytoplasm abundance and color based on a live/
dead CellTracker Green fluorescent dye (ThermoFisher) assessment of each species. Viable foraminiferal specimens were cleaned with a brush and washed twice in NO3−-free artificial seawater (Red Sea Salt), directly before rate measurements incubations. Typically, it took 60–90 min after core retrieval before specimens were incubated for rate measurements.
Determination of Foraminiferal Denitrification and O2Respiration Rates.Fo- raminiferal denitrification and O2respiration rates were calculated from linear steady-state gradients of nitrous oxide (N2O) or O2in glass micro- capsules (9–11, 29). For each experiment, 4–13 specimens were incubated.
The number of specimens depended on the size of the randomly selected living individuals. In total, 34 incubations for the determination of de- nitrification rates and 24 incubations for the determination of O2respiration rates were made, excluding the negative control and blanks. Negative controls were done by measuring rates from chambers with empty forami- niferal tests and blanks with empty chambers. Both negative control and blank showed no N2O production after acetylene inhibition (52) (SI Ap- pendix, Fig. S1). For more details about the determination of the de- nitrification and O2respiration rates, seeSI Appendix,Note 3.
Cell Volume Determination.We estimated the total foraminiferal volume for each specimen according to ref. 36. The test volume was estimated by using the best resembling geometric shape (SI Appendix, Table S7) and the cell volume by the assumption that the internal test volume corresponds to 75%
of the whole test volume and is completely filled with cytoplasm (33). For more details about the cell volume determination, seeSI Appendix,Note 4.
Corgconsumption (remineralization)
[NO3-]/[O2] ratio and foraminiferal denitrification [NO3-]BW (µM)
[O2]BW (µM) Foraminiferal cell volume 0 5 10 15 20 250 10 20 30 40
Upper OMZ boundary (a)UpperOMZ boundary(a)
[O2] decreases
Anoxia
Growth limited by O2uptake (surface/
volume ratio)
Growth is now
limited by [NO3-] Foraminiferal denitrification increases proportional to foraminiferal biovolume
Excess O2and NO3-→ no growth limitation
Sharp decrease in foraminiferal denitrification (abundances decrease due to lower Corg supply) Corgsupply
decreases and [NO3-] slowly reaches plateau
Food supply (Corg) and abundances decrease [O2] increases
0
100
200
300
400
500
600
700
Water depth (m)
Core OMZ (b)Lower OMZ boundary (c)
[NO3-] increases and foraminifera grow larger
Fig. 5. Conceptual model for benthic foraminiferal denitrification at the Peruvian OMZ. A detailed de- scription of the model is presented inSI Appendix, Note 1. (A) Upper OMZ boundary within the lower productive mixed layer: high Corg fluxes and O2
consumption, low [NO3−], high foraminiferal abun- dances, small foraminifera→Low [NO3−]/[O2] ratios and low total benthic foraminiferal denitrification.
(B) Anoxic OMZ core: Corgfluxes decrease with water depth due to remineralization, while [NO3−] in- creases, which results in larger foraminifera. De- pletion of O2 facilitates Corg preservation in the sediments, causing increased foraminiferal abun- dances. All this causes high [NO3−]/[O2] ratios and high total benthic foraminiferal denitrification, both increasing with water depth. (C) Lower OMZ boundary: Corgfluxes are decreasing because most Corg is already remineralized in the water column above. While [O2] gradually increases with water depth, [NO3−] reaches a plateau. Foraminiferal abundances decrease due to decreased Corg within the sediments. This results in a sharp decrease of [NO3−]/[O2] ratios and total benthic foraminiferal denitrification with water depth. [NO3−] and [O2] have been schematized after the data shown in the SI Appendix, Fig. S4.
Respiration Rates from Literature.All O2respiration rates from the literature were converted into pmol ind−1d−1and normalized to 13 °C according to the method described in ref. 36 to produce a sufficient database for data com- parison. A more detailed description on how the literature data were treated is presented inSI Appendix,Note 5.
Environmental Data.[NO3−] and [O2] in the benthic boundary layer were determined during 49 conductivity, temperature, and depth casts during cruise M137 within the same transect as the sediment samples were taken for the foraminiferal analyses. For more details, seeSI Appendix,Note 6.
Statistics.Linear regressions were used to analyze our data after logarithmic and double logarithmic transformations. For statistical details, seeSI Ap- pendix,Note 7and Table S3.
ACKNOWLEDGMENTS.The scientific party and crew on R/V Meteor cruise M137 and Bettina Domeyer, Gabriele Schüssler, and Asmus Petersen are gratefully acknowledged for their support at sea. We thank Andrew Dale for additional support at sea and thorough language editing of the man- uscript. N.G. thanks Anton Eisenhauer and Volker Liebetrau for fruitful scientific discussions. Joachim Schönfeld is acknowledged for interesting discussions about the taxonomy of the Peruvian species. We thank Julia Wukovits for sampling support with the Swedish foraminifera. Lars Borre- gaard Pedersen and Preben Sørensen are thanked for construction of microsensors and general help in the laboratory. Main funding was pro- vided by the Deutsche Forschungsgemeinschaft through the Sonderfor- schungsbereich 754 “Climate–Biogeochemistry Interactions in the Tropical Ocean.”A.-S.R. thanks the Royal Swedish Academy of Sciences from the University of Gothenburg for financial support to analyze the Swedish samples. N.P.R. was supported by the Poul Due Jensen Foundation.
1. Gruber N, Galloway JN (2008) An Earth-system perspective of the global nitrogen cycle.Nature451:293–296.
2. Gruber N (2004) The dynamics of the marine nitrogen cycle and its influence on at- mospheric CO2 variations.The Ocean Carbon Cycle and Climate(Springer, Dordrecht, The Netherlands), pp 97–148.
3. Arrigo KR (2005) Marine microorganisms and global nutrient cycles.Nature437:349–355.
4. Lam P, et al. (2009) Revising the nitrogen cycle in the Peruvian oxygen minimum zone.
Proc Natl Acad Sci USA106:4752–4757.
5. van de Graaf AA, et al. (1995) Anaerobic oxidation of ammonium is a biologically mediated process.Appl Environ Microbiol61:1246–1251.
6. Thamdrup B, Dalsgaard T (2002) Production of N(2) through anaerobic ammonium oxidation coupled to nitrate reduction in marine sediments.Appl Environ Microbiol68:1312–1318.
7. Kuypers MMM, et al. (2003) Anaerobic ammonium oxidation by anammox bacteria in the Black Sea.Nature422:608–611.
8. Bohlen L, Dale AW, Wallmann K (2012) Simple transfer functions for calculating benthic fixed nitrogen losses and C:N:P regeneration ratios in global biogeochemical models.Global Biogeochem Cycles26:GB3029.
9. Risgaard-Petersen N, et al. (2006) Evidence for complete denitrification in a benthic foraminifer.Nature443:93–96.
10. Høgslund S, Revsbech NP, Cedhagen T, Nielsen LP, Gallardo VA (2008) Denitrification, nitrate turnover, and aerobic respiration by benthic foraminiferans in the oxygen minimum zone off Chile.J Exp Mar Biol Ecol359:85–91.
11. Piña-Ochoa E, et al. (2010) Widespread occurrence of nitrate storage and denitrification among Foraminifera and Gromiida.Proc Natl Acad Sci USA107:1148–1153.
12. Usuda K, Toritsuka N, Matsuo Y, Kim DH, Shoun H (1995) Denitrification by the fungus Cylindrocarpon tonkinense: Anaerobic cell growth and two isozyme forms of cytochrome P-450nor.Appl Environ Microbiol61:883–889.
13. Finlay BJ, Span ASW, Harman JMP (1983) Nitrate respiration in primitive eukaryotes.
Nature303:333–336.
14. Kamp A, de Beer D, Nitsch JL, Lavik G, Stief P (2011) Diatoms respire nitrate to survive dark and anoxic conditions.Proc Natl Acad Sci USA108:5649–5654.
15. Kamp A, Høgslund S, Risgaard-Petersen N, Stief P (2015) Nitrate storage and dissim- ilatory nitrate reduction by eukaryotic microbes.Front Microbiol6:1492.
16. Bernhard JM, Edgcomb VP, Casciotti KL, McIlvin MR, Beaudoin DJ (2012) Denitrification likely catalyzed by endobionts in an allogromiid foraminifer.ISME J6:951–960.
17. Høgslund S, Cedhagen T, Bowser SS, Risgaard-Petersen N (2017) Sinks and sources of intracellular nitrate in gromiids.Front Microbiol8:617.
18. Bernhard JM, et al. (2012) Potential importance of physiologically diverse benthic forami- nifera in sedimentary nitrate storage and respiration.J Geophys Res Biogeosci117:G03002.
19. Woehle C, et al. (2018) A novel eukaryotic denitrification pathway in foraminifera.
Curr Biol28:2536–2543.e5.
20. Glock N, et al. (2011) Environmental influences on the pore-density in tests of Bolivina spissa.J Foraminiferal Res41:22–32.
21. Glock N, Schönfeld J, Mallon J (2012) The functionality of pores in benthic forami- nifera in view of bottom water oxygenation: A review. Anoxia: Evidence for Eukaryote Survival and Paleontological Strategies, eds Altenbach AV, Bernhard JM, Seckbach J (Springer, Dordrecht, The Netherlands), (2012) 537–552.
22. Glock N, et al. (2018) Coupling of oceanic carbon and nitrogen facilitates spatially resolved quantitative reconstruction of nitrate inventories.Nat Commun9:1217.
23. Glock N, et al. (2013) The role of benthic foraminifera in the benthic nitrogen cycle of the Peruvian oxygen minimum zone.Biogeosciences10:4767–4783.
24. Dale AW, Sommer S, Lomnitz U, Bourbonnais A, Wallmann K (2016) Biological nitrate transport in sediments on the Peruvian margin mitigates benthic sulfide emissions and drives pelagic N loss during stagnation events.Deep Sea Res Part I112:123–136.
25. Sommer S, et al. (2016) Depletion of oxygen, nitrate and nitrite in the Peruvian ox- ygen minimum zone cause an imbalance of benthic nitrogen fluxes.Deep Sea Res Part I112:113–122.
26. Prokopenko MG, et al. (2013) Nitrogen losses in anoxic marine sediments driven by Thioploca-anammox bacterial consortia.Nature500:194–198.
27. Dale AW, Bourbonnais A, Altabet M, Wallmann K, Sommer S (2019) Isotopic finger- prints of benthic nitrogen cycling in the Peruvian oxygen minimum zone.Geochim Cosmochim Acta245:406–425.
28. Kalvelage T, et al. (2013) Nitrogen cycling driven by organic matter export in the South Pacific oxygen minimum zone.Nat Geosci6:228–234.
29. Piña-Ochoa E, Koho KA, Geslin E, Risgaard-Petersen N (2010) Survival and life strategy of the foraminiferan Globobulimina turgida through nitrate storage and de- nitrification.Mar Ecol Prog Ser417:39–49.
30. Bernhard JM, et al. (2012) Potential importance of physiologically diverse benthic forami- nifera in sedimentary nitrate storage and respiration.J Geophys Res Biogeosci117:G03002.
31. Bradshaw JS (1961) Laboratory experiments on the ecology of foraminifera.Contrib Cushman Found Foraminiferal Res12:87–106.
32. Lee JJ, Muller A (1973) Trophic dynamics and niches of salt marsh foraminifera.Am Zool13:215–223.
33. Hannah F, Rogerson A, Laybourn-parry J (1994) Respiration rates and biovolumes of common benthic foraminifera (Protozoa).J Mar Biol Assoc UK74:301–312.
34. Nomaki H, Yamaoka A, Shirayama Y, Kitazato H (2007) Deep-sea benthic foraminif- eral respiration rates measured under laboratory conditions.J Foraminiferal Res37:
281–286.
35. Moodley L, et al. (2008) Biomass-specific respiration rates of benthic meiofauna:
Demonstrating a novel oxygen micro-respiration system.J Exp Mar Biol Ecol357:
41–47.
36. Geslin E, et al. (2011) Oxygen respiration rates of benthic foraminifera as measured with oxygen microsensors.J Exp Mar Biol Ecol396:108–114.
37. Cesbron F, et al. (2016) Vertical distribution and respiration rates of benthic forami- nifera: Contribution to aerobic remineralization in intertidal mudflats covered by Zostera noltei meadows.Estuar Coast Shelf Sci179:23–38.
38. Cesbron F, et al. (2017) Sequestered chloroplasts in the benthic foraminifer Haynesina germanica: Cellular organization, oxygen fluxes and potential ecological implications.
J Foraminiferal Res47:268–278.
39. DeLong JP, Okie JG, Moses ME, Sibly RM, Brown JH (2010) Shifts in metabolic scaling, production, and efficiency across major evolutionary transitions of life.Proc Natl Acad Sci USA107:12941–12945.
40. Kleiber M (1932) Body size and metabolism.Hilgardia6:315–353.
41. Warwick RM, Price R (1979) Ecological and metabolic studies on free-living nematodes from an estuarine mud-flat.Estuarine Coastal Mar Sci9:257–271.
42. Stramma L, Johnson GC, Sprintall J, Mohrholz V (2008) Expanding oxygen-minimum zones in the tropical oceans.Science320:655–658.
43. Keating-Bitonti CR, Payne JL (2017) Ecophenotypic responses of benthic foraminifera to oxygen availability along an oxygen gradient in the California Borderland.Mar Ecol38:e12430.
44. Gutiérrez D, et al. (2008) Oxygenation episodes on the continental shelf of central Peru: Remote forcing and benthic ecosystem response.Prog Oceanogr79:177–189.
45. Cardich J, et al. (2015) Calcareous benthic foraminifera from the upper central Pe- ruvian margin: Control of the assemblage by pore water redox and sedimentary or- ganic matter.Mar Ecol Prog Ser535:63–87.
46. Mosch T, et al. (2012) Factors influencing the distribution of epibenthic megafauna across the Peruvian oxygen minimum zone.Deep Sea Res Part I68:123–135.
47. Sommer S, et al. (2010) Life at the edge–Oscillating lower boundary of the Peruvian oxygen minimum zone. Ocean Sciences Meeting 2010, February 22–26, 2010, Port- land, OR.EOS Transactions: Ocean Sciences Meeting Supplement; abstr BO24C-08.
48. Alve E, Goldstein ST (2003) Propagule transport as a key method of dispersal in benthic foraminifera (Protista).Limnol Oceanogr48:2163–2170.
49. Goldstein S, Alve E (2011) Experimental assembly of foraminiferal communities from coastal propagule banks.Mar Ecol Prog Ser437:1–11.
50. Jorissen FJ, de Stigter HC, Widmark JGV (1995) A conceptual model explaining benthic foraminiferal microhabitats.Mar Micropaleontol26:3–15.
51. Koho KA, Piña-Ochoa E (2012) Benthic foraminifera: Inhabitants of low-oxygen en- vironments.Anoxia: Evidence for Eukaryote Survival and Paleontological Strategies, eds Altenbach AV, Bernhard JM, Seckbach J (Springer, Dordrecht, The Netherlands), pp 249–285.
52. Smith MS, Firestone MK, Tiedje JM (1978) The acetylene inhibition method for short- term measurement of soil denitrification and its evaluation using nitrogen-131.Soil Sci Soc Am J42:611.
53. Mallon J (2012) Benthic foraminifera of the Peruvian & Ecuadorian continental margin. PhD thesis (Christian-Albrechts Universität zu Kiel, Kiel, Germany).
EARTH,ATMOSPHERIC, ANDPLANETARYSCIENCESPHYSIOLOGY