www.biogeosciences.net/13/1367/2016/
doi:10.5194/bg-13-1367-2016
© Author(s) 2016. CC Attribution 3.0 License.
Benthic phosphorus cycling in the Peruvian oxygen minimum zone
Ulrike Lomnitz1, Stefan Sommer1, Andrew W. Dale1, Carolin R. Löscher1, Anna Noffke2, Klaus Wallmann1, and Christian Hensen1
1GEOMAR Helmholtz Centre for Ocean Research Kiel, Wischhofstr. 1–3, 24148 Kiel, Germany
2Institut für Seenforschung (ISF) der LUBW, Argenweg 50/1, 88085 Langenargen, Germany
Correspondence to: Ulrike Lomnitz (ulomnitz@geomar.de)
Received: 15 September 2015 – Published in Biogeosciences Discuss.: 19 October 2015 Revised: 2 February 2016 – Accepted: 4 February 2016 – Published: 4 March 2016
Abstract. Oxygen minimum zones (OMZs) that impinge on continental margins favor the release of phosphorus (P) from the sediments to the water column, enhancing primary pro- ductivity and the maintenance or expansion of low-oxygen waters. A comprehensive field program in the Peruvian OMZ was undertaken to identify the sources of benthic P at six sta- tions, including the analysis of particles from the water col- umn, surface sediments, and pore fluids, as well as in situ benthic flux measurements. A major fraction of solid-phase P was bound as particulate inorganic P (PIP) both in the water column and in sediments. Sedimentary PIP increased with depth in the sediment at the expense of particulate or- ganic P (POP). The ratio of particulate organic carbon (POC) to POP exceeded the Redfield ratio both in the water col- umn (202±29) and in surface sediments (303±77). How- ever, the POC to total particulate P (TPP=POP+PIP) ra- tio was close to Redfield in the water column (103 ±9) and in sediment samples (102±15). This suggests that the relative burial efficiencies of POC and TPP are similar un- der low-oxygen conditions and that the sediments underly- ing the anoxic waters on the Peru margin are not depleted in P compared to Redfield. Benthic fluxes of dissolved P were extremely high (up to 1.04±0.31 mmol m−2d−1), however, showing that a lack of oxygen promotes the intensified re- lease of dissolved P from sediments, whilst preserving the POC/TPP burial ratio. Benthic dissolved P fluxes were al- ways higher than the TPP rain rate to the seabed, which is proposed to be caused by transient P release by bacterial mats that had stored P during previous periods when bot- tom waters were less reducing. At one station located at the lower rim of the OMZ, dissolved P was taken up by the sedi- ments, indicating ongoing phosphorite formation. This is fur- ther supported by decreasing porewater phosphate concentra-
tions with sediment depth, whereas solid-phase P concentra- tions were comparatively high.
1 Introduction
Phosphorus is an essential nutrient; it serves as an energy carrier for all living species and is a limiting macronutrient for marine primary production on geological timescales (In- gall and Jahnke, 1994; Föllmi, 1996; McManus et al., 1997;
Filippelli, 2002; Paytan and McLaughlin, 2007; Tsandev et al., 2012; Ruttenberg, 2014). Due to its impact on ma- rine primary production, the oceanic phosphorus inventory modulates the atmospheric CO2 level and Earth’s climate (Ganeshram et al., 2002; Wallmann, 2003; Ingall, 2010).
Hence, it is crucial to understand feedback mechanisms of the P cycle to make future predictions.
Particulate and dissolved phosphorus in the ocean origi- nates from terrestrial chemical weathering of the P contain- ing mineral group of apatite (Filippelli, 2002). Only around 30 % of the P discharged to the oceans is potentially bioavail- able (Compton et al., 2000) as dissolved P, inorganic P ad- sorbed to minerals, or associated with metal oxides and P bound within particulate organic matter. However, the largest fraction of the fluvial P is trapped in estuaries or buried in continental margin sediments and thereby removed from the P cycle before it reaches the open ocean (Compton et al., 2000). The delivery of P to the sediments in the open ocean is mainly composed of organic and inorganic P associated with the export of organic detritus and other particles from the photic zone. P adsorbed to minerals such as Mn and Fe (oxyhydr)oxides (Föllmi, 1996; Delaney, 1998; Faul et al., 2005) are further sources, as well as P input from fish debris
that could be particularly important in productive upwelling regions (Suess, 1981; Schenau and De Lange, 2001; Dìaz- Ochoa et al., 2009; Noffke, 2014).
P cycling is strongly affected by redox-dependent pro- cesses. P can be scavenged by Fe (oxyhydr)oxides in oxic sediment and released across the sediment–water interface due to the reduction dissolution of Fe (oxyhydr)oxides in anoxic sediments (Sundby et al., 1986; Slomp et al., 1998).
Furthermore, recent studies showed that sulfur bacteria found in surface sediments of anoxic environments can internally store and release P under oscillating redox conditions (Ingall and Jahnke, 1997, and references therein). Therefore, these organisms are a key player for the modulation of porewater P concentrations and benthic P release to the water column.
Additionally, hypoxic or anoxic conditions favor the pre- cipitation of P in the form of authigenic carbonate fluora- patite (CFA) (Froelich et al., 1988; Suess and von Huene, 1988; Goldhammer et al., 2010; Ingall, 2010; Schenau and De Lange, 2000). For non-upwelling areas, the required phosphate oversaturation in the porewaters has been at- tributed to the reductive dissolution of P bearing Fe (oxy- hydr)oxides (e.g., Ruttenberg and Berner, 1993, Slomp et al., 1996). In contrast, the CFA formation in sediments of the Namibian upwelling area was linked to microbial P release into the porewaters (Schulz and Schulz, 2005).
The resulting feedback on oceanic primary production and atmospheric O2and CO2levels triggered by changes in ben- thic P sequestration is still unclear. Presently, three oppos- ing views have been raised: (1) intensified phosphate re- lease from the sediments to the water column caused by an expansion of low-oxygen waters (Ingall and Jahnke, 1994;
Stramma et al., 2008) could stimulate the primary produc- tion in the surface waters (Wallmann, 2003). This, in turn, may lead to a more intensified oxygen demand and a positive feedback with benthic P release (Slomp and Van Cappellen, 2007; Wallmann, 2010; Moffitt et al., 2015). (2) A negative feedback on P release has been postulated based on observa- tions of CFA mineral precipitation found in the present-day oxygen-depleted upwelling areas (Schulz and Schulz, 2005;
Arning et al., 2009a, b; Goldhammer et al., 2010; Cosmidis et al., 2013). Being a major sink for bioavailable P (Delaney, 1998; Ingall, 2010), it has been argued that the expansion of OMZs may increase the CFA precipitation in the sediments and thus mitigate the benthic phosphate release (Ganeshram et al., 2002; Goldhammer et al., 2010; Ingall, 2010). (3) A third scenario suggests that the formation of CFA is in bal- ance with enhanced P release from anoxic sediments, imply- ing that the dissolved oceanic P inventory is largely unaf- fected by oxygen concentrations (Delaney, 1998; Anderson et al., 2001; Roth et al., 2014). These conflicting scenarios show that there is further need to explore the benthic–pelagic P cycling in oxygen-deficient environments in order to en- able improved predictions.
In this study, we explore P cycling in the Peruvian OMZ to identify and quantify P sources to the sediment and the
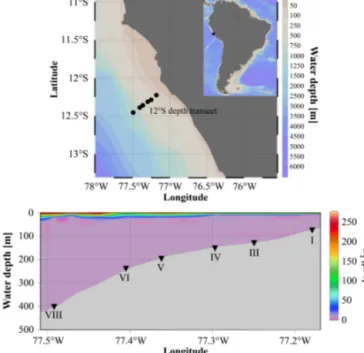
Figure 1. Study area, sampling stations, and O2 concentration in µM along the 12◦S transect.
return of inorganic dissolved P back to the water column.
Our data set comprises samples of particulate matter from the water column as well as porewater, sediment samples and samples of filamentous sulfur bacteria. We present in situ benthic phosphate fluxes, particulate matter C/P ratios for water-column particles and surface sediments and P burial fluxes, and relative abundances of sulfur bacteria for six sta- tions along the depth transect across the Peruvian shelf at 12◦S. From a mass balance for P cycling in the sediments, we conclude that the benthic P sources and sinks were, in general, imbalanced during our sampling campaign.
2 Study area
The study area is located in the center of the Peruvian OMZ at 12◦S covering the shallow shelf from∼70 m water depth to mid-slope depths of about∼400 m (Fig. 1). During our sampling campaign in January 2013, neutral or slightly neg- ative El Niño–Southern Oscillation (ENSO) conditions dom- inated (http://www.cpc.ncep.noaa.gov), and the bottom water oxygen concentrations were below the detection limit of the Winkler titration (5 µmol L−1)down to∼450 m water depth (Fig. 1, Table 1). Below the OMZ, oxygen concentrations increased to 19 and 53 µM at 770 and 1025 m water depth, respectively. Nitrate concentrations were below 12 µM from 128 to 407 m water depth (Table 1). During the measuring period, the bottom water at station I (74 m) was sulfidic and depleted in nitrate (Table 1; Sommer et al., 2016).
The oxygen-deficient waters off Peru belong to one of the world’s most prominent OMZs. Southeasterly trade winds
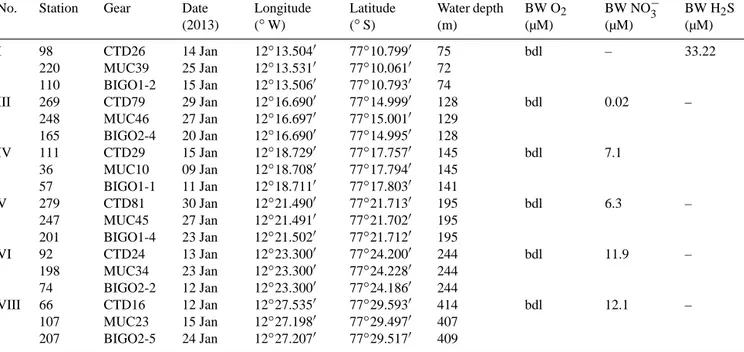
Table 1. Station list for the sites of the benthic lander (BIGO), multi-corer (MUC), and CTD deployments including the bottom water concentrations of oxygen (O2), nitrate (NO−3), and sulfide (H2S) in µM. The station numbers are according to Dale et al. (2015). bdl=below detection limit (5 µM).
No. Station Gear Date
(2013)
Longitude (◦W)
Latitude (◦S)
Water depth (m)
BW O2 (µM)
BW NO−3 (µM)
BW H2S (µM)
I 98
220 110
CTD26 MUC39 BIGO1-2
14 Jan 25 Jan 15 Jan
12◦13.5040 12◦13.5310 12◦13.5060
77◦10.7990 77◦10.0610 77◦10.7930
75 72 74
bdl – 33.22
III 269 248 165
CTD79 MUC46 BIGO2-4
29 Jan 27 Jan 20 Jan
12◦16.6900 12◦16.6970 12◦16.6900
77◦14.9990 77◦15.0010 77◦14.9950
128 129 128
bdl 0.02 –
IV 111
36 57
CTD29 MUC10 BIGO1-1
15 Jan 09 Jan 11 Jan
12◦18.7290 12◦18.7080 12◦18.7110
77◦17.7570 77◦17.7940 77◦17.8030
145 145 141
bdl 7.1
V 279
247 201
CTD81 MUC45 BIGO1-4
30 Jan 27 Jan 23 Jan
12◦21.4900 12◦21.4910 12◦21.5020
77◦21.7130 77◦21.7020 77◦21.7120
195 195 195
bdl 6.3 –
VI 92
198 74
CTD24 MUC34 BIGO2-2
13 Jan 23 Jan 12 Jan
12◦23.3000 12◦23.3000 12◦23.3000
77◦24.2000 77◦24.2280 77◦24.1860
244 244 244
bdl 11.9 –
VIII 66 107 207
CTD16 MUC23 BIGO2-5
12 Jan 15 Jan 24 Jan
12◦27.5350 12◦27.1980 12◦27.2070
77◦29.5930 77◦29.4970 77◦29.5170
414 407 409
bdl 12.1 –
that are driven by the Pacific subtropical anticyclone engen- der offshore transport of surface waters and upwelling of subsurface waters from the poleward-propagating Peru un- dercurrent (PUC) (Strub et al., 1998). These water masses are oxygen depleted and rich in nutrients, favoring primary production of up to 3.6 g C m−2d−1in surface waters (Pen- nington et al., 2006). As a consequence, the intense oxygen consumption induced by the degradation of sinking particu- late organic matter and a sluggish ventilation causes the de- velopment of a strong OMZ. Based on the definition that the oxycline of an OMZ is at∼22 µM (Fuenzalida et al., 2009), the Peruvian OMZ extends from approximately 50 to 700 m water depth. The greatest upwelling strength is reached dur- ing austral winter and spring between 5 and 15◦S (Strub et al., 1998). The phases of strong upwelling are followed by high rates of primary production in austral summer. The coastal area off Peru displays a highly variable hydrographic regime. Especially during positive ENSO periods, coastal trapped waves emerging from equatorial Kelvin waves in the equatorial eastern Pacific occur frequently (Gutiérrez et al., 2008, and references therein; Mosch et al., 2012). Conse- quently, the thermocline and the oxycline shift downwards by ca. 100 m and bottom-water oxygen concentrations can increase from practically zero to around 100 µM in days to weeks (Gutiérrez et al., 2008; Schunck et al., 2013; Graco et al., 2016). Seasonally, bottom waters of the shelf (75 m) can transition from oxic or hypoxic between austral winter/spring (low primary production) to anoxic throughout the rest of the year (Noffke et al., 2012). Furthermore, porewater ura-
nium profiles at 11◦S indicate variable redox conditions at the upper rim of the OMZ (Scholz et al., 2011). The shelf area above 200 m water depth is therefore characterized by non-steady-state conditions, whereas the oxygen concentra- tions in the core OMZ (∼200–400 m water depth) are pre- dominantly below the detection limit throughout the year.
The sediments of the Peruvian OMZ have POC contents ranging from 15 to 20 wt % within the OMZ and > 5 wt % below the OMZ and on the shelf (Dale et al., 2015). The fine-grained, diatomaceous mud lens between 11 and 15◦S accumulates under low PUC bottom-water velocities in 50 to 500 m water depth (Krissek et al., 1980). This favors high sedimentation rates, carbon preservation, and burial (Suess et al., 1987; Dale et al., 2015). Further down, at mid-slope depth, a high-energy regime favoring erosive settings leads to the formation of phosphorites (Reimers and Suess, 1983;
Glenn and Arthur, 1988; Arning et al., 2009b; Mosch et al., 2012). Another interesting observation between 70 and
∼300 m of water depth is the occurrence of mat-forming fil- amentous sulfur bacteria (Mosch et al., 2012). Bacterial mats are not conspicuous below 300 to 400 m water depth, and instead foraminiferal sands are more common.
3 Methods
Sampling of water-column particulate matter and sediment cores as well as the deployment of the benthic landers BIGO I and II (Biogeochemical Observatories) were conducted along the 12◦S depth transect during RV Meteor cruise
M92 in January 2013. The geographical position and water- column properties for the main stations are reported in Ta- ble 1. The data set on in situ phosphate fluxes comprised 10 stations from 74 to 989 m water depth. The water-column particle sampling was performed at six stations from 74 to 407 m water depth. These stations are considered as main sta- tions and for consistency the stations are numbered according to the data set published in Dale et al. (2015). Hydrographic parameters and oxygen concentrations were obtained by de- ploying a CTD/rosette equipped with a Seabird oxygen sen- sor (detection limit is 5 µM) calibrated by Winkler titration.
3.1 Water-column particles
Particulate matter was filtered using water from Niskin bot- tles from the CTD/rosette and analyzed for total particulate phosphorus (TPP), particulate inorganic phosphorus (PIP), and particulate organic carbon (POC) concentrations. Fol- lowing Labry et al. (2013), we expect the PIP phase to be comprised of inorganic P phases originating from abiotic par- ticulate P as well as inorganic P from biogenic particulate P. Abiotic PIP comprises detrital P associated with miner- als from terrigenous sources. Biotic PIP is composed of or- thophosphates, pyrophosphates, and polyphosphates within eukaryotic and prokaryotic cells.
Between three and six water depths were sampled per sta- tion. The water was filled into 10 L PE containers rinsed be- forehand with ultrapure water (MilliQ). The containers were shaken before filtration, which was performed within 24 h af- ter sample retrieval. Approximately 2 to 4 L of seawater were filtered through a pre-weighed and combusted (450◦C, 5 h) 0.7 µM Whatman GF/F filter using a seawater vacuum pump and Duran bottle top filters. After filtration, all filters were immediately frozen at−20◦C. At the shore-based laboratory the GF/F filters were dried overnight at 45◦C and divided into three equally sized pieces using a scalpel. The total fil- tered water volume was divided by 3 to calculate elemental concentrations on each filter section assuming homogenous coverage of particles on the filters.
3.1.1 Total particulate phosphorus (TPP), particulate inorganic phosphorus (PIP) and particulate organic phosphorus (POP)
The determination of TPP and PIP concentrations by com- bustion and colorimetric methods has been described by As- pila et al. (1976); Loh and Bauer (2000); Asahi et al. (2014), and others.. However, the combustion and acid dissolution (HTC/hydrolysis) that has been applied for PIP determina- tion is limited by the fact that polyphosphates are only partly hydrolyzed, but provides the best compromise compared to other methods (Labry et al., 2013). Although polyphosphates are underestimated, it includes intracellular P that is often dominant in plankton and only small amounts of organic P.
In the case of TPP we used the Aspila (1976) method without
an oxidant (e.g., MgSO4)during combustion, which under- estimates the TPP concentration in water-column particles.
However, for the sediments, the results following the As- pila (1976) method were compared to total digestions show- ing an average recovery of the Aspila method of approxi- mately 102 %. In two samples we found an overestimation in total digestion of more than 100 % and, in one sample, an underestimation of 32 %, possibly due to heterogeneity of the samples caused by very small phosphorite granules.
Filter segments for TPP concentration were combusted at 550◦C for 90 min and afterwards soaked with 20 mL 1 N hydrochloric acid (HCl) and shaken for 24 h at room temperature. Then, the solution was filtered and 0.35 mL triple reagent (40 mL 9.8 N sulfuric acid, 12 mL ammonium molybdate, and 4 mL potassium antimonyl tartrate solution) and 0.175 mL ascorbic acid and 3 mL 1 N HCl were added to 3.75 mL of the sample solution. Then, 0.3 mL of 12.5 N sodium hydroxide (NaOH) was added to the solution before colorimetric measurement of phosphate at 880 nm using a Hitachi U-2001 photospectrometer. This was done because test runs with the standard series revealed that the slope of the calibration curve was not steep enough to measure the low phosphate concentrations expected. To resolve this issue, the pH of the solution was slightly increased using NaOH. Mea- surements were accompanied using a standard series con- sisting of eight standards ranging from 5 to 100 µM PO3−4 , prepared from a Merck phosphate stock solution. We used 0.75 mL of each standard for the standard series and treated each of them in the same manner as described above. The samples were measured undiluted due to low concentrations and the technical detection limit of a 1 cm cuvette. Hence, we used 3.75 mL of the filtered sample solution, added the reagents mentioned above, and divided the concentrations by a factor of 5 to adjust the results to those of the standard se- ries. A factor of 0.02 was used to transform the concentration unit to µmol L−1. The amount of filtered water (f) refers to 1/3 of the total filtered water volume (f is different for each sample):
TPP or PIP[µmol L−1] = h
PO3−4 i
·0.02 5·f .
The same procedure was performed for PIP without the com- bustion step. The POP concentration was calculated by the difference of the measured (as phosphate) TPP and PIP con- centrations.
3.1.2 Organic carbon concentration
The filter sections for the analysis of POC concentration were fumed with 37 % HCl overnight to remove inorganic carbon, dried, and wrapped into tin caps. Samples were measured by flash combustion with a Carlo Erba elemental analyzer (NA1500). The analytical precision and detection limit were 0.04 dry wt %. The water-column POC concentrations are given in µmol L−1.
3.2 Porewater and solid-phase analysis
Sediment cores were recovered using video-guided multi- ple corers (MUCs) equipped with PVC liners with an in- ner diameter of 10 cm. The porewater and solid-phase sub- sampling was performed immediately after recovery in an argon-filled glove bag at in situ seafloor temperature. The bottom water was siphoned with a plastic tube and filtered through cellulose acetate filters. Afterwards, the cores were sectioned into 0.5 cm intervals from 0 to 5 cm sediment depth and 1 cm intervals afterwards. The sediment samples were filled into centrifuge tubes and the porewater was separated from the sediments by centrifuging for 20 min at∼3940G.
The supernatant porewater was filtered through cellulose ac- etate filters inside the glove bag. Samples were immediately analyzed for total dissolved phosphate (TPO4)and dissolved ferrous iron (Fe2+)after porewater extraction using a Hitachi U-2001 spectrophotometer. The analyses were performed ac- cording to the standard techniques described in Grasshoff et al. (1999). A sediment subsample was taken from each sed- iment depth and stored refrigerated in pre-weighed air-tight plastic cups to determine the water content, porosity, and to- tal organic carbon (TOC) content. The residual sediments were stored frozen at −20◦C (sediment and filter samples) and the porewater samples were refrigerated at 4◦C for land- based analytics.
The TOC concentration (in µmol mg−1) of freeze-dried and ground sediment samples was determined by flash com- bustion in a Carlo Erba Elemental Analyzer (NA 1500). For POC determination, samples were decalcified with 2.5 N HCl prior to the measurement. Solid-phase TPP and PIP concen- trations were measured according to the method of Aspila et al. (1976) in a similar manner as described above. The 50 mg of freeze-dried and ground sediment were digested in 1 N HCl for a minimum of 24 h to dissolve the sedimentary PIP phase. Sediment portions analyzed for TPP were com- busted at 550◦C for 90 min before adding 1 N HCl. The so- lutions were filtered and the reagents mentioned above were added prior to measurement. We used the sedimentary refer- ence standards SDO-1 (Devonian Ohio Shale, USGS; Govin- daraju, 1994) and MESS-3 (Marine Sediment Reference Ma- terial, Canadian Research Council) and replicate measure- ments of samples to ensure measurement accuracy. The stan- dard series applied to the measurements covered a concen- tration range from 5 to 100 µM.
To determine the terrigenous P input to the sediments, and to calculate the TPP burial flux (for calculation, see Sect. 3.6 and Table 2), sediments were analyzed using total digestion.
About 100 mg of freeze-dried and ground sediment were di- gested in hydrofluoric acid (40 %, supra pure), nitric acid (65 %, supra pure), and perchloric acid (60 %, supra pure).
For measurement accuracy the reference standards SDO-1 and MESS-3 as well as methodological blanks were included in the analysis. The aluminum concentration in the digestion solutions was measured using an inductively coupled plasma
optical emission spectrometer (ICP-OES, Varian 720 ES).
The relative standard deviation (RSD) for [Al] was found to be < 1 %.
The XRD data of core 107MUC23 from 407 m water depth were obtained from approximately 1 g of freeze-dried and ground sediment in the lab of the University of Bremen.
3.3 POC in relation to various fractions of P (POC/ xP ratios)
The molar POC/ xP ratios (wherexP=TPP, PIP, or POP) of the water-column particles at stations I, IV, and V were calculated from measurements on two filter samples per wa- ter depth. For these samples a minimum and maximum value were calculated. For the other stations III, VI, and VIII, only one sample per water depth was available. Here, we assumed an average natural variability calculated from the duplicate measurements of stations I, IV, and V for each P species (Supplement). For sediment samples we calculated a stan- dard deviation from repeated measurements of the sediment standards MESS-3 and SDO-1 (Supplement).
3.4 Benthic lander fluxes
Benthic lander deployments were performed at 10 stations along the 12◦S transect (I to X according to Dale et al., 2015). In situ benthic fluxes were obtained using the two BIGOs I and II (BIGO: Biogeochemical Observatory). They were equipped with two circular flux chambers (internal di- ameter 28.8 cm, area 651.4 cm2)(Sommer et al., 2009). An online video-controlled launch system allowed precise place- ment of the BIGO at the seafloor directly located beneath the particle sampling stations in the water column and in prox- imity to the multi-corer stations. After a 4 h rest period at the seafloor during which surrounding bottom water was period- ically flushed into the chamber, the chambers were slowly driven into the sediment. The BIGOs stayed for 28 h at the seafloor, while eight water samples per chamber were taken via glass syringes. In order to obtain bottom water back- ground information, additional samples were taken every 8 h from the ambient bottom water. Phosphate concentrations in the syringe samples were measured on board using an auto analyzer. The standard series covered a concentration range from 0.05 to 3.5 µM. The fluxes were calculated from the slope of linear regression of all eight data points vs. the sam- pling time (Supplement) and corrected for the water volume in the chamber and the dead volume of the 1 m long Vygon tubes connecting the syringes with the flux chambers. The error caused by the dilution from the dead volume of these tubes was calculated from the chloride concentration mea- sured in the syringe samples. Benthic lander TPO4fluxes for most sites are based on two replicate chamber measurements.
The uncertainty given for the TPO4fluxes is the difference between the minimum and maximum fluxes from the aver- age of the two benthic chambers. At two stations (IV and V),
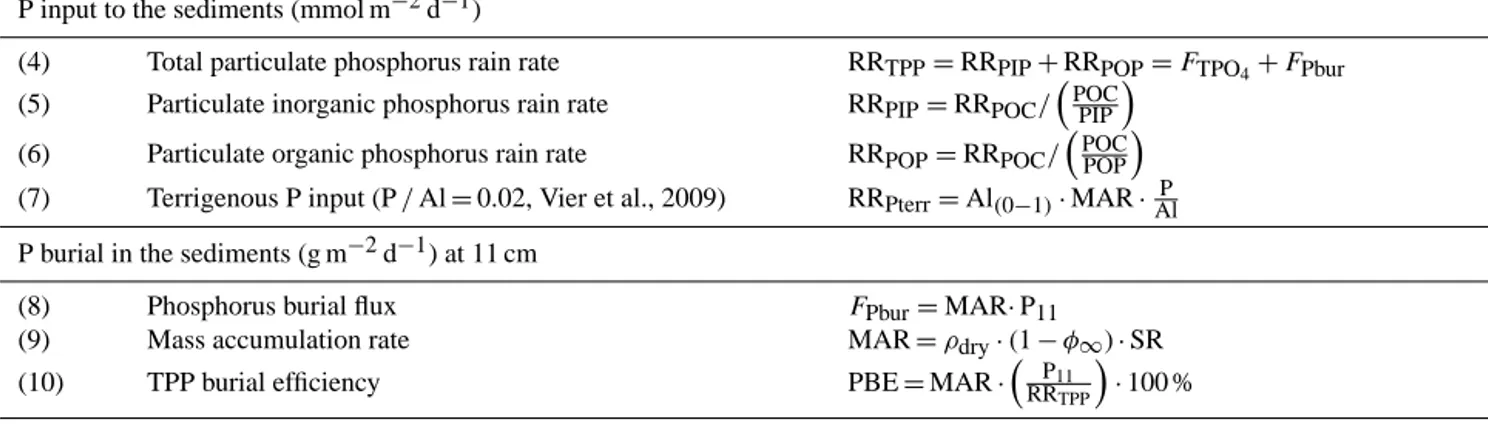
Table 2. Equations for the P mass balance calculations. Results are shown in Table 4.
P input to the sediments (mmol m−2d−1)
(4) Total particulate phosphorus rain rate RRTPP=RRPIP+RRPOP=FTPO4+FPbur (5) Particulate inorganic phosphorus rain rate RRPIP=RRPOC/
POC PIP
(6) Particulate organic phosphorus rain rate RRPOP=RRPOC/ POC POP
(7) Terrigenous P input (P/Al=0.02, Vier et al., 2009) RRPterr=Al(0−1)·MAR· P Al P burial in the sediments (g m−2d−1) at 11 cm
(8) Phosphorus burial flux FPbur=MAR·P11
(9) Mass accumulation rate MAR=ρdry·(1−φ∞)·SR
(10) TPP burial efficiency PBE=MAR·
P11
RRTPP
·100 % P release from the sediments (mmol m−2d−1)
Benthic P fluxes (FTPO4)and the potential diffusive P fluxes were determined as described in the methods.
(11) P release from POP degradation according to Redfield (C/P=106)
FP(Red)=FDIC/106
(12) True P release from POP FP(POP)=FDIC/
POC POP
(13) P release from total particulate phosphorus FP(TPP)=FDIC/ POC TPP
(14) P release from the dissolution of Fe (oxyhydr)oxides (Fe/P=10, Slomp et al., 1996)
FP(Fe)=FFe2+/ Fe
P
(15) P deficit to outbalance the P budget FP(deficit)=RRTPP+RRterr+FP(Fe)−(FTPO4+FPbur)
it was only possible to calculate the flux from one chamber.
For further details on the benthic flux measurements during the M92 cruise, see Dale et al. (2015).
3.5 Diffusive flux calculations
The diffusive fluxes of TPO4and Fe2+from the sediment to the bottom water were calculated by applying Fick’s first law of diffusion:
FTPO
4/Fe2+= −φDSED(d[C]/dx), (1) where the term d[C]/dx describes the concentration gradi- ent between the bottom water and the first porewater sample of the surface sediment divided by the corresponding sedi- ment depth (0.25 or 0.5 cm), andφis the porosity of the sur- face sediment. The diffusion coefficient,DSED, for sediments was calculated accordingly:
DSED=DSW/θ2. (2)
The diffusion coefficients for TPO4and Fe2+under standard conditions (DSW; 298.15 K and 1 bar) were taken from Li and Gregory (1974) and corrected for the in situ temperature and pressure using the Stokes–Einstein equation. The tortu- osity (θ2)was derived from the sediment porosity according to the modified Weissberg formulation (Boudreau, 1996):
θ2=1−ln(φ2). (3)
Uncertainty in the diffusive flux was calculated at station I as the difference between the fluxes calculated from two
separate sediment cores. For the other stations, only one core was available to calculate the flux.
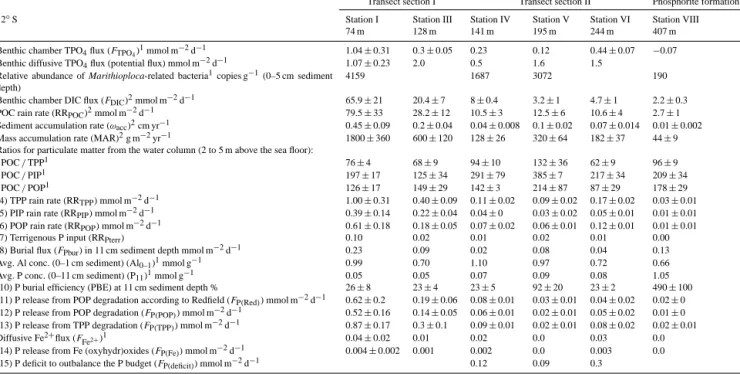
3.6 Mass balance of benthic phosphorus cycling To investigate benthic P cycling quantitatively, a mass bal- ance was developed considering P input, P burial, and P re- lease. The equations for the P mass balance calculations are shown in Table 2. Under steady-state conditions, the total P rain rate should balance the P buried in the sediments and the benthic TPO4 flux (Eq. 4 in Table 2). The rain rates of particulate P delivered to the sediments are differenti- ated in inorganic P (RRPIP)(Eq. 5 in Table 2) and organic P (RRPOP)(Eq. 6, Table 2). The rates were calculated us- ing the POC/ xP ratio of the water-column particles that were taken as close as possible to the seafloor at each sta- tion (2–5 m above ground) and the POC rain rate (RRPOC) (Table 4 and the Supplement). RRPOCfor the same stations along the 12◦S transect were previously calculated by Dale et al. (2015) as the sum of the measured benthic DIC flux and the POC accumulation rate. The terrigenous P input (RRPterr) (Eq. 7 in Table 2) can be estimated by multiplying the solid- phase Al concentration of the first sediment sample by the mass accumulation rate (Dale et al., 2015) and a P/Al ratio of 0.02 that characterizes the P/Al ratio of riverine particles originating from the continent (Viers et al., 2009).
The P burial flux (FPbur)(Eq. 8 in Table 2) was calculated by multiplying the mass accumulation rate (MAR) and the average solid-phase P concentration of the first 11 sediment
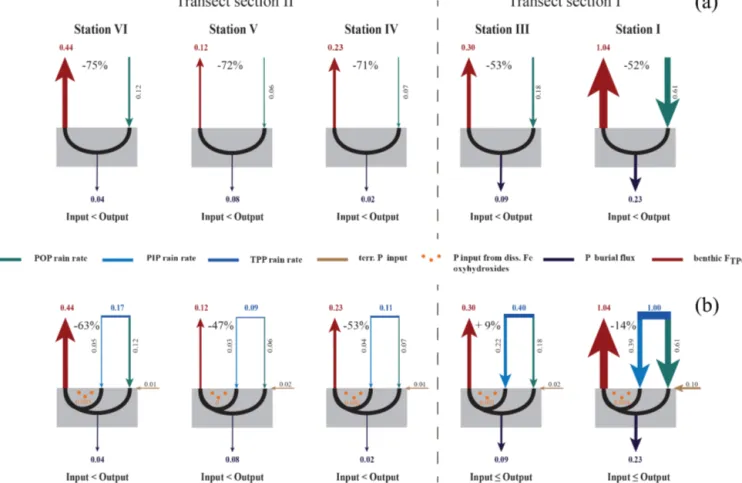
Figure 2. (a) Concentration profiles of TPP, PIP, POP, and POC of the water-column particles and the surface sediments along the 12◦S transect. Water-column particle concentrations (upper panel) are given in µmol L−1and surface sediment concentrations (lower panel) are shown in µmol mg−1. Note that the water-column particle concentrations shown for station VI (244 m) at 10 m water depth are∼5 times higher than at the other stations. (b) Ratios of POC to TPP, PIP, and POP (POC/ xP) along the 12◦S depth transect of water-column particles and surface sediments (0–5.5 cm depth) of station I to VIII (74 to 407 m).
centimeters (P11)(11 cm is due to our sampling resolution).
This approach was chosen according to Dale et al. (2015), who also calculated the POC accumulation rate for the OMZ stations (i.e., not on the shelf or below the OMZ) using the el- emental average concentration. MAR (Eq. 9 in Table 2) was calculated from the sedimentation rate (ωaccin cm yr−1), dry bulk density (ρdry; in g cm−3), and the average porosity of the sediments at the lower core end. Sedimentation accumula- tion rates were determined from particle-bound210Pbxsmea- surements using a modeling approach. A detailed method de- scription and the values used for this work are published in Dale et al. (2015). The error derived from modeling the sed- imentation rate was given as 20 % and propagates to all sub- sequent calculations where it was used.
3.7 Freeze–thaw experiments
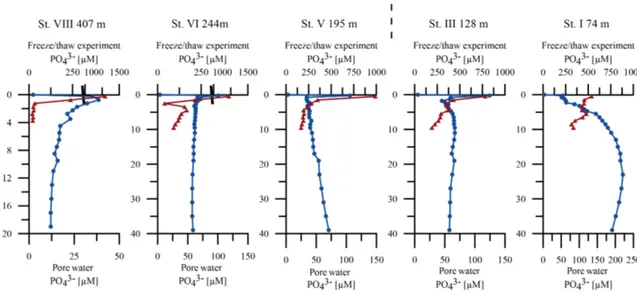
In order to determine the amount of polyphosphate stored in sulfide-oxidizing bacteria, foraminifera, and other bacteria, we conducted additional sediment experiments at all transect stations except station IV. Sediments from MUC corers were sliced into 1 cm thick slices from the surface sediment to 10 cm sediment depth. Before phosphate analysis, sediment slices were repeatedly frozen at−80◦C and defrosted in or- der to burst microbial cells and release the internally stored P to the porewater.
3.8 Molecular quantification of filamentous bacteria In order to quantify the abundance of filamentous mi- crobes at the benthic boundary layer, we used a molecu- lar approach. Nucleic acid purification was performed on 0.5 g sediment following established protocols (Bertics et al., 2013). DNA was quality checked on an agarose gel and quantified using a NanoDrop spectrophotometer (Pe- qlab, Erlangen, Germany). The 16S rDNA fragments were taken from a previously generated metagenome from this region (GenBank Bioproject PRJNA280940) and the re- spective sequence countings were deposited at GenBank (ID KU312264-KU312267). Sequencing was carried out in the Institute of Clinical Molecular Biology at Kiel Uni- versity. Sequences were analyzed using a Clustal W align- ment tool on Mega 6 (Tamura et al., 2013). A qPCR primer and probe set was established using the Primer Ex- press software (Life Technologies, Carlsbad, USA) with the forward primer 50AGAAGCACCGGCTAACTCTG-30, the reverse primer 50-CCAGGTAAGGTTCTTCGCGT-30, and probe 829-Thioploca 50-GGATTAATTTCCCCCAACAT-30 (Teske et al., 1995). Primers and probes were tested in silico on the Silva database and cross amplification was excluded on a variety of 16S rDNA clones. The qPCRs were per- formed in technical duplicates on a ViiA7 system (Life Tech- nologies, Carlsbad, USA) as previously described (Löscher et al., 2012) using a 1× TaqMan PCR buffer (Life Tech- nologies, Carlsbad, USA), a 2.5 pmol µL−1TaqMan probe,
5 pmol µL−1 of each primer, 400 ng µL−1 bovine serum al- bumin (to avoid PCR inhibition without affecting standard curves or detection limits), 3 µL PCR water, and 5 µL of ei- ther standard DNA or environmental sample. A plasmid con- taining the target sequence was used to generate a standard dilution series for absolute quantification. The melting tem- perature was set to 50◦C. A theoretical detection limit of four copies per PCR reaction was calculated. The results of the analysis are given in copies g−1of 16S rDNA sequences of sulfur bacteria that are related to Marithioploca.
4 Results
4.1 P composition of water-column particulate matter and surface sediments
4.1.1 TPP, PIP, POP and POC concentrations
The TPP concentrations ranged from 0.02 to 0.2 µmol L−1in the water-column particles and from 0.04 to 2.37 µmol mg−1 in the surface sediments (Supplement). Overall, the profiles along the transect show no significant trends through the wa- ter column (Fig. 2a). The highest concentrations occurred in the surface waters around 10 m of water depth. At sta- tions I, V, and VIII (74, 195, and 407 m), the TPP con- centrations slightly increased close to the seafloor, whereas at the other stations no such trend was observed (Fig. 2a and the Supplement). In the sediments the TPP concentra- tions slightly decreased with sediment depth, except at sta- tion VIII (407 m). Here, the highest sedimentary TPP con- centrations across the transect were found at 2.25 cm sedi- ment depth (17 µmol mg−1). Below that depth the concen- trations decreased, but remained high compared to the other stations.
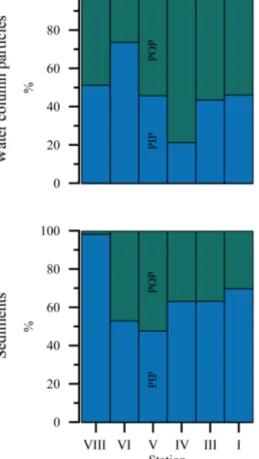
The PIP and POP concentrations (water column and sed- iments) generally followed the trends of the TPP profiles and contributed roughly equally to TPP. The PIP fraction ac- counted for 21 to 74 % of TPP in the water-column particles (Fig. 3), similar to that reported in previous studies (Paytan et al., 2003; Faul et al., 2005; Benitez-Nelson et al., 2007;
Lyons et al., 2011; Sekula-Wood et al., 2012). At stations I, VI, and VIII (74, 244, and 407 m), the PIP concentrations were larger than POP. The opposite occurred at station V (195 m), where the POP fraction was clearly larger than the PIP fraction throughout the entire water column. In compar- ison to the water-column particles, the sedimentary PIP frac- tion was larger than POP in most samples, reaching between 48 and 98 % of TPP. However, the strongest deviation be- tween PIP and POP concentrations was found in the sedi- ments of station VIII (407 m), where the PIP concentration was up to a factor of∼50 larger than the POP concentration and comprised up to 98 % of TPP. XRD data from that sta- tion revealed that 7 to 16 wt % of the sediments consisted of apatite and other P-bearing minerals (data not shown).
Figure 3. Average distribution of POP and PIP (%) per station in the water-column particles and in the top 5.5 cm of the sediments.
The particulate organic carbon concentrations ranged from 2.2 to 17.6 µmol L−1in the water-column particles and from 2.8 to 13.4 µmol mg−1 in the surface sediments. Within the water column the highest concentrations occurred in the sur- face water samples, while the concentration measured at sta- tion VI (244 m) is about 5 times higher compared to other samples from the same water depth. Below the surface wa- ter concentration peak, the concentrations were on average 7 µmol L−1with distinct depth trends. The sedimentary POC concentrations were on average 7.7 µmol mg−1for the whole transect. Overall, the POC concentrations showed little vari- ability with sediment depth. At stations III, VI, and VIII (128, 244, and 407 m), the concentrations increased slightly with sediment depth. At station I (74 m) the concentration decreased slightly with sediment depth.
4.2 Particulate organic carbon to phosphorus (POP, PIP, TPP) ratios
4.2.1 POC/POP ratios
The molar POC/POP ratios of the water-column particles and of the surface sediments were consistently higher than the Redfield ratio of 106 (Redfield, 1963) at all stations
(Fig. 2b). The average POC/POP ratio of the water-column particles was 202±29. There was no clear trend through the water column, except for slightly increasing ratios between the deepest water-column samples and the surface sediment samples. In the surface sediments, the ratios increased within the upper 6 cm with an average POC/POP ratio of 303±77.
Station VIII (407 m) is an exception, and here the ratio de- creased to 81 within the first∼2 cm of sediment and then strongly increased to≥600.
4.2.2 POC/PIP ratios
The average POC/PIP ratio of the water-column particles was 248±34. Similar to the POC/POP ratios, there was no significant trend through the water column. At the ma- jority of the stations, the ratios decreased close to the seabed.
The average POC/PIP ratio of the surface sediments was 184±34 and almost invariable with water depth. In the sed- iments, the ratios showed no significant down-core trend. At station VIII (407 m) the ratio in the sediments showed a dra- matic decrease compared to the water column, with an aver- age of 7, similar to the POC/TPP ratios (below).
4.2.3 POC/TPP ratios
The POC/TPP ratios of the water-column particles and sur- face sediments consistently varied around the Redfield ratio.
The exceptions are station I (74 m) and the deepest station (station VIII, 407 m). At station I, the sediments showed sig- nificantly lower than Redfield ratios, with an average of 69 in the surface sediments. The average POC/TPP ratio of the surface sediments at station VIII (407 m) was 7. Between the deepest water-column sample and the first sediment sample, the POC/TPP ratios were rather constant without a consis- tent trend, again with the exception of station VIII (407 m), where the ratios decreased sharply.
4.3 In situ benthic chamber fluxes
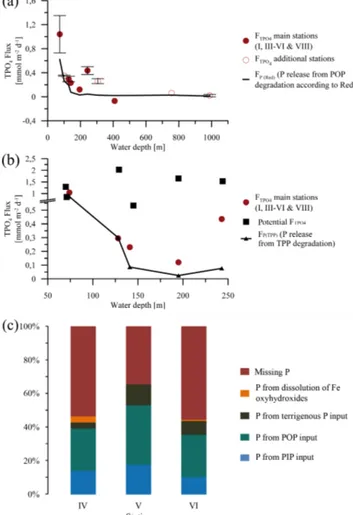
The benthic lander TPO4 fluxes (FTPO4) are presented in Table 3 and Fig. 4a. Positive fluxes are defined as directed from the sediments into the water column. The highest TPO4
flux along the depth transect of 1.04±0.31 mmol m−2d−1 occurred at station I (74 m). Below 74 m water depth, fluxes decreased by at least a factor of 3 to 0.2–
0.3 mmol m2d−1 at 144 m water depth. Measurements at station V (195 m) showed a slightly increased TPO4 flux of 0.44±0.07 mmol m−2d−1, while the fluxes measured at 244 m (station VI) and 306 m (station VII) decreased to the levels mentioned before. At 407 m water depth (station VIII), the TPO4flux was negative, indicating a phosphate up- take by the sediment. Below the OMZ, the fluxes increased to slightly positive values, but remained low at 0.06 and 0.02±0.02 mmol m−2d−1.
Table 3. In situ benthic chamber TPO4 fluxes in mmol m−2d−1 along the 12◦S transect. The numbers are shown as an average and standard deviation calculated from the minimum and maximum fluxes determined from two benthic chambers.
Station Water depth FTPO4
(m) (mmol m−2d−1)
I BIGO1_2 74 1.04±0.31
II BIGO1_5 101 0.35±0.01
III BIGO2_4 128 0.30±0.05
IV BIGO1_1 141 0.23∗
V BIGO1_4 195 0.12∗
VI BIGO2_2 243 0.44±0.07
VII BIGO2_1 306 0.26±0.04
VIII BIGO2_5 409 −0.07∗
IX BIGO2_3 756 0.06∗
X BIGO1_3 989 0.02±0.02
∗Only one benthic flux was measured.
4.3.1 Comparison of benthic chamber TPO4fluxes and diffusive TPO4fluxes
The measured benthic chamber TPO4fluxes and the calcu- lated diffusive TPO4fluxes showed large discrepancies. The calculated diffusive fluxes were consistently higher than the benthic fluxes (Table 4, Fig. 4b). In contrast to the in situ measured benthic chamber TPO4 release rates, the calcu- lation of diffusive TPO4 fluxes relies on bottom water and porewater PO3−4 concentrations. A subsurface PO3−4 peak occurred at all stations in the uppermost depth interval at 0–0.25 cm, causing a large concentration gradient between the bottom water and the porewater PO3−4 concentrations (Fig. 7). Even though the measured benthic TPO4fluxes ex- ceeded the fluxes that could be generated by TPP degradation by a factor of approximately 6, the diffusive TPO4 fluxes were still higher (Table 4). Hence, the diffusive TPO4 flux will be referred to as potential TPO4flux in the following.
4.4 TPP burial fluxes and TPP burial efficiency The P burial fluxes decreased with increasing water depth (Table 4). Station I (74 m) showed by far the highest P burial flux, with 0.23 mmol m−2d−1. In contrast, the P burial effi- ciency at this station (Eq. 10) was comparatively low, reach- ing only approximately 26 %. At station VIII (407 m), the TPP burial flux was 13 mmol m−2d−1, and the P burial effi- ciency exceeded 100 % due to the uptake of dissolved P from ambient bottom waters.
4.5 Molecular analysis and relative abundance of filamentous sulfur bacteria
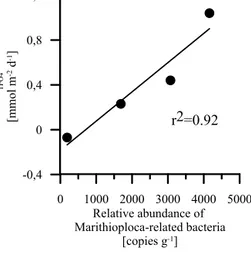
Molecular analysis indicated the presence of Marithioploca- related bacteria (Salman et al., 2011) in the surface sediments
Figure 4. (a) Measured benthic TPO4 fluxes (mmol m−2d−1)at 12◦S. The black line shows the theoretical TPO4 flux generated from organic matter degradation with a Redfield POC/POP ratio of 106. (b) Potential TPO4fluxes (mmol m−2d−1)calculated from porewater profiles compared to the measured benthic TPO4fluxes (mmol m−2d−1)at stations I to VIII (74 to 407 m). The black line with triangles depicts the TPO4flux that could be generated during degradation of total particulate phosphorus. (c) P percentages of the different P sources and the missing P that is needed to maintain the measured TPO4release rates and P burial fluxes for stations IV, V, and VI (141, 195, and 244 m) of transect section II. The missing P is assumed to be supplied by sulfide-oxidizing Marithioploca-related bacteria (see Discussion).
(0–5 cm). Our analysis may, however, underestimate the ab- solute abundance of these organisms due to a self-splicing mechanism of the 16S rDNA gene (Salman et al., 2012) and is therefore only indicative for their relative abundance.
The relative abundance of Marithioploca-related bacteria decreased with increasing water depth (Table 4). The highest relative abundance with more than 4000 copies g−1sediment was found at station I (74 m), decreasing by more than a fac- tor of 20 to 190 copies g−1sediment at station VIII (407 m).
Table 4. Measured and calculated parameters for the P mass balance along the 12◦S transect. The numbers in front of key parameters correspond to equations in Table 2.
Transect section I Transect section II Phosphorite formation
12◦S Station I Station III Station IV Station V Station VI Station VIII
74 m 128 m 141 m 195 m 244 m 407 m
Benthic chamber TPO4flux (FTPO4)1mmol m−2d−1 1.04±0.31 0.3±0.05 0.23 0.12 0.44±0.07 −0.07
Benthic diffusive TPO4flux (potential flux) mmol m−2d−1 1.07±0.23 2.0 0.5 1.6 1.5
Relative abundance of Marithioploca-related bacteria1copies g−1(0–5 cm sediment depth)
4159 1687 3072 190
Benthic chamber DIC flux (FDIC)2mmol m−2d−1 65.9±21 20.4±7 8±0.4 3.2±1 4.7±1 2.2±0.3
POC rain rate (RRPOC)2mmol m−2d−1 79.5±33 28.2±12 10.5±3 12.5±6 10.6±4 2.7±1
Sediment accumulation rate (ωacc)2cm yr−1 0.45±0.09 0.2±0.04 0.04±0.008 0.1±0.02 0.07±0.014 0.01±0.002
Mass accumulation rate (MAR)2g m−2yr−1 1800±360 600±120 128±26 320±64 182±37 44±9
Ratios for particulate matter from the water column (2 to 5 m above the sea floor):
POC/TPP1 76±4 68±9 94±10 132±36 62±9 96±9
POC/PIP1 197±17 125±34 291±79 385±7 217±34 209±34
POC/POP1 126±17 149±29 142±3 214±87 87±29 178±29
(4) TPP rain rate (RRTPP) mmol m−2d−1 1.00±0.31 0.40±0.09 0.11±0.02 0.09±0.02 0.17±0.02 0.03±0.01 (5) PIP rain rate (RRPIP) mmol m−2d−1 0.39±0.14 0.22±0.04 0.04±0 0.03±0.02 0.05±0.01 0.01±0.01 (6) POP rain rate (RRPOP) mmol m−2d−1 0.61±0.18 0.18±0.05 0.07±0.02 0.06±0.01 0.12±0.01 0.01±0.01
(7) Terrigenous P input (RRPterr) 0.10 0.02 0.01 0.02 0.01 0.00
(8) Burial flux (FPbur) in 11 cm sediment depth mmol m−2d−1 0.23 0.09 0.02 0.08 0.04 0.13
Avg. Al conc. (0–1 cm sediment) (Al0–1)1mmol g−1 0.99 0.70 1.10 0.97 0.72 0.66
Avg. P conc. (0–11 cm sediment) (P11)1mmol g−1 0.05 0.05 0.07 0.09 0.08 1.05
(10) P burial efficiency (PBE) at 11 cm sediment depth % 26±8 23±4 23±5 92±20 23±2 490±100
(11) P release from POP degradation according to Redfield (FP(Red)) mmol m−2d−1 0.62±0.2 0.19±0.06 0.08±0.01 0.03±0.01 0.04±0.02 0.02±0 (12) P release from POP degradation (FP(POP)) mmol m−2d−1 0.52±0.16 0.14±0.05 0.06±0.01 0.02±0.01 0.05±0.02 0.01±0 (13) P release from TPP degradation (FP(TPP)) mmol m−2d−1 0.87±0.17 0.3±0.1 0.09±0.01 0.02±0.01 0.08±0.02 0.02±0.01
Diffusive Fe2+flux (FFe2+)1 0.04±0.02 0.01 0.02 0.0 0.03 0.0
(14) P release from Fe (oxyhydr)oxides (FP(Fe)) mmol m−2d−1 0.004±0.002 0.001 0.002 0.0 0.003 0.0
(15) P deficit to outbalance the P budget (FP(deficit)) mmol m−2d−1 0.12 0.09 0.3
1This study;2published data from Dale et al. (2015)
5 Discussion
5.1 POC/ xP ratios in water-column particles and sediments
In order to characterize the fate of P in oxygen-deficient wa- ters and sediments, we determined POC/ xP ratios from both environments. Previous studies focused either on the water column or on the sediments (Anderson et al., 2001, and refer- ences therein; Benitez-Nelson et al., 2004; Faul et al., 2005;
Jilbert et al., 2011; Lyons et al., 2011; Sekula-Wood et al., 2012). The present data set provides a more complete insight into compositional changes and allows us to more rigorously constrain the sedimentary P mass balance compared to ear- lier studies (Ingall and Jahnke, 1994; Mort et al., 2010; Kraal et al., 2012; Noffke, 2014).
Both water-column particles and the surface sediments from the Peruvian OMZ displayed POC/POP ratios above Redfield, indicating depletion of organic P relative to or- ganic C. Similar observations have been reported before from this and other regions of the ocean (Loh and Bauer, 2000;
Benitez-Nelson et al., 2004; Faul et al., 2005; Franz et al., 2012, and others). Preferential remineralization of P phases from sinking particles should lead to increasing POC/POP ratios with increasing water depth, as observed in oxygenated areas of the ocean (reviewed by Ruttenberg, 2014). However, in the anoxic Cariaco Basin, no such preferential P mineral- ization was noted (Benitez-Nelson et al., 2004). Our results
also showed no clear decrease in the POC/POP ratio in the water column, with the possible exception of stations I and VIII. Higher than Redfield POC/POP ratios have been ob- served previously in Peru, and may instead be driven by the C-to-P composition of the diatomaceous phytoplankton com- munities (Franz et al., 2012) rather than preferential P disso- lution or other controls such as the input of terrestrial plant material with high POC/POP ratios.
Preferential POP over POC remineralization in anoxic sediments remains controversial (Ingall and Van Cappellen, 1990; Ingall and Jahnke, 1994; Colman et al., 1997; Ander- son et al, 2001; McManus et al., 1997; Ruttenberg, 2003;
Jilbert et al., 2011). Our results showed no clear trend across all stations. At stations I, IV, and VI (74, 141, and 244 m), the POC/POP increased with sediment depth, indicating prefer- ential POP over POC remineralization. At station III (128 m) this trend occured only in the upper cm, and at station V (195 m) no preferential POP over POC remineralization was found. POC/POP ratios at station VIII (407 m) showed a POP enrichment over the upper 2 cm of the sediment. Be- low this depth, there was a sudden increase in POC/POP ratios, which is likely due to intense POP remineralization and subsequent authigenic formation of phosphorites (sink- switching; see Sect. 5.2.3).
Another interesting finding pointing to sink-switching can be found in the POC/POP and POC/PIP ratios of the deep- est water-column particle sample and the first sediment sam- ple at stations I, IV, VI, and VIII (74, 141, 244, and 407 m).
Increasing POC/POP and decreasing POC/PIP ratios indi- cate that POP is converted into PIP while the TPP content of the sediment is conserved (Fig. 2a and b). In agreement with similar findings in anoxic sediments (Ruttenberg and Berner, 1993; Faul et al., 2005, and others), we assume that the ob- served POP to PIP transformation is due to the formation of CFA. However, our results emphasize that sink-switching is obviously occurring at the interface between bottom waters and sediments.
Interestingly, the water-column POC/TPP ratios were close to the Redfield ratio. This could be an effect of surface adsorption of P on phytoplankton as previously described by Sanudo-Wilhelmy et al. (2004). Those authors investigated different species of Trichodesmium from the Atlantic Ocean and found that the intracellular P pool was strongly depleted relative to C, whereas the combination of the intracellular plus surface adsorbed P was close to the Redfield ratio. Al- though we did not exactly differentiate between internal and external P pools, and considering that additional P sources like terrigenous P are negligible (see Sect. 5.2.1), our re- sults generally support the findings of Sanudo-Wilhelmy et al. (2004). However, future studies are required to substanti- ate this hypothesis.
Sedimentary POC/TPP ratios were also close to Redfield, except at stations I and VIII (74 and 407 m). Thus, on the one hand, the sink switching mechanism operates efficiently under low-oxygen conditions and, on the other hand, the rel- ative degradations of TPP and POC do not change from the water column to the sediments (Fig. 2b). This is an impor- tant finding because at first sight this observation seems to be inconsistent with the long-standing paradigm that low- oxygen conditions promote the enhanced release of dissolved P from sediments (Van Cappellen and Ingall, 1996). How- ever, it should be noted that marine sediments covered by oxygenated bottom waters display molar POC/TPP ratios ranging from about 10 to 50 (Baturin, 2007). These ratios are much lower than Redfield because P is retained in sediments via adsorption, authigenic mineral precipitation such as Fe (oxyhydr)oxides and microbial P sequestration (Ingall and Jahnke, 1994), and because POC is more efficiently degraded under aerobic conditions (Hedges et al., 1999; Wallmann, 2010). In contrast, our data set implies that oxygen deficiency causes a shift of POC/TPP ratios to values closer to Red- field compared to oxygenated regions, which is due to both, the enhanced preservation of POC (Dale et al., 2015) and re- lease of dissolved phosphate under low-oxygen conditions.
It remains puzzling why the extreme P depletion observed in some black shale sequences (e.g., POC/TPP > 3000, Ingall and Jahnke, 1994) is not found in modern anoxic sediments such as those on the Peru margin.
5.2 P mass balance
P release rates from sediments underlying oxygen-deficient waters are strongly enhanced compared to oxygenated ma-
rine settings, especially in the Peruvian OMZ (Noffke et al., 2012, 2016). Nonetheless, the sources of the enhanced P re- lease are still not completely identified. The widely held view is that POP raining from the water column to the sediments represents the main source of sedimentary P in high produc- tive areas like the Peru upwelling system (Delaney, 1998;
Filippelli, 2008). Mass balance approaches that resolve the P regeneration vs. burial in oxygen-deficient environments by combining sedimentary data and benthic P fluxes are rare (Ingall and Jahnke, 1994; Ingall et al., 2005; Mort et al., 2010; Kraal et al., 2012; Noffke, 2014). These studies are all based on sediment data only; that is, the external P input to the sediments is estimated or ignored. Furthermore, the study areas were often not covered by fully anoxic bottom waters. Noffke (2014) presented an approach that combines measurements of solid-phase P speciation, sediment burial fluxes, and benthic chamber flux measurements for a mass balance on benthic P cycling in the Peruvian OMZ. Inter- estingly, the measurements on the solid-phase P speciation revealed that organic P accounted for only 18–37 % of the total sedimentary P on the shelf and upper slope (Noffke, 2014). Furthermore, it was found that P bound to Fe (oxy- hydr)oxides and terrigenous P was of minor importance for the total sedimentary P inventory. However, authigenic Ca–P with a high amount of fish-P accounted for up to 47 % of the total P in sediments down to 300 m water depth and for up to 70 % in sediments below 300 m water depth. Consequently, Noffke (2014) suggested that authigenic Ca–P phases are an additional major P source besides organic P for benthic P re- lease in the Peruvian OMZ.
Their mass balance approach was solely based on benthic work and has large uncertainties regarding the particulate P input from the water column. Our approach includes the par- ticulate organic and inorganic P input from the water col- umn, benthic P flux measurements, and the P burial fluxes, and is based on the steady-state assumption that the P in- put has to be sufficient to maintain the benthic P flux and P burial flux. The P mass balance calculations (Table 4) illus- trate the variability in TPO4release and burial as well as in the magnitude of particulate organic (Fig. 5a) and particu- late inorganic P input (Fig. 5b) across the transect. Follow- ing the general assumption that POP is the major P phase delivered to the sediments (Delaney, 1998; Filippelli, 2008), we first calculated whether the rain rate of POP (RRPOP)to the seafloor can account for the measured benthic P fluxes (FTPO4)and P burial fluxes (FPbur)(Fig. 5a, Table 4). How- ever, as already suggested by Noffke et al. (2012) and Nof- fke (2014), the POP fraction is far too small to balance the measured benthic fluxes in the Peruvian OMZ. The POP rain rates calculated along the transect can account for only 25 to 48 % of the measured TPO4fluxes (Fig. 5a), suggesting the likely presence of an additional inorganic source of dissolved phosphate (Noffke, 2014). Similar to previous studies (Pay- tan et al., 2003; Faul et al., 2005; Benitez-Nelson et al., 2007;
Lyons et al., 2011; Sekula-Wood et al., 2012), we found that