Benthic fluxes of trace metals in the Chukchi Sea and their transport into the Arctic Ocean
Lúcia H. Vieira1, Eric P. Achterberg1, Jan Scholten2, Aaron J. Beck1, Volker Liebetrau1, Matthew M. Mills3 and Kevin R. Arrigo3
1 GEOMAR Helmholtz Centre for Ocean Research Kiel, Wischhofstr. 1-3, 24148 Kiel, Germany 2 Christian-Albrechts-Universität zu Kiel | CAU · Department of Geosciences
3 Department of Earth System Science, Stanford University, 473 Via Ortega, Stanford, CA, 94035 Corresponding author: lvieira@geomar.de (Lúcia H. Vieira)
Abstract
The Chukchi Sea is a primary site for shelf-ocean exchange in the Arctic region and modifies Pacific-sourced water masses as they transit via the Bering Strait into the Arctic Ocean. The aim of this study was to use radium and trace metal distributions to improve our understanding of biogeochemical cycles in the Bering and Chukchi Seas, and evaluate their potential response to future changes in the Arctic. We investigated the distributions of dissolved and total dissolvable trace metals (Cd, Fe, Ni, Cu, Zn, Mn, Co, and Pb) in the Bering and Chukchi Seas during spring. In addition, the long-lived radium isotopes (226Ra and 228Ra) were measured as tracers of benthic trace metal inputs.
Trace metal concentrations, especially Fe and Mn, were highly elevated in Chukchi shelf waters compared with the open Arctic Ocean and Bering Strait. Trace metal, nutrient, and Ra patterns suggested that Fe, Mn, and Co
concentrations were predominantly controlled by reductive benthic inputs, whereas the other trace metals were influenced by biological uptake and release processes. We propose that Fe, Mn, and Co in the Chukchi Sea are supplied from shelf sediments during winter overturning, and we combine the 228Ra fluxes with the distributions of Fe, Mn, and Co to provide a first estimate of their benthic fluxes in the region. The average benthic flux of 228Ra was 1.49 x 10⁸ atoms m-2 d-1, which is among the highest rates reported globally. Estimated dissolved Fe (D-Fe) flux from the sediments was 2.5 µmol m-2 d-1, whereas D-Mn and D-Co fluxes were 8.0 µmol m-2 d-1 and 0.2 µmol m-2 d-
1, respectively. The off-shelf transport of D-Fe to the Arctic Ocean is estimated to be about 10-25% of the benthic Fe flux, with the remainder retained on the shelf due to scavenging and/or phytoplankton uptake. Our results highlight the importance of the Chukchi Sea as a major source of the micro-nutrients to the Arctic Ocean, thereby supporting primary production. Long-term changes in factors that affect cross-shelf mixing, such as the observed reduction in ice cover, may therefore enhance shelf nutrient inputs and primary productivity in the Arctic.
Keywords: Trace metals; radium isotopes; sediment input; Arctic Ocean.
1. Introduction
Pacific water inflow forms an important source of freshwater, heat, and nutrients to the Arctic Ocean (Aagaard and Carmack, 1989; Woodgate and Aagaard, 2005; Shimada et al., 2006). Pacific water helps ventilate the Arctic halocline, determine nutrient budgets, and maintain the stratification of the Arctic Ocean (Woodgate et al., 2005). As Pacific-sourced waters pass through the Bering Strait and enter the Arctic Ocean, they are modified by
biogeochemical processes in the Chukchi Sea (Brown et al., 2015; Mills et al., 2015). Remineralized nutrients and resuspended sediment particles from the Bering and Chukchi shelves are entrained in dense bottom water as it flows northward (Cooper et al., 1997; Mathis et al., 2007), contributing to the development of an Arctic nutrient maximum (Jones and Anderson, 1986; Moore et al., 1983; Aagaard et al., 1981), which forms the main source of nutrients for primary productivity in the Arctic Ocean. Since the Bering and Chukchi Seas are along the only pathway of Pacific water to the Arctic, changes in the Bering and Chukchi Seas have profound impacts on the physical and chemical states of Arctic Ocean ecosystems.
Long term climate effects are driving changes in the Bering and Chukchi Seas, such as reduced ice cover (Serreze et al., 2007) and an increase in primary productivity (Arrigo et al., 2008; Arrigo and Van Dijken, 2015), changes in runoff (Peterson et al., 2002; Yang et al., 2002), permafrost thawing (e.g. Hinzman et al., 2005; Romanovsky et al., 2002), increases in groundwater inputs to streams (Walvoord and Striegl, 2007) and increased inflow of Pacific water through the Bering Strait to the Chukchi Sea and wider Arctic Ocean (Woodgate, 2018). These changes may alter chemical budgets and biogeochemical cycles in the Chukchi Sea, with subsequent consequences for Arctic ecosystems. Although changes to the climate are becoming better understood, still little is still known about their consequences for the biogeochemical cycles of trace metals in the oceans. The vertical flux of particulate carbon from surface waters to sediments increases substantially upon phytoplankton blooms in the Arctic, whilst the surface water is still cold and zooplankton growth rates are low (Michel et al., 2006). Increases in carbon export, in turn, stimulate denitrification rates in sediments due to reduced sediment redox potentials, resulting in decreased nitrate concentrations in the water column of the Chukchi Sea (Arrigo et al., 2008). Moreover, the sedimentary trace metal release (e.g. iron (Fe)) into the overlying water column of a North Pacific shelf region was proportional to the input flux of particulate organic matter to the sediments (Elrod et al., 2004). Therefore, climate change effects may be altering Arctic biogeochemistry, and a thorough study of trace metal and nutrient dynamics on the shelf is needed to access potential impacts throughout the region.
A number of studies have evaluated the distributions of dissolved trace metals, chiefly Fe, in the Arctic Ocean. The concentrations of Fe varied considerably between the Arctic basins, with the lowest concentrations observed in the central basin (e.g. Klunder et al., 2012a, 2012b; Thuróczy et al., 2011; Moore, 1983). The few studies in the western Arctic Ocean (Chukchi Sea and Canada Basin), argued that high trace element concentrations in surface waters were due to input from Chukchi shelf sediments, melting sea-ice, and river waters (Cid et al., 2012; Kondo et al., 2016;
Aguilar-Islas et al., 2013). However, because these studies focused on regions beyond the slope boundary between Chukchi Sea and Canada Basin, they may not have captured biogeochemical processes occurring on the Chukchi shelf. A better knowledge of the processes controlling the distributions and cycling of trace metals on the Chukchi
Sea shelf, one of the most productive Arctic shelves, is therefore fundamental for our understanding of trace metal export to the Arctic Ocean.
Organic matter-rich, reducing sediments of the Chukchi Sea shelf (Mathis et al., 2014; Grebmeier et al., 2006) appear to be a major source of trace metals to the water column, mainly Fe, manganese (Mn), cobalt (Co) and aluminum (Al) (Cid et al., 2012). The importance of sedimentary trace metals to primary production relies on their transfer to surface waters, as well as the extent to which they are transported offshore into the halocline layer of the Arctic Ocean. Reducing conditions in the sediments and frequent sediment resuspension events, such as those found in the Chukchi Sea, may influence the magnitude of benthic trace element fluxes. Subsequent delivery of these elements to the Arctic Ocean is controlled by physical transport processes such as advection, wind-driven upwelling and slow ventilation, and the extent to which each element is retained on the shelf is determined by biological uptake and/or scavenging. Similar to trace metals, Ra isotopes (e.g. 228Ra, half-life = 5.75 yr, and 226Ra, half-life = 1600 yr) have a strong benthic source because they are constantly produced by radioactive decay of particle adsorbed thorium isotopes in sediments (232Th 228Ra, and 230Th 226Ra). In contrast to thorium, Ra is soluble in seawater and is released, together with trace metals, from the sediments into the water column by processes such as diffusion, advection, and convective mixing.226Ra is regenerated very slowly in sediments due to its long half-life; in contrast, more 228Ra is produced and released to the overlying waters, related to its shorter half-life. Thus, high 228Ra/226Ra activity ratios indicate recent shelf sediment inputs to the water column. The geochemical behavior and radioactive nature of these nuclides make them powerful tools to investigate the inputs of trace metals to the oceans (e.g.
Charette et al., 2007, 2016; Dulaiova et al., 2009; Sanial et al., 2017).
The present study was part of the “Study of Under Ice Blooms in the Chukchi Ecosystem” (SUBICE) program, whose objectives were to investigate the key determinants of under-ice phytoplankton blooms in the Chukchi Sea.
Our study aimed to investigate the processes that control trace metal and Ra distributions in the Bering and Chukchi Seas, and quantify shelf trace metal fluxes and transport to the Arctic Ocean in order to better understand potential effects of future changes in the Arctic Ocean. First, we describe the distributions of the dissolved and total dissolvable trace metals (cadmium (Cd), Fe, nickel (Ni), copper (Cu), zinc (Zn), Mn, Co, and lead (Pb)), and the radium isotopes 226Ra and 228Ra. Then, we estimate sedimentary fluxes of 228Ra, and, combine these fluxes with the distributions of the redox-sensitive elements Fe, Mn, and Co to estimate their benthic fluxes. To our knowledge, this is the first study to present data of both trace metals and Ra isotopes in the Chukchi Sea during the spring season and to determine their benthic fluxes in the Chukchi Sea.
2. Material and methods 2.1 Hydrography of the study region
The shelf of the Bering Sea is highly productive (Walsh et al., 1989) and commonly divided into 3 main domains based on seafloor depth: inner (~50 m), middle (50 – 100 m), and outer shelf (100 – 180 m) (Fig. 1). During the spring-summer period, the water column structure on the inner shelf is well mixed or weakly stratified, while the middle shelf is two layered; on the outer shelf the upper and lower-mixed layers are separated by a subtle density
interface (Stabeno et al., 1998 and references therein). The surface waters on the continental shelf of the Bering Sea have high Fe and low nitrate concentrations, with sediments forming an important source of micronutrients to the productive area along the continental slope known as the “Green Belt” (Springer et al., 1996; e.g. Aguilar-Islas et al., 2007, 2008, 2013; Hurst et al., 2010; Tanaka et al., 2015; Cid et al., 2011). Phytoplankton in surface waters of the deep basin of the Bering Sea are Fe-limited under high-nitrate low-chlorophyll (HNLC) conditions (Aguilar-Islas et al., 2007).
On their way to the Arctic Ocean, Pacific waters flow through the Bering Strait and Chukchi Sea. In general, the current flow is from south to north across the study region and this transport occurs along three main pathways (Coachman et al., 1975; Weingartner et al., 2005; Corlett and Pickart, 2017). On the eastern side of the inflow is Alaskan Coastal Water (ACW), which is warm, fresh and nutrient-depleted water that flows to the northeast from the Bering Strait into Barrow Canyon, predominantly in summer. On the western side of the inflow is Anadyr Water (AW), cold, salty and nutrient-rich water from the Gulf of Anadyr. The middle branch that passes through the Central Channel contains Bering Sea Shelf Water that is intermediate between ACW and AW in temperature and salinity characteristics. In summer, the Bering Shelf Water and AW combine north of the Bering Strait on the southern portion of the Chukchi shelf to form Bering Summer Water (BSW). Additionally, other water masses are found on the Chukchi shelf such as the cold winter water (near freezing point) known as Newly Ventilated Winter Water (NVWW), and the warmer Remnant Winter Water (RWW) which is the NVWW modified by heating via solar radiation or lateral mixing with summer waters on the shelf. A comprehensive description of the hydrography in our study area during the SUBICE field campaign is given in Lowry et al. (2018) and further details are provided in Arrigo et al. (2017).
Salt rejection during ice formation creates dense brine-enhanced waters that sink to the seafloor in the Chukchi Sea before flowing off the continental shelf into the Arctic Ocean. This surface water is replaced by nutrient-enriched bottom water through convection, thereby mixing the water column. Remineralization in organic-rich Chukchi Sea sediments leads to high benthic nutrient fluxes (Mathis et al., 2014), and convective mixing leads to the formation of a relatively uniform and nutrient-rich water mass throughout the Chukchi Sea (Arrigo et al., 2017), known as the NVWW described above. The water column mixing that occurs throughout the winter (Woodgate and Aagaard, 2005) makes the Chukchi Sea one of the most productive Arctic shelves when the sea ice retreats in late spring and early summer (Hill and Cota, 2005).
2.2 Sample collection and analysis
Seawater samples for trace metal and Ra isotope analysis were collected during the SUBICE field campaign, from 13 May to 24 June 2014, onboard the research vessel U.S.C.G.C. Healy. For trace metal profiles, 44 hydrographic stations were sampled in the Chukchi Sea and 7 surface water samples in the Bering Sea (Fig. 1; see supplementary material Table S1); in addition, a total of 69 surface water samples for Ra isotopes were collected (Fig. 2). The sampling and analytical methods are described below.
Figure 1: Stations in the Bering and Chukchi Seas sampled for trace metals. The stations sampled in the main flow path discussed in Figure 3 are indicated by red circles. The black square indicates the location of the station S3 in Nakayama et al. (2011) used to estimate the off-shelf D-Fe flux into the Canada Basin. Fish 1-7 represent the stations sampled using a trace metal clean towed fish. Water depth (m) is indicated by color coding.
2.2.1 Trace metals
In the open waters of the Bering Sea, we conducted surface water sampling up to the sea ice edge using a trace metal clean towed fish. In the ice-covered area, mostly in the Chukchi Sea, the samples were obtained using acid-cleaned PVC hose that was manually deployed at the starboard side of the vessel, lowered to specific depths (12-15 m, 20-25 m, 35 m and 40-50 m, preferentially). Seawater was transferred using a Teflon diaphragm pump (ALMATEC A15) into a shipboard clean laboratory container. Trace metal samples were collected in low density polyethylene (LDPE) 125 mL bottles, that had been rigorously acid-cleaned as described in Achterberg et al. (2001). Dissolved trace metal (D-TM) samples were filtered through an acid washed inline filter cartridge (0.2 µm pore size filter, Sartobran- Sartorious P-300), whereas total dissolvable (TD) TM samples were collected without filtration. Immediately after sample collection, the samples were acidified to pH 1.9 (0.01 M) using concentrated HCl (OPTIMA, Fisher
Scientific). All sample preparation was conducted in a HEPA-filtered Class 100 laminar flow clean area inside a clean laboratory container. The samples were stored double-bagged for >12 months. The TD-TM concentrations measured in acidified unfiltered samples include both the dissolved fraction and a leachable fraction of the particulate pool.
The concentrations of dissolved and total dissolvable trace metals (i.e. Cd, Fe, Ni, Cu, Zn) were determined by isotope dilution, whereas the method of standard addition was used for Mn, Co, and Pb. Metals were preconcentrated using an automated system (SeaFAST, ESI) with subsequent analysis using a high resolution inductively coupled plasma-mass spectrometer (HR-ICP-MS; Thermo Fisher Element XR) (Rapp et al., 2017). For the preconcentration step, we used 10 mL of sample for D-TM analysis and 4 mL for TD-TM analysis. Briefly, the samples were spiked with an isotopically-enriched multi-element solution containing 111Cd, 57Fe, 62Ni, 65Cu, and 68Zn. The concentrations of Cd, Fe, Ni, Cu, and Zn were calculated following the standard isotope dilution equation described in de Jong et al.
(2008). Similarly, a standard addition working solution containing Co, Mn, and Pb was prepared by dilutions of individual stock standards (CertiPur, Merck), and calibrations were performed by standard additions to every 10th sample. Their concentrations were calculated based on linear regressions of the sequentially-spiked sample, i.e. the mean slope, from one standard addition run before and one after the sample, was used for sample to calculate the concentrations of Co, Mn, and Pb. Theaccuracy and precision of the method were evaluated by analyzing SAFe (D1) reference seawater (Bruland, 2009) (see supplementary materials Table S2).
2.2.2 Radium isotopes
The long-lived Ra isotopes (228Ra and 226Ra) were extracted from 200 L of surface seawater collected from 7 m depth either from the ship’s seawater intake or from Niskin bottles attached to the CTD rosette frame. We ensure that the seawater collected from the ship’s intake was not contaminated by thorium isotopes and the pipes did not contribute additional Ra to the sampled seawater (Charette et al., 2007), as we compared samples collected from the intake line with water collected from the CTD at selected stations (n = 4, see supplementary material Table S3). After
collection, seawater was slowly pumped from the drums over a single column filled with MnO2-coated acrylic fiber (Mn-fiber) at a flow rate of <1 L min-1. The Mn-fiber was then rinsed with Ra-free tap water, dried, and stored for land-based isotope analysis.
In the laboratory, 226Ra and 228Ra were removed from the Mn-fiber via a chemical leach followed by co-precipitation with BaSO4. Briefly, the fiber was boiled in 6 M HCl, until bleached white but otherwise intact, then rinsed with 1 M HCl, and vacuum-filtered through a glass fiber filter (Whatman GF/F 47 mm). Radium present in the filtrate was co- precipitated with BaSO4 and stored in a 1 mL vial sealed with Parafilm (Moore et al., 1985). Since Ra is tightly bound in the crystal lattice of BaSO4, Parafilm is only used to avoid loss of sample material (Michel et al., 1981).
Precipitates were stored at least 3 weeks before analysis to allow 222Rn to grow into equilibrium with 226Ra. Radium activities were then measured by gamma spectrometry using a high-purity, well-type germanium detector (HPGe).
The 226Ra activities were determined using the 214Pb peak (352 keV) and 214Bi peak (609 keV), and 228Ra activities were determined using the 228Ac peak (911 keV). To confirm that the leaching procedure quantitatively removed Ra
from the fibers, six leached bulk fiber remains were ashed at 600°C for 48 h, and analyzed by gamma spectrometry.
Ra activities close to the background and blank values in the leached fiber ash confirm ~ 95 % (1-σ) extraction efficiency of Ra using this leaching procedure (Table S4). Blank fibers (the same amount of fiber as used for the sample collection) were leached and analyzed as described for the samples. Sample activities were corrected for detector backgrounds and fiber blank activities. The detector efficiency was determined by measuring Mn-fibers spiked with known amounts of 228Ra and 226Ra. The Ra spike solution was provided by the International Atomic Energy Agency (IAEA), and had a reported activity accuracy of 6.3% for 226Ra and 5% for 228Ra. Measurement precision for standards between 2 and 30 dpm for 228Ra and between 5 and 50 dpm for 226Ra was ~ 1% (1-σ).
3. Results and Discussion
3.1 Distribution of trace metals and radium isotopes in the Bering Sea
During the study period, the Bering Sea was ice-free up to the vicinity of St. Lawrence Island (north of station Fish 7; Fig. 1). Further north, the study domain was ice-covered (see Fig. S1). Surface water temperature and salinity decreased from Fish 1 (T 6.73°C and S 31.2) to Fish 7 (T 1.22°C and S 30.3). In the Bering Strait surface temperature was ~ -0.47°C and S 31.4. Details on water column stratification and other hydrographic data are not available for those stations.
In the Bering Sea, Fe, Mn, Zn, and Pb existed mainly in the leachable particulate phase (LP-) (calculated here as the difference between TD-Metal and D-Metal concentrations), while Cd, Ni, Cu and Co were largely found in the dissolved phase. Trace metal concentrations and Ra activities were low close to the Aleutian Islands (e.g. D-Mn = 4.69 nM and TD-Mn = 7.69 nM). The D-Fe concentrations at the outer shelf stations, Fish 1 (0.77 nM) and Fish 2 (1.8 nM), were somewhat higher in comparison to 0.1 – 0.9 nM reported by Aguilar Islas et al. (2007), Aguilar Islas et al. (2008) and Hurst et al. (2010) during the summer. However, the current study was conducted in mid-spring, when the phytoplankton communities had likely not yet depleted micronutrients.
Concentrations of trace metals and Ra isotopes increased northwards to the Bering Strait (e.g. D-Mn = 15.2 nM and TD-Mn = 31.4 nM). This is likely due to the shallower water depths, with benthic derived trace metals and Ra reaching surface waters through turbulent mixing, and the influence of frontal processes at the shelf breaks between outer/middle and middle/inner shelves causing vertical mixing of metal-and Ra-enriched deeper waters.
Enhanced D-Zn (1.99 nM), D-Cd (0.53 nM), D-Ni (8.55 nM), and D-Cu (8.21 nM) concentrations were observed in surface waters of the northern middle shelf/inner shelf boundary region (Fish 5; Fig. 1), relative to the southern stations Fish 1-4. The lowest Ra activities in the Bering Sea were found on the middle shelf (4.75 dpm/100 L for
226Ra and 1.64 dpm/100 L for 228Ra; Fish Ra 1). On the northern inner shelf between Fish 6 and the station in the Bering Strait, trace metal concentrations were relatively high and variable (D-Fe: 2.66 – 6.87 nM; D-Ni: 3.65 – 6.71 nM; D-Cu: 3.24 – 7. 17 nM; D-Mn: 4.67 – 15.2; D-Cd: 0.22 – 0.30 nM; D-Pb: 0.002 – 0.009 nM; D-Co: 0.34 – 0.45 nM).
The highest concentrations of trace metals were observed inner shelf ice-free waters (Table 1 and S1; Fish 7) with D- Fe and TD-Fe concentrations of 6.87 nM and 707 nM, respectively. The station 70 km from St. Lawrence Island (Fish Ra 3; Fig. 2) was located near Norton Sound (Fig. 1) and 200 km off the Yukon River delta, where the highest
228Ra activity (11.8 dpm/100 L) was observed. The Yukon River plume is unlikely to be the source of trace metals and Ra at those stations at the time of our sampling, as our sample collections in the Bering Sea occurred in May, prior to peak discharge (Yang et al., 2014).
Figure 2: Distribution of 228Ra/226Ra activity ratio (AR) in surface waters of the Bering and Chukchi Seas and Bering Strait. Fish Ra 1-3 represent the stations sampled for Ra using a trace metal clean towed fish.
3.2 Distribution of trace metals and radium isotopes in the Chukchi Sea
The weakly stratified water column of the Chukchi Sea was almost exclusively composed of near freezing NVWW (excluding the stations beyond the shelf break and those north of the Bering Strait), with a mean T -1.65°C and S 32.2. In the incoming waters, north of the Bering Strait, the Bering Summer Water (BSW) was prevalent. Beyond the shelf break, the water column was composed mostly of RWW, which was highly stratified due to a shelf break front separating the NVWW on the shelf from the warmer and fresher water over the slope (Lowry et al., 2018) (see isopycnals in Fig. 3). Sample collection (May-June 2014) in the Chukchi Sea occurred prior to the major
phytoplankton bloom and melt pond formation, within extensive sea ice coverage where leads of open water in the sea ice were prevalent (Lowry et al., 2018).
Dissolved Fe ranged from 1.45 to 46.3 nM (average: 4.71 nM), and D-Mn varied from 2.94 to 59.6 nM (average:
15.5 nM). For TD-Fe and TD-Mn, the concentrations ranged from 6.05 nM to 4.71 µM (average: 552 nM) and 7.23 to 123 nM (average: 38.2 nM), respectively (Table 1). These metals existed mainly in a leachable particulate form, which represented >98% of TD-Fe and ~60% of TD-Mn (Table 1). TD-Pb was also predominantly in the leachable particulate form, which accounted for ~80% of TD-Pb. In contrast, Cd, Ni, Co, and Cu existed mainly in the dissolved form, and 50% of TD-Zn was found as leachable particulates.
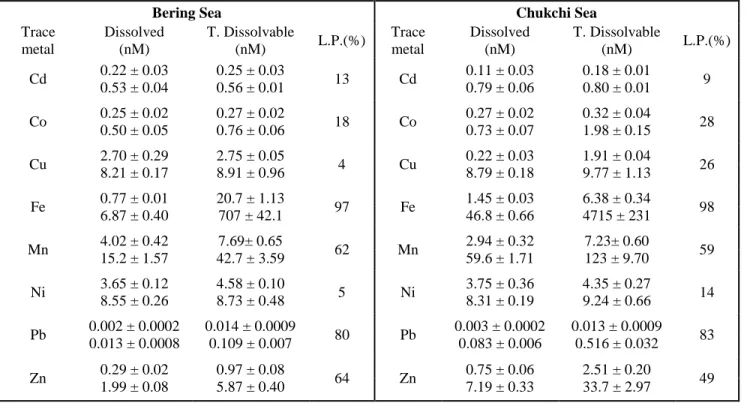
Table 1: Minimum and maximum concentrations of dissolved and total dissolvable trace metals (standard deviations 1 σ), with average percentage of the leachable particulate phase (L.P.) observed in the Bering Strait and Chukchi Seas. All samples and depths are included.
Bering Sea Chukchi Sea
Trace metal
Dissolved (nM)
T. Dissolvable
(nM) L.P.(%) Trace metal
Dissolved (nM)
T. Dissolvable
(nM) L.P.(%) Cd 0.22 ± 0.03
0.53 ± 0.04
0.25 ± 0.03
0.56 ± 0.01 13 Cd 0.11 ± 0.03
0.79 ± 0.06
0.18 ± 0.01 0.80 ± 0.01 9 Co 0.25 ± 0.02
0.50 ± 0.05
0.27 ± 0.02
0.76 ± 0.06 18 Co 0.27 ± 0.02
0.73 ± 0.07
0.32 ± 0.04 1.98 ± 0.15 28 Cu 2.70 ± 0.29
8.21 ± 0.17
2.75 ± 0.05
8.91 ± 0.96 4 Cu 0.22 ± 0.03
8.79 ± 0.18
1.91 ± 0.04 9.77 ± 1.13 26 Fe 0.77 ± 0.01
6.87 ± 0.40
20.7 ± 1.13
707 ± 42.1 97 Fe 1.45 ± 0.03
46.8 ± 0.66
6.38 ± 0.34 4715 ± 231 98 Mn 4.02 ± 0.42
15.2 ± 1.57
7.69± 0.65
42.7 ± 3.59 62 Mn 2.94 ± 0.32
59.6 ± 1.71
7.23± 0.60 123 ± 9.70 59 Ni 3.65 ± 0.12
8.55 ± 0.26
4.58 ± 0.10
8.73 ± 0.48 5 Ni 3.75 ± 0.36
8.31 ± 0.19
4.35 ± 0.27 9.24 ± 0.66 14 Pb 0.002 ± 0.0002
0.013 ± 0.0008
0.014 ± 0.0009
0.109 ± 0.007 80 Pb 0.003 ± 0.0002 0.083 ± 0.006
0.013 ± 0.0009 0.516 ± 0.032 83 Zn 0.29 ± 0.02
1.99 ± 0.08
0.97 ± 0.08
5.87 ± 0.40 64 Zn 0.75 ± 0.06 7.19 ± 0.33
2.51 ± 0.20 33.7 ± 2.97 49
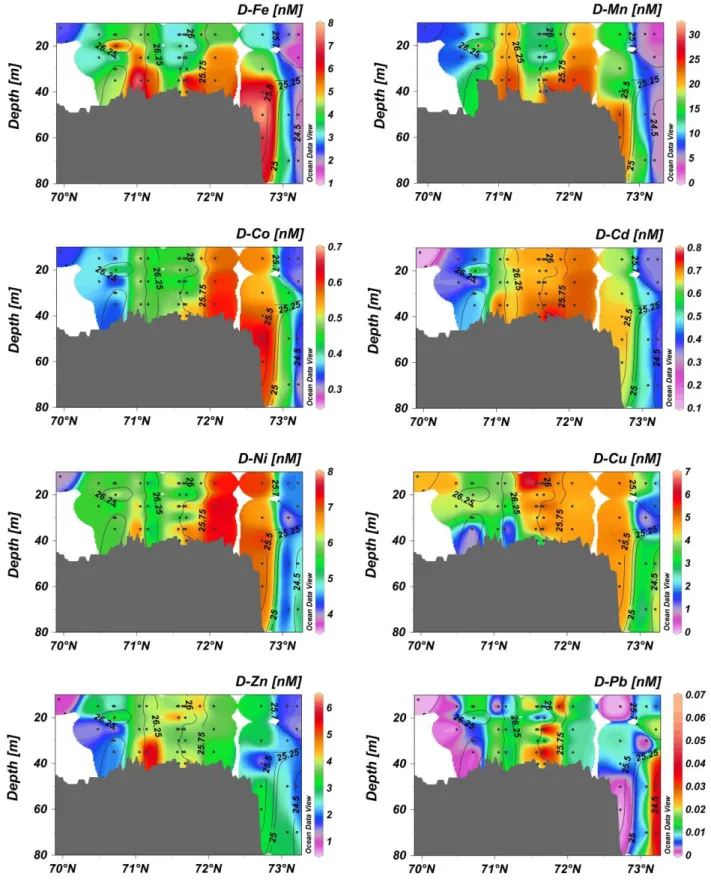
The Pacific water entering the Chukchi Sea as the BSW and the RWW beyond the shelf break were depleted in trace metals (and Ra), while over most of the Chukchi shelf their concentrations were elevated at all depths. Dissolved Fe, D-Cd, D-Co, D-Ni, D-Cu, and D-Mn were ~1.5 – 2 fold higher on the Chukchi shelf, while D-Pb and D-Zn were ~4 times higher than in the Bering Sea. Sections of dissolved TM concentrations are shown in Fig. 3 for stations in the Central Chukchi Sea to the shelf break parallel to the dominant currents (stations in red in Fig. 1). A depletion of all TM at stations beyond the shelf break (except D-Pb, which shows some elevated concentrations off-shelf) is shown in Fig. 3. Elevated levels of trace metals were found in near-bottom waters, (5-7 m above the seafloor) suggesting a sediment source.
Sediment and pore water resuspension is likely to occur in the shallow Chukchi Sea due to convective mixing caused by winter overturning. Thus, pore water release and desorption from resuspended sediment particles are likely sources of trace metals to bottom waters. Furthermore, refreezing leads were found throughout the study area and, as
a result of brine rejection, the water column can become fully mixed in less than 9 hours (in some cases in less than 1 hour) (Pacini et al., 2016; Lowry et al., 2018), stirring trace metals, Ra and nutrients from the bottom waters into the surface layers. The enhanced 228Ra activities, and consequently high 228Ra/226Ra ARs (1.1 < AR < 2.8; Fig. 2) indicate benthic inputs to the water column. Furthermore, remineralization of organic matter in sediment consumes oxygen first, followed by nitrate and then Fe and Mn reduction (Lohan and Bruland, 2008). Reduced Fe (II) and Mn (II) produced in sediments are mobile and diffuse into to the oxygenated bottom water, where they are oxidized to their less soluble forms, Fe (III) and Mn (IV). Oxidized colloidal Fe and Mn, and particulate Fe oxyhydroxide and Mn-oxides, can be removed from the water column by particulate scavenging and sinking (Lohan and Bruland, 2008). Oxidizing bacteria play an important role in Mn oxidation (Sunda and Huntsman, 1988). The oxidation processes are consistent with the low D-Metal/TD-Metal ratios measured in the current study for Fe (0.00067 – 0.22) and Mn (0.14 – 0.81), indicating that these metals were mainly in leachable particulate phases. Cobalt, in turn, is readily scavenged by Fe or Mn-oxide phases, and is released into solution when the oxides undergo reductive dissolution (Moffet and Ho, 1996).
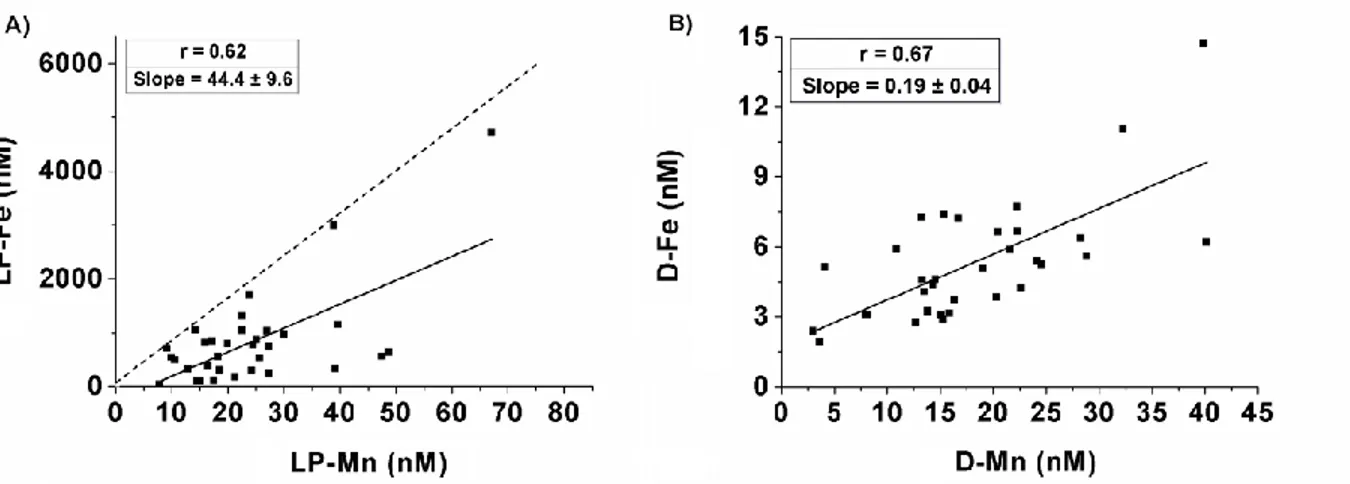
In addition to the reductive supply of Fe (II) and Mn (II) from shelf sediments, resuspended sediments tend to have elevated Fe and Mn content. Strong negative correlations were observed between transmission and the TD-Fe (r = 0.86; n = 34) and TD-Mn (r = 0.74 n = 34) (data not shown), suggesting coinciding Fe and Mn inputs from particle resuspension. Trefry et al. (2014) observed Fe/Mn ratios in surface sediments of the Chukchi Shelf of 82.6 ± 33.5 (their Table 3); in near-bottom waters, we found a similar LP-Fe/LP-Mn ratio of 44 ± 9.6. The difference in ratios between sediment (dashed line in Fig. 4A) and suspended particles in bottom waters (black line in Fig. 4A) indicates an excess of LP-Mn relative to LP-Fe in near-bottom waters. This could be because Fe and Mn are released from pore water and resuspended sediment particles, likely in their dissolved form, but they are transferred to their leachable particulate forms and/or are removed from the water column at different rates. Because the Fe/Mn ratio is so much lower in the dissolved phase (0.19 ± 0.04) than in the leachable particulate phase (44 ± 9.6) (Fig. 4A and B), there is likely preferential precipitation of Fe. It is possible that more Fe (II) is being released from the sediment relative to Mn (II), but Fe oxidizes faster to Fe (III) in the well-oxygenated bottom waters (O2 ~355 µmol kg-1) and precipitates rapidly; while Mn, because of its slower oxidation rate, persists longer in the dissolved phase (Stumm and Morgan, 1981). Indeed, the slow oxidation kinetics of Mn greatly reduces the net formation of Mn oxides (Sunda and Huntsman, 1988). This is consistent with the lower D-Fe/D-Mn (0.07 ± 0.03) and LP-Fe/LP-Mn (12.2 ± 3.17) ratios found in surface waters relative to bottom waters (0.19 and 44, respectively). A recent study reported that, during periods of sediment resuspension, the D-Fe released from sediment pore water via diffusive processes rapidly adsorbs onto particles, and that inputs of suspended particles to overlying waters leads to rapid scavenging of D-Fe into its leachable particulate phases (Homoky et al., 2012). This is consistent with the large amount of LP-Fe found in our study (Table 1) and the frequent sediment resuspension episodes observed during the SUBICE campaign.
The high concentrations of dissolved and leachable particulate Fe found in surface waters of the shallow shelf of the Bering Sea (see Table 1) are also related to the benthic supply processes. Hurst et al. (2010) showed that LP-Fe averaged 81% of the total particulate Fe in the bottom waters of the Bering Sea, and suggested that elevated flux of reduced Fe at the sediment-bottom water interface and its subsequent oxidation and precipitation could lead to the
formation of elevated concentrations of LP-Fe.
Figure 3: Sections of dissolved trace metals (in nM) along main flow path of Pacific-origin waters. Iso-contours represent potential density (kg m-3). Stations along this transect are marked in red in Figure 1.
Figure 4: Plots of Mn versus Fe in deep waters of the Chukchi Sea in their leachable particulate (LP) form (A) and dissolved (D) form (B). The dashed line in (A) presents Fe/Mn ratio in the sediments of the Chukchi Shelf found in Trefry et al. (2014).
Interestingly, we observed a strong positive correlation between LP-Fe and LP-Pb in near-bottom waters (r = 0.97, n
= 34) (Fig. S2 A) as well as between LP-Fe and LP-Co (r = 0.92; n = 34) (Fig. S2 B), while there was no close correlation between their dissolved forms (Fig. S2 C and D). In contrast, the relationships between LP-Mn and LP- Pb, as well as between LP-Mn and LP-Co, were weaker (r = 0.67 n = 34 and r = 0.81 n = 34, respectively) (Fig. S2 E and F), suggesting that Pb and Co are preferentially scavenged by Fe-oxides, although Co is considered to be incorporated into Mn-oxides through the co-precipitation by manganese oxidizing bacteria (Moffet and Ho, 1996).
The enhanced D-Pb and LP-Pb concentrations observed near the seafloor may indicate a sedimentary Pb source to the overlying waters (Noble et al., 2015). Although the biogeochemical processes that control benthic Pb release are poorly known, studies have suggested that anthropogenic Pb supplied to the water column may be scavenged onto Fe-Mn oxides to the sediments, and their subsequently reductive dissolution allows the diffusive benthic input of Pb into the water column (Noble et al., 2015; Rusiecka et al., 2018).
Copper existed mainly in dissolved form, unlike Fe, Mn, and Pb. Dissolved Cu may also have a benthic source under moderately reducing conditions (Heggie, 1982), but in highly reducing shelf sediments, such as found in the Chukchi Shelf, Cu may form inorganic sulfide compounds and precipitate, limiting its benthic source under very low O2 conditions (Biller and Bruland, 2013). This could explain the distinct distribution of Cu relative to Fe, Mn and Co in our study (see Fig. 3 and PCA results, below).
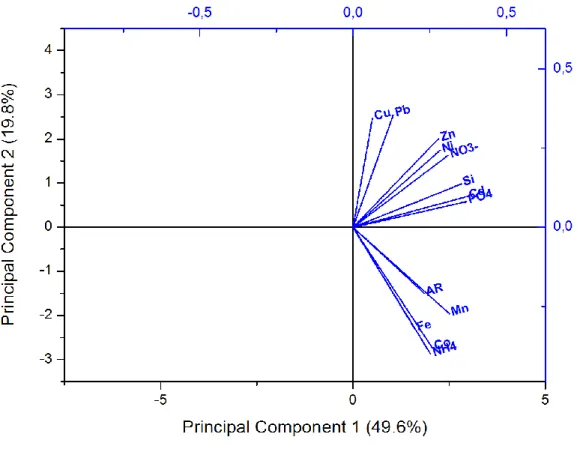
Principal Component Analysis (PCA) was performed to clarify relationships among the different constituents in the Chukchi Sea (Fig. 5). Only data from the surface waters of the Chukchi Sea were considered in the PCA to allow inclusion of Ra isotopes, as they were collected only in surface waters. The PCA shows that the TMs, nutrients, and Ra fall clearly into two separate groupings. The TMs such as Cu, Pb, Zn, Ni, Cd in surface waters were associated with the major macronutrients (Fig. 5), suggesting that phytoplankton uptake/surface adsorption and remineralization were the main factors controlling their distribution in this region. Fe, Mn, Co, Ra, and NH4+ grouped separately, suggesting that their distributions were strongly influenced by a common source, most likely sediments, as discussed above for Fe and Mn. See supplementary material (Table S5) for details of the variance on the principal components.
Previous studies also reported enhanced NH4+ in bottom waters of the Chukchi Sea shelf and slope regions (Wang et al., 2006; Connelly et al., 2014). The high primary production over the shallow shelf of the Chukchi Sea likely leads to a high flux of organic carbon to the seafloor (Grebmeier et al., 2006), and NH4+ produced by remineralization in sediments is released to the overlying waters (Brown et al., 2015).
Figure 5: Principal component analysis (PCA) plot that characterizes the trends exhibited by dissolved trace metals, nutrients and
228Ra/226Ra ratios in surface waters of the Chukchi Sea. 228Ra/226Ra ratios are referred here as Activity Ratios (AR).
Dissolved Cd and phosphate showed a moderate correlation (r = 0.77; Fig. S3 A) with the following equation: [D-Cd nM] = 0.36 [PO4 µM] - 0.038, n = 97. This agrees closely with previous work in the Chukchi and Beaufort Seas (Cid et al., 2012) and the North Pacific (Bruland et al., 1980). In those studies, dissolved Cd and phosphate were related according to: [D-Cd nmol kg–1] = 0.33 [PO4 µmol kg–1] + 0.050, r = 0.62 (Cid et al., 2012); and [D-Cd nmol kg–1] = 0.347 [PO4 µmol kg–1] - 0.068, r = 0.99 (Bruland et al., 1980). The observed Cd/phosphate relationship is consistent with replete levels of D-Fe that are not limiting primary production (Cullen, 2006). Dissolved Zn and silicate showed no correlation (Fig. S3 B). Dissolved metals involved in biological cycles (Cd, Cu, Ni, and Zn) typically follow the profiles of the major macronutrients in the open ocean, but showed a nearly uniform vertical distribution in the current study (Fig. 3), due to a vertically well-mixed water column. The D-Co distribution appears visually similar to the latter elements, but the PCA results (Fig. 5) shows that its distribution matches better with D-Fe and D-Mn. The more uniform Co distribution may be because Co is transported farther from the sediments than reduced Fe and Mn before it is removed by particulate scavenging and precipitation (Heggie and Lewis, 1984; Moffet and Ho, 1996).
The PCA suggests that, like D-Mn and D-Fe, D-Co is released from the sediments, but it remains longer in the water column and can be easily transported to surface waters, which could explain its nearly uniform distribution.
The 226Ra activities measured in in the Chukchi Sea varied from 4.68 ± 0.41 to 10.9 ± 0.94 dpm/100 L (average: 7.83
± 1.69 dpm/100 L), while 228Ra activity presented a broad range of 4.49 ± 0.22 to 24.4 ± 1.16 dpm/100 L (average:
15.6 ± 4.39 dpm/100 L). The distribution of the 228Ra/226Ra activity ratios (AR) (Fig. 2) shows high AR over most of the shelf, where stratification was weak or nonexistent due to convective mixing. Because of the shallow bathymetry of Chukchi Sea, convective mixing can also lead to sediment and pore water resuspension, with subsequent supply of
228Ra. Furthermore, sediment type plays an important role in the amount of 228Ra delivered to the water column, and variations in water column Ra activities may reflect differences in the underlying sediments (see section 3.3).
Based on the spatial distribution of 228Ra/226Ra, the Chukchi Sea shelf can be divided into four sections (Fig. 2). The northwest and southeast sections (NW and SE) presented high 228Ra/226Ra ratios ranging from 2.0 to 2.8 (average = 2.25; n = 27). The lowest 228Ra/226Ra ratios, ranging from 1.1 to 2.5 (average = 1.91; n = 26), were observed in the southwest section (SW), as well as beyond the shelf break in the northeast sections (NE). The SW section in our study was mostly sampled at the end of the cruise when the NVWW water mass was being replaced by Pacific summer water containing low 228Ra. The cross-shelf station in the NE section appeared to be composed mostly of the highly stratified RWW. The low 228Ra value beyond the shelf break is consistent with low activities previously observed in surface water at this site and further north (Kadko and Muench, 2005). The 228Ra gradient observed in the NE section may indicate Ra removal (see section 3.4) or mixing between the 228Ra enriched NVWW and RWW within the shelf break front. Furthermore, the water that exits the Chukchi Shelf is denser relative to the near-surface water on the slope in the boundary between Chukchi Sea and Canada Basin, and tends to sink below the surface slope water (Stabeno et al., 2018). Enhanced Ra activities were observed by Kadko and Muench (2005) at depth from 75 to 200 m compared to the surface waters on their cross-shelf transects. Moreover, due to the stratification of the water column, the absence of newly injected 228Ra from bottom waters to the surface could also explain the lower activities in surface waters in this region. In contrast, within the same NE section, stations located on the shelf exhibited high 228Ra/226Ra, elevated trace metal concentrations (Fig. 3) and a fully mixed water column, suggesting that convection likely increased 228Ra activities and trace metal concentrations in the surface waters of these stations.
Furthermore, a strong shelf break signal was observed at these stations (Fig. 3), where the difference in density at the edge of the shelf between the NVWW and RWW supports a bottom-intensified shelf break jet (Mathis et al., 2007).
3.2.1 Other potential sources and sinks of trace metals and Ra isotopes in the Chukchi Sea
Melting ice has been identified as an important source of trace metals, especially Fe, to polar surface ocean waters (Lannuzel et al., 2007; Aguilar-Islas et al., 2008; Measures, 1999; Tovar-Sanchez et al., 2010). Sediment
resuspension events are rather common in the Chukchi Sea, and sediment particles can be incorporated into the ice during frazil ice formation (Eicken et al., 2005). Release of sediment and brines from the melting ice may
consequently contribute metals to surface waters in spring. Most of the study region was covered by 1.0 – 1.5 m of sea ice and 0.02 – 0.15 m of snow (Arrigo et al., 2017), with ice concentrations around 80 – 95% (Fig. S1). The high ice cover suggests that melting sea ice was unlikely to be a major source of trace metals for most of the study region,
although some dissolved metal release can begin during early ice melt (van der Merwe et al., 2011). In the coastal ice zone, however, melting ice might have contributed additional trace metals to surface waters, since enhanced
sediment entrainment into the sea ice and advanced melting at the end of sampling period were observed in this region (Fig. S1). The station nearest to shore presented the highest concentrations of trace metals, especially D-Fe, D-Mn, and D-Ni. This region was occupied twice, once on 19-21 May and again in 8 June. During the first occupation, sea ice covered ~80% of the coastal area and trace metals in surface waters were lower than those observed during the second occupation. The mean dissolved Fe, Mn, and Ni concentrations on the first occupation were 4.38 nM, 12 nM, and 7.02 nM, respectively, while 228Ra activity was 11.6 dpm/100 L. On the second
occupation, the sediment-laden ice had mostly melted, and ice concentration decreased to ~25% (Fig. S1); the water column was stratified and D-Fe, D-Mn, and D-Ni concentrations and 228Ra activity in the surface layer had increased to 46.3 nM, 59.6 nM, 8.31 nM, and 24.4 dpm/100 L, respectively. After the ice melt, D-Mn was five times higher and D-Fe increased by an order of magnitude. Indeed, sea ice can accumulate Fe at concentrations one to two orders of magnitude higher than the under-ice seawaters, and release Fe to surface waters during its melting in a matter of weeks (Breitbarth et al., 2010 and reference therein). Activity of 228Ra varied by 12.8 dpm/100 L in this region. The
228Ra content of melting ice of the Chukchi Sea is on the order of 0.55 dpm/L (Kipp et al., 2018). Given the observed salinity decrease from 32.7 to 29.9 at this station, an input of 228Ra from the melting waters using the Kipp et al.
(2018) numbers would have been only 4.72 dpm/100 L, or about 20% for the most nearshore station, suggesting that melting ice was not a significant source of 228Ra. However, the reported value of 0.55 dpm/L from Kipp et al. (2018) may be underestimated, as they estimated 228Ra activity using sediment in melted sea ice collected late in the season, when sea ice had warmed and may have already lost chemical- and particle-rich brines. Nonetheless, Ra behavior during brine formation would likely mirror that of sea salts, and would be enriched in brines proportional to seawater salinity (Loose et al., 2017). Thus, it seems unlikely that such processes could enhance the ice source sufficiently to explain the increase in dissolved Ra, and a substantial portion of the Ra and trace metal increase is therefore due to benthic input.
Atmospheric deposition and river runoff can represent important sources of trace metals to the ocean. However, extensive ice-cover during the current study would have prevented appreciable aerosol deposition reaching the surface waters. The major contribution of riverine water in the Chukchi Sea comes from the Yukon River on the northern Bering Sea shelf (Fig. 1). Its freshwater and terrestrial materials are transported by the Alaskan Coastal Current northward into the Chukchi Sea (Iken et al., 2010; Baskaran and Naidu, 1995; Stabeno et al., 2016).
However, no clear low salinity signal from the Yukon was observed and the lower concentrations of trace metals found in the southern portion of our study domain (Fig. S4) suggest a limited contribution of the Yukon River in the Chukchi Sea at the time of our sampling. This may be because the peak discharge occurs from early to late June (spring flood period) (Yang et al., 2014), i.e. one month after our sampling in the Bering Strait. Moreover, because of the lower Ra activities found in the Bering Sea (in the vicinity of the Yukon River mouth), the Bering Strait, and southern portion of the Chukchi Sea (Fig. 2), it is also unlikely that the Yukon River contributed to the elevated Ra signals observed on the Chukchi shelf.
3.3 Trace metals fluxes derived from 228Ra
Benthic inputs on the Chukchi shelf supplied dissolved 228Ra to the inflowing waters from the Bering Sea, increasing activities by approximately a factor of two to three. In order to determine the magnitude of the fluxes that are required to sustain the observed enrichment, excess 228Ra activities were obtained at each station on the Chukchi shelf by subtraction of the average activities found in the Bering Strait and in the southern portion of our study domain (7.35 dpm/100 L) from the observed activities. The inventory of excess 228Ra (I, atom m-2) was determined using the water depth (m) at each station. A uniform distribution of 228Ra in the water column was assumed given the observed extensive vertical mixing and lack of stratification (Lowry et al., 2018), and these inventories therefore represent lower limit estimates. The stratified station localized beyond the shelf break, as discussed in section 3.2, was excluded from our calculations. The excess 228Ra inventory (I) ranged from 0.40 ± 0.09 x 10¹⁰ to 3.87 ± 0.18 x 10¹⁰ atoms m-2 (average = 1.81 ± 0.82 x 10¹⁰ atoms m-2). However, the inventory determined here based on surface
228Ra activities does not consider seasonal variations in the Ra supply to surface waters. Nonetheless, as the water column was actively overturning during our survey and experienced convective mixing throughout the winter, we assume that the inventory of 228Ra was relatively constant over the months prior to our sampling.
Assuming sediments are the primary source of Ra to the water column, a steady state flux of Ra from sediments (Jseds) was balanced by loss due to exchange with low Ra waters off-shelf (Jexchange) and radioactive decay (Jdecay) (e.g., Moore et al., 1995). The residence time (τ) of Pacific water in our study domain is ~4 months (Arrigo et al., 2017; Woodgate, 2018), giving a water exchange rate (K) of 0.008 d-1. Hence, the flux of 228Ra is therefore given by:
Jseds = Jdecay + Jexchange = λI + KI (1)
where λ is the decay constant of 228Ra. However, because the half-life of 228Ra is long relative to the residence time of water in the Chukchi Sea, removal by decay can represent at most only about 4% of the inventory and Jdecay is neglected here. The 228Ra flux is then the inventory multiplied by the water exchange rate (K).
Jseds = J exchange = KI (2)
The sediment 228Ra flux estimated from equation 2 using the average inventory is 1.49 ± 0.71 x 10⁸ atoms m-2 d-1. The mean flux estimated here ranks among the highest reported globally and is similar to that reported for shelf systems such as the Amazon (3.01 x 10⁸ atoms m-2 d-1; Moore et al., 1995); Bega River, Australia (2.27 x 10⁸ atoms m-2 d-1; Hancock et al., 2000); Long Island Sound, USA (1.56 x 10⁸ atoms m-2 d-1; Cochran, 1984); and Narragansett Bay (1.42 x 10⁸ atoms m-2 d-1; Santschi et al., 1979) (Fig. 6). Moore et al. (2008) compiled estimates of sedimentary
228Ra flux, and showed that 228Ra fluxes from fine-grained sediments are 1 – 2 orders of magnitude higher than those found in coarse-grained sediments. They suggested a global average flux of 50 ± 25 × 109 atoms m−2 yr−1 (1.37 x 10⁸ atoms m-2 d-1) for fine-grained sediments and 1.0 ± 0.5 × 10⁹ atoms m−2 yr−1 ( 0.03 x 10⁸ atoms m-2 d-1) for coarse shelf sediments. These literature values were used to calculate benthic fluxes at each station in the current study using the sediment type maps in Trefry et al. (2014) (see supplementary materials Fig. S5). Calculated fluxes ranging from 0.4 - 1.3 × 10⁸ atoms m-2 d-1 show that a completely independent estimate of benthic fluxes matches well with
the average 228Ra flux derived from the water column Ra inventory (1.49 ± 0.71 x 10⁸ atoms m-2 d-1), reinforcing the argument that benthic input is the primary source of 228Ra to the system.
Figure 6: Shelf sediment 228Ra fluxes. Values reported by: Li et al. (1979); Moore et al. (1987); Moore et al. (1995); Cochran (1984); Santschi et al. (1979); Rama and Moore (1996); Crotwell and Moore (2003); Hancock et al. (2000); Hancock et al.
(2006); Hsieh et al. (2013). Most of the data are summarized in Moore et al. (2008).
Several factors can control sedimentary 228Ra fluxes in the marine environment, such as diffusive pore water transport, bioturbation, sediment grain size and mineralogy (particularly non-carbonate sediments contain an enhanced abundance of 232Th (Moore et al., 2008)). Although the sediment texture is quite variable in the Chukchi Sea shelf, silt and clay are dominant in the central Chukchi Basin (Trefry et al., 2014 and references therein).
Overall, muds dominate (64%), with a substantial contribution from sands (31%) and gravel (5%) (Trefry et al., 2014). Marine clays are often enriched in 232Th series radionuclides in comparison to quartz and carbonate-rich marine sediments (Hancock et al., 2006), which could explain the high sedimentary 228Ra flux observed in the Chukchi Sea. Sediment resuspension and Ra desorption contribute to the benthic source. However, assuming a sediment 228Ra activity of 1.1 dpm g-1 and a 32% desorbable fraction (Kipp et al., 2018), a bulk density of 1.5 g cm-3 and 12% annual ingrowth rate, resuspension of sediment to a depth of 1 cm across the entire shelf could support only
~5% of the measured flux. Given that 210Pb profiles in Chukchi Sea sediments indicate that mixing is limited below 1 – 2 cm (Lepore et al., 2009; Baskaran and Naidu, 1995), it is unlikely that sediment resuspension can represent more
than 10% of the benthic 228Ra flux in the Chukchi Sea, suggesting that diffusive release from shelf sediment is the major source of 228Ra to the system.
Because D-Fe, D-Mn, and D-Co in the Chukchi Sea have a benthic source similar to Ra (see section 3.2; Fig. 5), the
228Ra flux can be used to estimate the sedimentary fluxes of these trace metals on the shelf (Table 2). Trace metals fluxes from the sediments were estimated by multiplying the average 228Ra flux from the shelf sediments (derived from equation 2) by the shelf-averaged ratio between D-TM concentrations observed in the near-bottom waters (5-7 m above the bottom) and 228Ra activity (D-TM/228Ra). Trace metal fluxes for the Chukchi Sea derived in this way are within the range of the sedimentary fluxes observed elsewhere (Table 2). For example, the estimated Fe flux in the current study is about 2.5 ± 2.4 µmol m-2 d-1. This compares well with the global range of 2.5 –7.4 µmol m-2 d-1 (Tagliabue et al., 2014; Elrod et al., 2004; Dale et al., 2015). Our estimated Mn and Co fluxes were 8.0 ± 7.1 µmol m-2 d-1 and 0.2 ± 0.1 µmol m-2 d-1, respectively. Benthic Mn fluxes reported elsewhere range between 0.4 (Monterey Shelf, Landing and Bruland, 1987) and 7.9 µmol m-2 d-1 (Oregon/California shelf, McManus et al., 2012). However, unlike Ra, trace metals are taken up by phytoplankton, oxidized and precipitate, and/or are scavenged onto biogenic or lithogenic/sediment particles. Sediment resuspension during the current study may have increased LP-Fe transport on the shelf (section 3.2). Suspended particles may have scavenged a fraction of the D-Fe supplied from reducing sediment as LP-Fe, buffering the concentrations in the water column (Homoky et al., 2012; Milne et al., 2017).
Therefore, if a significant amount of D-Fe released from the sediments was lost by scavenging, our sedimentary D- Fe fluxes may be underestimated given that they were calculated from near-bottom water D-Fe concentrations. This may also explain why the D-Mn flux estimates were much higher than D-Fe fluxes. Mn removal rates from the water column are slower than for Fe, so the original Mn/Ra ratio is more likely to be preserved in bottom waters (see section 3.2). Dale et al. (2015) argued that Fe scavenging rates as inorganic particulates and colloidal aggregates in bottom waters are far higher than previously thought, and the fraction of D-Fe that is scavenged close to the seafloor may be poorly estimated.
Nonetheless, regardless of the D-Fe removal processes described above, D-Fe fluxes in the Chukchi Sea appear to be sufficient to allow for complete consumption of macronutrients, i.e., the replete D-Fe concentrations do not limit primary productivity. The net primary production (NPP) during SUBICE varied from 76.7 to 104 mg C m-2 d-1 (Arrigo et al., 2017). Following the argument of Tanaka et al. (2015), who estimated the Fe consumption in the Green Belt, and equally using Fe:C uptake ratios of 3 – 33 μmol Fe/mol C for coastal diatoms, biological Fe uptake in the Chukchi Sea can be estimated as 76.7 (mg C m-2 d-1)/ 12000 (mg C/mol C) x 3 (μmol Fe/mol C). This gives an estimate of NPP Fe consumption in the Chukchi Sea of ~ 0.02 – 0.27 µmol Fe m-2 d-1, which is well below the mean sedimentary D-Fe flux of 2.5 µmol m-2 d-1 (Table 2). However, this estimate of Fe consumption was based on the NPP rate before the spring phytoplankton bloom, and it may be higher during bloom periods.
3.4 Trace metals and radium transport to the Arctic Ocean
A recent study suggested that the shelf 228Ra fluxes to the Arctic Ocean have risen sharply over the period 2007- 2015, and most of the increase was ascribed to shelf sediment inputs (Kipp et al., 2018). Their surface water 228Ra activities on the Chukchi shelf in summer appeared low (<10 dpm/100 L) compared to our observations, and they
suggested that the 228Ra activities in the Chukchi Sea did not increase during that period. In contrast, the current study observed 228Ra activities in the winter waters of the Chukchi Sea as high as 24 dpm/100 L, levels similar to those reported for the central Arctic (Kipp et al., 2018), Kara and Laptev Seas (Rutgers van der Loeff et al., 1995).
Further field observations in the Chukchi Sea in the summer, two months after our SUBICE cruise (Li et al., 2017), also found lower 228Ra activities (average 9.18 dpm/100 L), supporting the notion that 228Ra activities are lower in summer than in the winter waters. Given a water residence time of four months, by the time of their sampling in the summer season, up to 50% of the Ra-enriched shelf surface water we observed would have been transported off the shelf. As a result, instantaneous water sampling collection may miss (or coincide with) important transport periods, i.e. seasonal and interannual variability in 228Ra inventories may lead to different conclusions about the Chukchi Sea contribution to the overall Ra budget in the Arctic, depending on when samples are collected. One reason for the discrepancy could be because, with the progress of the melting season and consequent stabilization of the water column, convective mixing ceases, diminishing the input of benthic derived Ra to the surface waters. Another reason would be due to biological or scavenging removals of Ra that may play an important role on the Arctic shelves (Rutgers van der Loeff et al., 2012). This is also reflected in the 226Ra activities, which varied by 6.2 dpm/100 L with a minimum activity of 4.68 dpm/ 100L, well below that expected for Pacific surface waters (7-10 dpm/100L) (Chung and Craig, 1980). This suggests a strong potential Ra control by biological cycling, and may be closely linked to the cycling of Ba as observed in other Arctic shelves (Rutgers van der Loeff et al., 2012), and in the Bering Sea (W.S. Moore, personal communication). If the biological removal is indeed important, the Ra benthic fluxes calculated in section 3.3 represent conservatively low values.
The importance of the Chukchi Sea in the off-shelf export of nutrients and trace metals to the Arctic Ocean has recently been reported (Nakayama et al., 2011; Cid et al., 2012; Kondo et al., 2016; Taylor et al., 2013; Aguilar-Islas et al., 2013). The concentrations of D-Fe (1.45 - 46.3 nM) and TD-Fe (6.05 nM – 4.71 µM) observed in our study in the western Arctic Ocean are substantially higher than in the eastern Arctic Ocean. On the shelves of the Barents and Kara Seas, for example, TD-Fe ranged between 6 and 60 nM (Thuróczy et al., 2011), whereas D-Fe concentrations (0.4 – 0.54 nM) were close to that for the slope and open ocean regions (Klunder et al., 2012a, 2012b). The Laptev Sea, although being as shallow as the Chukchi Sea (~50 m) and containing high suspended particle concentrations, has levels of TD- and D-Fe reaching only 20 to 40 nM (Klunder et al., 2012b). Nakayama et al. (2011) suggested that high concentrations of D‐Fe observed within the halocline waters of the shelf, slope and basin regions of the western Arctic Ocean were due to transport from the shallow shelves (≤∼100 m depth) of the Chukchi Sea and Canada Basin (see also Aguilar-Islas et al., 2013). Furthermore, the elevated Ni, Zn and Cd concentrations within the halocline layer in the western Arctic Ocean are reported to come from the Chukchi Sea shelf (Cid et al., 2012; Kondo et al., 2016).
In section 3.3, we determined the areal trace metal flux from sediments (mean D-Fe flux = 2.5 µmol m-2 d-1).
However, as the ecosystem in the central Arctic Ocean strongly depends on the surface water exchange between shelves and central basins, it is important to quantify the off-shelf transport of trace metals into the interior basin.
Previous studies have combined the 228Ra flux with trace metals to determine off-shelf fluxes of trace metals in a range of global ocean regions (see Charette et al., 2016; Dulaiova et al., 2009; Sanial et al., 2017). The shelf D-Fe
flux from the Chukchi Sea to the Arctic Ocean (Flux D-Fe) can then be determined using the 228Ra flux and shelf- enriched D-Fe/Ra ratios, according to Charette et al. (2016).
Flux D-Fe = Flux Ra x [D-Feshelf − D-Feoffshelf
Rashelf − Raoffshelf ] (3)
where Flux Ra is the 228Ra flux over the Chukchi Sea derived from equation 2 (taken as the average flux of 1.49 ± 0.71 x 10⁸ atoms m-2 d-1). D-Feshelf and D-Feoffshelf, as well as 228Rashelf and 228Raoffshelf, are the concentration of D-Fe and 228Ra of the shelf and off-shelf endmembers, respectively. Given that trace metals concentrations in surface waters can be affected by melting ice and river runoff, these shelf and off-shelf values were calculated using the depth-interval weighted average of D-Fe between the surface and 70 m (this study) and 75 m (Nakayama et al., 2011;
black square in Fig. 1), respectively. The D-Fe/Ra ratio in equation 3 takes the difference between the weighted average of D-Fe at the shelf-edge station and (i.e. D-Feshelf = 1.55 nM) and the off-shelf Arctic basin (D-Feoffshelf = 0.66 nM; Nakayama et al., 2011). The D-Fe concentration ranges observed at the shelf-edge station between 15 m and 70 m (1.62 – 1.91nM) matches well with the results of Nakayama et al. (2011) at the same location (their S3 station) and similar depth range (1.08 – 2.24 nM). Furthermore, the upper halocline waters in the Canada Basin are an extension of the Pacific Winter Water that exits the Chukchi Sea shelf. The excess 228Ra activities are calculated as the difference between the mean shelf 228Ra activity (Rashelf = 15.8 dpm/100 L) and off-shelf values (Raoffshelf = 3.3 dpm/100 L; Kadko and Muench, 2005). We considered our initial 228Ra value as the mean activity found on the shelf assuming that 228Ra radioactive decay and particle removal are negligible within the short residence time of water in the Chukchi Sea. Hence, these considerations give a shelf D-Fe input to the Arctic Ocean of ~ 2.5 x 10⁴ mol d-1 (considering our sampling area over the Chukchi Shelf as 400 x 250 km). Given the mean benthic D-Fe flux of ~ 25.2 x 10⁴ mol d-1, this implies that approximately 10% of D-Fe produced on the Chukchi shelf is transported to the Arctic Ocean and the remainder is retained on the shelf by scavenging and/or phytoplankton consumption. This is consistent with previous estimates that 10 to 50% of the shelf sediment-derived Fe flux is transported off the shelf (Siedlecki et al., 2012). However, if there is substantial Ra removal, the shelf-edge may be a more accurate 228Ra endmember, rather than the average of 228Ra activities. In that case, it would suggest 25% export. It is not clear which is the most appropriate endmember, and the phenomena on Ra removal certainly requires further investigation, as the assumption that Ra behaves conservatively has a large impact on the estimates of the trace metals fluxes. Regardless, whilst the Chukchi shelf is not limited by Fe, the input of D-Fe from the shelf to the basin is rapidly attenuated (Aguilar-Islas et al., 2013), and may therefore be an important source for the phytoplankton that accumulate in the nutricline of the Canada Basin during the growing season (Taylor et al., 2013). Dissolved Mn and D-Co concentrations at the edge of the shelf in the current study were similar to or lower than off-shelf
concentrations reported by Cid et al. (2012) and Kondo et al. (2016), suggesting that, unlike Fe, the elements Mn and Co are mostly not retained on the shelf.
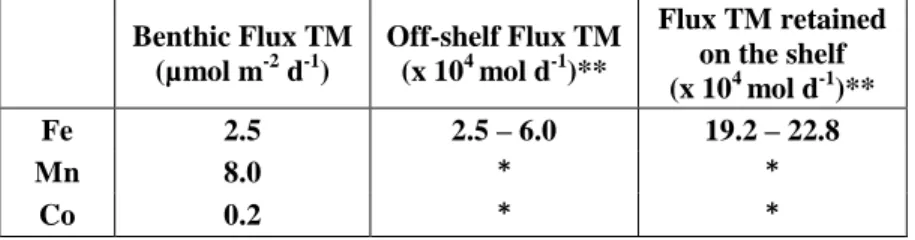
Table 2: Mean sedimentary fluxes of dissolved iron (D-Fe), dissolved manganese (D-Mn) and dissolved cobalt (D-Co) from the Chukchi Sea shelf, and off-shelf transport of D-Fe into the Canada Basin. * No removal, off-shelf flux is equal to benthic flux. **
Considering the area of our sampling region (400 x 250 km) over the Chukchi Shelf.
Benthic Flux TM (µmol m-2 d-1)
Off-shelf Flux TM (x 104 mol d-1)**
Flux TM retained on the shelf (x 104 mol d-1)**
Fe 2.5 2.5 – 6.0 19.2 – 22.8
Mn 8.0 * *
Co 0.2 * *
The benthic trace metal and Ra fluxes on the shelf and their off-shelf export to the central Arctic Ocean are likely to increase in response to climate change. The annual mean transport and velocity of Pacific waters through the Bering Strait are increasing (Woodgate, 2018), which may increase coastal erosion in the Bering Strait and Chukchi Sea regions, and consequently increase the input of trace metals and Ra to the system. Coastal erosion is accelerating along the Alaskan coast, for example, in the vicinity of Barrow and along the North Slope coastal region due to changes in climate (Peckham et al., 2001), and recent warming of permafrost in Alaska has been reported
(Osterkamp, 2007). All these changes may increase the input of trace metals and Ra to coastal zones. Furthermore, changes in the redox chemistry in the sediments may also cause an increase in fluxes of redox sensitive trace metals (including Fe, Mn, Co) to water column in the Chukchi Sea. Reduced ice cover and longer open-water seasons drive increases in primary production, and are expected to subsequently increase the vertical carbon export in the Chukchi Sea (Grebmeier et al., 2006; Arrigo and Van Dijken, 2015). Increased export of labile carbon to the sediments will change the redox potential by creating a more reducing sedimentary environment, which in turn, may lead to an increase in diagenetic mobilization of redox sensitive TMs (Trefry et al., 2014). An increase in benthic fluxes to the water column may result in higher shelf trace metal fluxes to the central Arctic in future, as an increase in off-shelf water transport due to a reduction in ice cover (Woodgate, 2018) will result in a shorter residence time of the water in the Chukchi Sea and consequently less nutrients and TMs will be retained on the shelf.
Figure 7: Schematic of trace metals (TMs) and 228Ra enrichment in the Chukchi Sea. Brine rejection during ice formation leads to convective mixing of the water column. Pacific water entering the Chukchi Sea is depleted in trace metals and 228Ra, but is enriched by benthic inputs in the Chukchi Sea as waters move northward to the Arctic Ocean. Given the mean benthic D-Fe flux over the Chukchi Shelf of ~ 25.2 x 10⁴ mol d-1 (Table 2), approximately 19.2 – 22.8 x 10⁴ mol d-1 (75-90%) is retained on the shelf, and 2.5 – 6.0 x 10⁴ mol d-1 (10-25%) is transported to the Arctic Ocean. The water exchange rate in the Chukchi Sea is represented by K, and Th represents the thorium isotopes present in the sediments.
4. Conclusion
This study is unique because it represents the only TM dataset for spring in the Chukchi Sea, a time when sea ice presence over the Chukchi shelf inhibits stratification and summer production has not yet substantially altered water column TM inventories. Thus, we were able to show that trace metals were considerably elevated throughout the Chukchi Sea shelf relative to open ocean waters, especially Fe and Mn, and that 228Ra fluxes from the Chukchi Sea sediments are one of the highest reported in the literature. High concentrations of LP-Fe and the frequent sediment resuspension episodes observed during the SUBICE campaign suggest that D-Fe supplied by diffusive inputs from sediment pore water are scavenged by suspended particles and thereby form labile particulate phases. Trace metal