1. Introduction
Silicic acid (H4SiO4) is an important nutrient for groups of phytoplankton such as diatoms and silicoflagel- lates (Dugdale et al., 1995). Silicic acid is biomineralized to amorphous biogenic silica (BSi, biogenic opal SiO2) that constitutes the hard exoskeletons and tests of these organisms. Most BSi that is synthesized in the surface ocean is solubilized back to silicic acid in situ, with around one third of new production surviving dissolution in the ocean interior to reach the seafloor (Tréguer & De La Rocha, 2013). Around 80%–90% of the deposited flux is recycled back to silicic acid, such that only a minor fraction (<5%) of newly synthesized BSi is permanently buried in the sediment (Ragueneau et al., 2002; Tréguer & De La Rocha, 2013). Yet, the oceanic residence of silicic acid with regard to burial is short enough (∼15 kyr), that the Si inventory will respond to changes in burial over glacial-interglacial timescales (Tréguer & De La Rocha, 2013; Tréguer et al., 1995). A sound understanding of BSi recycling efficiency is thus crucial for the biological carbon and silicon pumps (Dugdale et al., 1995; Tréguer et al., 2018), the assessment of paleoproductivity from the sedimentary BSi ar- chive, and for more accurate global biogeochemical models (Gao et al., 2016; Heinze et al., 2003).
Upwelling areas in eastern boundary current systems are hotspots for silica biomineralization (Nelson et al., 1995). In the Peruvian upwelling region, primary production is most intense in austral summer and dominated by diatoms (Estrada & Blasco, 1985; Franz et al., 2012). It is sustained by nutrient-rich waters fed by the poleward-flowing Peru-Chile undercurrent (Echevin et al., 2008). Microbial respiration of sinking bi- ogenic detritus leads to the formation of an oxygen minimum zone (OMZ) between ∼100 and 500 m where dissolved oxygen is depleted down to levels that are functionally anoxic (Fuenzalida et al., 2009; Thamdrup et al., 2012). The sediments underlying the OMZ are classified as hemipelagic diatomaceous mud (DeMas- ter, 1981; Reimers & Suess, 1983). They accumulate massive amounts of particulate organic carbon (POC) at rates (per m2) that are 5–6 times higher than the average continental margin value (Dale et al., 2015).
The burial efficiency of POC (i.e., burial/rain rate) is determined by the sediment accumulation rate and ambient oxygen concentrations (Canfield, 1993). Rapid burial of carbon away from the surface mixed layer reduces its exposure to oxidative attack, making permanent burial more likely (Hartnett et al., 1998). Mod-
Abstract
An extensive data set of biogenic silica (BSi) fluxes is presented for the Peruvian oxygen minimum zone (OMZ) at 11°S and 12°S. Each transect extends from the shelf to the upper slope (∼1,000 m) and dissects the permanently anoxic waters between ∼200 and 500 m water depth. BSi burial (2,100 mmol m−2 yr−1) and recycling fluxes (3,300 mmol m−2 yr−1) were highest on the shelf with mean preservation efficiencies (34% ± 15%) that exceed the global mean of 10%–20%. BSi preservation was highest on the inner shelf (up to 56%), decreasing to 7% and 12% under anoxic waters and below the OMZ, respectively. The data suggest that the main control on BSi preservation is the rate at which reactive BSi is transported away from undersaturated surface sediments by burial and bioturbation to the underlying saturated sediment layers where BSi dissolution is thermodynamically and/or kinetically inhibited.BSi burial across the entire Peruvian margin between 3°S to 15°S and down to 1,000 m water depth is estimated to be 0.1–0.2 Tmol yr−1; equivalent to 2%–7% of total burial on continental margins. Existing global data permit a simple relationship between BSi rain rate to the seafloor and the accumulation of unaltered BSi, giving the possibility to reconstruct rain rates and primary production from the sediment archive in addition to benthic Si turnover in global models.
© 2020. The Authors.
This is an open access article under the terms of the Creative Commons Attribution License, which permits use, distribution and reproduction in any medium, provided the original work is properly cited.
A. W. Dale1 , K. M. Paul2 , D. Clemens1 , F. Scholz1, U. Schroller-Lomnitz1, K. Wallmann1, S. Geilert1, C. Hensen1 , A. Plass1, V. Liebetrau1 , P. Grasse3 , and S. Sommer1
1GEOMAR Helmholtz Centre for Ocean Research Kiel, Kiel, Germany, 2Ecosystems and Environment Research Programme, University of Helsinki, Helsinki, Finland, 3German Centre for Integrative Biodiversity Research (iDiv) Halle-Jena-Leipzig, Leipzig, Germany
Key Points:
• Biogenic silica (BSi) preservation is high on the shelf and low under predominantly anoxic bottom waters
• BSi burial across the Peruvian margin down to 1,000 m water depth accounts for up to 7% of the global burial on continental margins
• Existing global data permit a simple relationship between BSi accumulation and rain rate
Supporting Information:
• Supporting Information S1
Correspondence to:
A. W. Dale, adale@geomar.de
Citation:
Dale, A. W., Paul, K. M., Clemens, D., Scholz, F., Schroller-Lomnitz, U., Wallmann, K., et al. (2021). Recycling and burial of biogenic silica in an open margin oxygen minimum zone. Global Biogeochemical Cycles, 35, e2020GB006583. https://doi.
org/10.1029/2020GB006583 Received 19 FEB 2020 Accepted 16 DEC 2020
Author Contributions:
Conceptualization: A. W. Dale, K. M. Paul
Data curation: A. W. Dale, K. M. Paul, D. Clemens, F. Scholz, U. Schroller- Lomnitz, K. Wallmann, C. Hensen, A. Plass, V. Liebetrau, S. Sommer Formal analysis: A. W. Dale, K. M. Paul, D. Clemens, F. Scholz, U. Schroller-Lomnitz, K. Wallmann, S. Geilert, C. Hensen, A. Plass, V. Liebetrau, P. Grasse, S. Sommer Funding acquisition: A. W. Dale, K. Wallmann, C. Hensen, S. Sommer Writing – original draft: A. W. Dale, K. M. Paul
erate sedimentation rates combined with a permanent lack of oxygen in the bottom water have thus been suggested to contribute to high POC burial efficiencies in the anoxic depths of the Peruvian OMZ (Dale et al., 2015; Reimers & Suess, 1983). The dependence of BSi preservation on oxygen levels is unknown.
Most recent estimates suggest that around 0.5 ± 0.2 Tmol yr−1 of BSi (1 Tmol = 1012 moles) are permanently buried in upwelling sediments underlying oxygen-deficient waters (DeMaster, 2019). Current estimates of BSi burial on the margins (excluding deltas, estuaries, silica as sponge spicules, or authigenic clays) are 2.7–4.1 Tmol yr−1 (DeMaster, 2019; Ragueneau et al., 2010; Tréguer & De La Rocha, 2013). Given that sed- iments underling oxygen-deficient waters account for only a few percent of the total margin area (Helly &
Levin, 2004), BSi burial may be elevated in these regions.
Despite the importance of coastal upwelling sediments for carbon sequestration, studies on BSi preserva- tion have tended to focus on deep-sea settings (>1,000 m). BSi burial was formerly believed to have been dominated by the diatomaceous ooze belt surrounding Antarctica, accounting for two thirds of global burial (Tréguer et al., 1995). Concerns about lateral transport of sediment to the polar front motivated a data re- assessment that led to a downscaling of the burial flux in the Southern Ocean by ∼30% (from ca. 4.1–4.8 to 3.1 Tmol yr−1) (DeMaster, 2002). It has been reduced further to 2.3 Tmol yr−1 (Chase et al., 2015). The corre- sponding global deficit was attributed to burial on the margins after scaling BSi burial to POC burial using a molar Si:C ratio of 0.6 or weight ratio of 3.1 (DeMaster, 2002). The shift in burial away from the Southern Ocean to the margins suggests a tighter coupling between the global sinks of Si and C than previously thought. More recently though, Rahman et al. (2017) argued that global Si burial as authigenic alumino-sil- icate minerals (clays) may be 4.5–4.9 Tmol yr−1. However, the significance of authigenic Si to the global Si burial flux has been questioned (DeMaster, 2019).
The purpose of this paper is to determine rates of BSi recycling, burial and the preservation efficiency in sediments in, above and below the OMZ on the Peruvian margin and how they compare to the glob- al data set. The discussion focusses on Si budgets and the putative controls on BSi preservation. The analysis is based on largely unpublished data from the Peruvian margin collected over five research campaigns along two transects extending from the shelf to the upper slope. The benthic Si data set pre- sented here is, at the time of publication, the most comprehensive for a continental margin. This study advances previous investigations into benthic Si cycling on the Peruvian shelf (DeMaster, 1981; Froelich et al., 1988).
2. Material and Methods
2.1. Overview
Data are presented from nine stations along 11°S sampled during expedition M77 on RV Meteor (cruise legs 1 and 2) in November/December 2008 and 10 stations along 12°S during expedition M92 (leg 3) in January 2013 (Figure S1). Sampling stations on both transects ranged from ca. 80–1,000 m. Three of the stations at 11°S (St. 1.1, 4.1, and 4.2) are supplemental to the six stations discussed in a previous synthesis of POC burial (Dale et al., 2015). Nine of the stations along 12°S were revisited in April/May 2017 on expeditions M136 and M137 conducted consecutively. M77 and M92 took place during austral summer, that is, the low upwelling, high productivity season whereas M136 and M137 took place during the summer-winter transi- tion. A wealth of benthic biogeochemical data has been published from these campaigns, focusing on the biogeochemistry of C, N, P, Fe, trace metals, and paleo aspects (e.g., Dale et al., 2019; Lomnitz et al., 2016;
Scholz et al., 2011; Sommer et al., 2016). Here, we present a database of largely unpublished silicic acid fluxes (56 in total) and porewater distributions (63 sediment cores) from these sampling transects. Full details of sampling locations and data collected are listed in Tables S1 and S2. Silica data from three sites at 11°S (M77) have been previously reported by Ehlert et al. (2016). All Si data used in this study have been uploaded to the World Data Center PANGAEA (https://www.pangaea.de/).
In line with previous studies, the Peruvian margin is divided into three zones (Dale et al., 2015): (i) the mid- dle and outer shelf (<ca. 200 m, O2 generally below detection (dl, 5 μM) where nonsteady state conditions are occasionally driven by intrusion of oxygenated bottom waters (Gutiérrez et al., 2008), (ii) the core of the OMZ (ca. 200–∼500 m (12o, Dale et al., 2015) or ∼600 m (11°S, Bohlen et al., 2011) where O2 is mostly < dl), and (iii) the deep oxygenated stations on the upper slope below the OMZ (O2 > dl).
Writing – review & editing: A. W.
Dale, K. M. Paul, D. Clemens, F. Scholz, U. Schroller-Lomnitz, K. Wallmann, S. Geilert, C. Hensen, A. Plass, V. Liebetrau, P. Grasse, S. Sommer
2.2. Benthic Silicic Acid Fluxes
Silicic acid fluxes were determined using time series data collected in situ using benthic incubation cham- bers (Biogeochemical Observatory landers [BIGO], Sommer et al., 2016). Lander fluxes were obtained by linearly interpolating the concentration-time series data. They provide the net recycling rate of BSi (BSirec):
4 4
rec H SiO
BSi d
H dt
(1)
where d[H4SiO4]/dt is the concentration-time gradient and H is the height of water in the chamber. The uncertainties associated with lander fluxes have been discussed in detail (Dale et al., 2015; Hammond et al., 2004; Tengberg et al., 2005). The mean standard error of each flux was equivalent to ±13% (range 2%–61%). For each station on each transect, we report the average of all fluxes determined at that station.
As an independent check on the chamber fluxes, the diffusive benthic silicic acid flux out of the sediment, JDiff, was calculated from silicic acid pore water concentration gradients at the sediment surface using Fick's First Law (see supporting information). At each station, JDiff ± SD was based on the average for all cores taken.
2.3. Sediment Sampling
Sediments were taken with a multiple-corer (MUC) and sub-sampled under anoxic conditions using an Ar-filled glove bag. Short 10 cm-diameter push-cores were also taken from the BIGO chambers immedi- ately after they were returned to the deck and subsampled under Ar or air, depending on the cruise. The sectioning interval in the upper 5 cm was generally 0.5 cm (M92) or 1 cm (M77, M136, and M137), with increasing interval thickness moving down the core. Porewaters were extracted by centrifuge and filtered using cellulose acetate Nuclepore® filters (0.2 µm) inside the glove bag. Further sediment handling details are provided by Dale et al. (2016).
2.4. Analytical Details
Silicic acid concentrations were determined on board colorimetrically using standard photometric tech- niques (Grasshoff et al., 1999). Wet sediment samples were freeze–dried in the home laboratory for analysis of POC using a Carlo Erba elemental analyzer. POC content was determined in dry weight percent (%) after acidifying the sample with HCl (0.25 N) to release inorganic carbon (assumed to be carbonates) to CO2. Total carbon (organic + inorganic) was determined using samples without acidification. Carbonate was determined by weight difference of the two measurements. The precision and detection limit of the POC analysis was 0.04% and 0.05%, respectively. The precision and detection limit of the carbonate analysis was 2% and 0.1%, respectively. Porosity was determined from the weight difference of the wet and freeze-dried sediment, assuming a sediment density of 2.5 g cm−3 and a seawater density of 1.023 g cm−3.
The sediment cores where BSi measurements were performed are indicated in Tables S1 and S2. BSi was determined on 20 mg of freeze-dried ground sediment samples following the automatic NaOH leaching method of Müller and Schneider (1993). The precision of the method is 5%–10%. This operationally defined fraction has been shown to underestimate BSi content if diatom frustules are coated with authigenic metal oxides that protects them from dissolution (Michalopoulos & Aller, 2004; Rahman et al., 2017). Unless otherwise indicated, BSi from the Peruvian margin refers to unaltered opal and is reported as % SiO2. Au- thigenic alumino-silicate minerals are also not extracted by the alkaline leach (Rahman et al., 2017), such that our BSi burial fluxes (and those in the wider literature) are minimum estimates of Si burial originally supplied to the sediment as unaltered opal.
The mass of terrigenous detrital (nonbiogenic) material was determined by mass difference of the total and biogenic components, that is, total mass – (carbonate + 2.8 × POC + BSi) where the factor 2.8 converts mass of POC to total particulate organic matter (Sayles et al., 2001). Terrigenous detritus in marine sediments
typically consists of alumino-silicates and (oxy)hydroxides weathered on land and transported to the ocean by rivers.
2.5. Excess 210Pb and Sediment Accumulation Rates
Sediment accumulation (ωacc, cm kyr−1) was determined using measured unsupported activities of the par- ticle-bound radionuclide 210Pb (half-life 22.3 years) by gamma counting as described by Dale et al. (2015).
The unsupported, or excess, 210Pb (210Pbxs) is the fraction that is not produced by the decay of 222Rn in the sediment but delivered to the seafloor with other particles. The mean error of the measurement was ∼20%.
We used a steady-state reaction-transport model to calculate ωacc by simulating the radioactive decay of
210Pbxs and transport by burial and mixing (bioturbation) (Alperin et al., 2002). Measured porosities at each station were used as input parameters along with the flux of 210Pbxs to the sediment surface. In taking this approach, we accept that sediment burial patterns on the continental margin are affected by resuspension and downslope redistribution of particulate material (Arthur et al., 1998; Erdem et al., 2016; Gutiérrez et al., 2009; Jahnke et al., 1990). Uncertainties in our ωacc estimates due to discontinuities in radioisotope data by winnowing or mass wasting processes would require additional detailed sedimentological investi- gations (Salvatteci et al., 2014).
In a previous study (Dale et al., 2015), the adjustable model parameters (ωacc, bioturbation coefficient and mixing depth) were constrained by visually fitting the model to 210Pbxs data. We have revaluated these pa- rameters for both the 11°S and 12°S transects using a Monte Carlo-type approach that consisted of ensemble model simulations (103 runs) at each station using random sets of parameter values. The value of ωacc was determined from the average of the 10 simulations with the minimum least squares regressions. The 210Pbxs
data in some of the cores on the shelf were scattered in the upper 10 cm, leading to greater uncertainty in ωacc, and in bioturbation coefficients that were not well constrained. We refer instead to the mixed layer thickness to compare bioturbation intensities between stations. In three cores at 12°S (128 and 195 m), the model was fit to the 210Pbxs below the apparent mixed depth. The data at 195 m were particularly scattered in cores sampled in 2008 (M92) and 2013 (M136), and the burial fluxes for this station should be treated cautiously. Additional analysis of shorter-lived tracers such as 7Be (half-life 53 days) or photosynthetic pig- ments (e.g., chlorophyll a) would have been useful to make further inferences on sediment mixing intensity and whether slow mixing by animals below the apparent mixed may artificially increase our derived ωacc
values. ωacc determined in cores from the same stations sampled in 2008 and 2013 at 12°S differed by 35% on average due to the downcore variability in 210Pb and to local heterogeneity. We report the mean ωacc for the stations sampled on two cruises at 12oS and all ωacc are assigned a 35% uncertainty. For St. 2 and 4 at 11°S, no
210Pb measurements were made and ωacc for these sites was interpolated from adjacent stations. Parameters and boundary conditions for simulating 210Pbxs are given in Table S3.
2.6. Calculations and Definitions
The sediment accumulation rate was used to calculate the mass accumulation rate (MAR, g cm−2 yr−1), that is, the total mass of biogenic + lithogenic material:
acc
MAR (1 L )
(2) where ρ is the dry density of solid particles and φ(L) is the measured porosity of compacted sediment (see supporting information).
The accumulation rate of BSi (BSiacc, g SiO2 cm−2 yr−1) was then calculated as:
Av
acc BSi %
BSi MAR·
(3)100%
Conversion between mass and molar units was done using the molecular mass of SiO2 (60.08 g mol−1).
In the above expression, BSiAv (%) refers to the mean BSi content in sediment where dissolution of BSi no longer occurs, that is, below the depth of asymptotic silicic acid concentrations:
Av 1
BSi zBSi d
y x x
(4)z y
where BSi(x) is the measured BSi content at depth x (cm), y is the depth where silicic acid concentrations reach their asymptotic value, and z is deepest BSi measurement depth. For the M92 data, z = 10 cm whereas during M77 the measurement depth varied, being up to 47 cm at St. 3. We made a simplifying assumption to calculate BSiAv, whereby BSiAv was instead determined over the whole sediment core. We took this approach because the asymptotic depth is not that clear in all cores and fewer BSi data were available for 12°compared to 11°S (see supporting information). The reported uncertainty in BSiAv is the standard deviation of all BSi(x) at each station. The uncertainty in BSiacc was determined from MAR and BSiAv using standard error propagation rules.
The rain rate of BSi to the seafloor was assumed equal to the sum of BSiacc and the fraction of BSi that is recycled to silicic acid (determined using the BIGO landers):
RR acc rec
BSi BSi BSi
(5) For stations 1.1, 4.1, and 4.2 at 11°S where no benthic chambers were deployed, BSirec was estimated from a linear relationship between JDiff and BSirec determined from the other sites (see Section 3.2).
Finally, the burial efficiency of BSi (BSiBE, %) was calculated as:
acc
RR
BSiBE BSi 100%
(6)BSi
The uncertainty in BSiBE was calculated using standard error propagation rules. The major assumptions implicit in Equation 6 are as follows: (i) the fluxes are in steady state, and (ii) that dissolution of BSi is the only reaction affecting silicic acid and BSi within the sediment pile.
Mean BSiRR and BSiacc per transect and for both transects combined were calculated by weighting the data from each station according to the distance between adjacent stations. Mean values of BSiBE were deter- mined in the same way, instead of using Equation 6 with the mean BSiacc and BSiRR. The distance-weighted arithmetic mean provides a more realistic estimate of the overall BSiBE because it considers the individual characteristics of the Si budget at each site.
Organic carbon burial efficiencies (CBE) at 12°S were calculated analogously using POC accumulation rates and benthic dissolved inorganic carbon (DIC) fluxes (Dale et al., 2015). The CBEs reported here for the 12°S transect have been revised from those given in Dale et al. (2015) to account for the new data on POC content, ωacc, and DIC fluxes from the most recent expeditions (M136 and M137). The CBEs for 11°S have also been revised with the new ωacc estimates from the ensemble model runs. The CBEs are more uncertain for 11°S than at 12°S since the recycling flux was estimated using modeled data rather than measured DIC fluxes (Bohlen et al., 2011). The mean relative difference in CBE estimates at each station from the values reported by Dale et al. (2015) was 17%.
2.7. Existing Literature Data for BSiBE, BSiRR, and BSiacc
Published literature data (Table 1) for BSiBE, BSiRR, and BSiacc are available from four regions in the South- ern Ocean and nine other deep-water regions (>1,000 m). The shallower sites are oxygen-deficient mar- gins in Guaymas Basin (O2, < dl), San Pedro Basin, and San Nicolas Basin on the California Borderlands (low and variable O2, < ∼20 μM, Berelson, 1991) plus additional data from the Peruvian shelf by Froelich et al. (1988). BSi rain rates in the studies listed in Table 1 were mainly calculated as the sum of the recycling and burial fluxes assuming steady state. Recycling fluxes were estimated from porewater profiles or benthic chamber data. Burial fluxes were generally estimated using MAR and BSi contents determined by alkaline leaching, but not always using the same geochronology. The data listed are the mean values for each specific region, taken directly from a data compilation by Ragueneau et al. (2009) (Indian Ocean, NW Atlantic, NE Atlantic, Equatorial Atlantic) or calculated by ourselves as the arithmetic mean of the individual sampling
Region Water
depth (m) Sediment accumulation
(cm kyr−1) BSi content
(%) BSi accumulation
(mmol Si m−2 yr−1) BSi recycling
(mmol Si m−2 yr−1) BSi rain rate (mmol Si m−2 yr−1)
BSi burial efficiency
(%) Southern Ocean
170°W transect "/> 2,740–4,967 2.7 (0.5–8.2) 62 (27–92) 84 (9–273) 649 (126–1,215) 734 (135–1,403) 10 (5–19)
Ross Seac 572–3,580 4.1 (1.1–16) 9 (1–43) 189 (3–1,233) 356 (108–890) 545 (114–2,124) 13 (1–58)
POOZd 3,620–4,710 6.7 ∼79 280 1,675 1,955 14
PFZd 4,240–4,600 2.4 41–69 88 733 821 11
Other regions
Eq. Pacifice 3,150–4,620 0.9 (0.1–1.7) 14 (11–16) 7 (1–19) 98 (56–159) 105 (57–178) 5 (2–11)
Eq. Pacificf 4,391–4,560 1.7 (0.9–2.7) 5 (2–8) 10 (2–16) 133 (84–172) 144 (86–180) 7 (3–10)
N. Pacificg 4,783–5,741 0.7 (0.2–1.5) 3 (1–8) 2 (0.1–8) 87 (15–243) 89 (15–245) 2 (1–5)
N. Pacifich 4,427–5,679 0.6 (0.2–1.0) 15 (7–28) 4 (1–9) 253 (77–389) 257 (80–390) 1.9 (0.3–3)
NE Pacifice 2,200–4,230 7.8 (1.3–19) 6 (3–10) 42 (4–141) 236 (51–653) 278 (55–794) 12 (7–18)
NW Indian Oceani 4,059 4.0 6 18 260 278 6
NW Atlantic (BATS)i ∼4,300 0.7 <2 1 17 18 6
NE Atlantic (PAP)i ∼4,800 7.5 1–2 8 57 65 12
Eq. Atlantic Cj ∼4,000 100 4–6 172 274 446 39
Eq. Atlantic Dj ∼4,000 120 3–5 307 614 921 33
Guaymas Basink 665 180 16 941 743 1,683 56
Peru Shelfl 86–183 297 (230–360) 10 (8–12) 591 (358–827) 1,961 (1,023–2,997) 2,552 (1,380–3,585) 24 (16–31)
California Borderlandm 900–1,800 70 (38–101) ∼0.3 25 256 280 8.7
aWhere reported, mean values are given with the range of observed values in parentheses. POOZ, Permanently Open Ocean Zone, PFZ, Polar Front Zone, BATS, Bermuda Atlantic Time-series Study, PAP, Porcupine Abyssal Plain. bSayles et al. (2001), 7 stations across siliceous ooze in the Pacific Basin. Burial flux based on 230Th-normalized sediment accumulation rates in upper 5 cm; recycling flux based on porewater dissolved silicic acid gradients; rain rate for the individual stations was calculated as the recycling plus burial flux. BSi content based on the formula SiO2-(0.4H2O). cDeMaster et al (1996). Recycling flux based on ex situ whole core incubations; burial flux based on 14C chronology; rain rate calculated as recycling plus burial fluxes. Only stations where the recycling flux was measured were considered in the calculations (St. 90-1, 90-30, 90-40, 90-110, 92-55, 92-137, 92-141). We excluded the rapidly accumulating sediments in Granite Harbor. dRecycling fluxes for the POOZ and the PFZ are model results by Rabouille et al. (1997), taking here the average of cores KTB06 and KTB05 for the POOZ, and cores KTB11, KTB13, KTB16 for the PFZ (their Table 4). BSi content from these cores were taken from Figure 9 in Rabouille et al. (1997) after converting their values in wt.% Si to % SiO2 by multiplying by 60/28. BSi accumulation rates are the average of the 230Th-normalized data given by Pondaven et al. (2000) and Francois et al. (1997) for the Indian Sector of the Southern Ocean reported by DeMaster (2002). Rain rate calculated in this study as recycling plus burial fluxes. The 230Th-normalized BSi burial flux for the POOZ and PFZ is ∼70% and 25%, respectively, of the values reported by Rabouille et al. (1997), who assumed a sedimentation rate of 10 cm kyr−1. Correcting Rabouille et al.'s sedimentation rate by the same proportions as the BSi burial fluxes leads to a rough estimate of the sedimentation rates for the POOZ and PFZ of 6.7 and 2.4 cm kyr−1, respectively. These values are provided to complete the table but not used in the calculations. eDymond and Lyle (1994), Stations H, M, S, C in the equatorial Pacific and MZF, JDF, NS, MW, and G in the NE Pacific. Burial flux based on 230Th, 14C and oxygen isotopic stratigraphy; rain rate based on long-term (∼≥1 year) sediment trap deployments corrected for resuspension; recycling flux calculated as the difference between rain rate and burial fluxes. BSi contents are reported in Archer et al. (1993). fMcManus et al. (1995) and Berelson et al. (1997). Seven stations from 5°N to 5°. Burial flux based on 14C accumulation rates. Recycling flux based on benthic chamber fluxes and porewater gradients.
Rain rate calculated in this study as recycling plus burial fluxes. gHou et al. (2019). Five roughly meridional stations (148°W-157°W) in the NW Pacific. Burial flux based on previously published paleomagnetic averages over the last 700 kyr. Recycling flux based on porewater gradients. Rain rate calculated as recycling plus burial fluxes. hShibamoto and Harada (2010). Four stations in the western N. Pacific. Burial flux based on 230Th/232Th activity ratios. Recycling flux based on porewater gradients. Rain rate calculated as recycling plus burial fluxes. iFrom the data compiled by Ragueneau et al. (2009) in their Table 3. Rain rates calculated as recycling plus burial fluxes. Water depths and BSi contents from references therein. jRagueneau et al. (2009), BIOZAIRE stations C and D in the Congo submarine canyon. Burial flux based on excess 210Pb measurements; Recycling flux based on porewater gradients. Rain rate calculated as recycling plus burial fluxes. kRecycling flux and BSi accumulation calculated from data in Geilert et al. (2020) for a site (27°42.41' N and 111°13.66' W) on the slope underlying bottom waters with O2 concentrations below analytical detection limit of the Winkler titration. Rain rate calculated in this study as recycling plus burial fluxes. lFroelich et al. (1988) report sedimentation rates, BSi and silicic acid data for six stations on the Peruvian margin. Data included in this study were taken from shelf stations BX-4, BX-5, and BX-6. Stations BX-2, BX-3, and GS-6 were not included because of nonsteady state artifacts (BX-3 and GS-6) or a large sampling depth interval at the surface sediment where BSirec cannot be accurately calculated (BX-2). Rain rate calculated in this study as recycling plus burial fluxes. mBerelson et al. (1987). Average for San Pedro and San Nicolas Basins (their Table 8). Recycling flux based on benthic chamber fluxes. The sediment accumulation rate was calculated from the MAR given in Berelson et al. (1987) assuming a density of 2.2 g cm3 and a porosity of 0.82 (Leslie et al., 1990). These values are provided to complete the table but not used in the calculations.
Table 1
Published Si Data Used in This Studya
sites (Southern Ocean 170°W transect, Ross Sea, North Pacific, and Equatorial Pacific. Mean BSiBE varied between ∼6% (Bermuda Atlantic Time-series Study site) and 56% (Guaymas Basin).
3. Results
3.1. Mixing Depths and Sediment Accumulation Rates
210Pbxs at most stations decreased in a quasiexponential manner (Figures S2–S4). Three shelf stations (St. 1 at 11°S, St. 3 and 5 at 12°S during 2013, and St. 5 during 2017) exhibited considerable scatter, presumably due to intermittent bioturbation during periods of bottom water ventilation (Gutiérrez et al., 2008). The mixed layer thickness determined by ensemble modeling of 210Pbxs decreased substantially from the shelf (0.2–13.4 cm, median 7.6 cm) to the OMZ and below (0.1–4.2 cm, median 0.4 cm) (Table S3). Sediment accumulation rates ranged from 9 cm kyr−1 in the OMZ at St. 8 (12°S) to 470 cm kyr−1 on the shelf at St. 1 (12°S) (Table 2).
Station
Water depth (m)
Sediment accumulation rate (ωacc) (cm
kyr−1)
Mass accumulation rate (MAR) (g
m−2 yr−1)
Mean BSi content
(BSiAv) (%)
accumulation BSi (BSiAcc)
(mmol m−2 yr−1) BSi recycling (BSiRec)
(mmol m–2 yr–1) BSi rain rate (BSiRR) (mmol m–2 yr–1)
BSi burial efficiency (BSiBE)
(%)
burial POC efficiency (CBE)a (%) 11°S
1 82 350 ± 120 1,400 ± 490 12 ± 2.9 2,800 ± 1,200 3,200 ± 210 5,900 ± 1,200 47 ± 22 52 ± 24
1.1 145 44 ± 15 110 ± 40 17 ± 3.7 320 ± 130 4,000 ± 1,000 4,400 ± 1,000 7.4 ± 3.5 No data
2 259 53 ± 19 120 ± 41 11 ± 3.0 220 ± 96 4,600 ± 580 4,900 ± 580 4.5 ± 2.0 34 ± 13
3 311 62 ± 22 190 ± 65 6.6 ± 2.7 200 ± 110 2,400 ± 420 2,600 ± 440 7.8 ± 4.4 49 ± 20
4 397 38 ± 13 270 ± 96 4.0 ± 2.5 180 ± 130 2,500 ± 200 2,700 ± 240 6.7 ± 4.9 51 ± 29
4.1 512 14 ± 4.9 67 ± 24 1.0 ± 0.3 12 ± 5.0 1,000 ± 250 1,000 ± 250 1.1 ± 0.6 No data
4.2 579 34 ± 12 200 ± 71 0.6 ± 0.6 21 ± 21 840 ± 210 860 ± 210 2.5 ± 2.5 No data
5 695 73 ± 26 420 ± 150 1.4 ± 0.7 100 ± 58 700 ± 120 810 ± 130 13 ± 7.5 77 ± 36
6 978 57 ± 20 390 ± 140 1.4 ± 0.6 90 ± 51 1,500 ± 460 1,600 ± 460 5.5 ± 3.5 63 ± 27
12°S
1 74 470 ± 170 1,900 ± 660 14 ± 2.1 4,500 ± 1,700 3,500 ± 360 7,900 ± 1,700 56 ± 25 19 ± 9
2 101 320 ± 110 630 ± 220 19 ± 2.4 2,000 ± 740 4,000 ± 420 5,900 ± 850 34 ± 13 17 ± 6
3 128 140 ± 50 340 ± 120 22 ± 4.4 1,200 ± 502 2,800 ± 180 4,200 ± 530 29 ± 13 24 ± 9
4 142 72 ± 25 230 ± 80 15 ± 2.4 580 ± 220 2,000 ± 140 2,500 ± 260 23 ± 9.1 37 ± 14
5 195 140 ± 49 450 ± 160 13 ± 0.5 990 ± 350 2,700 ± 150 3,600 ± 380 27 ± 9.9 61 ± 26
6 244 47 ± 16 120 ± 43 8.8 ± 0.9 180 ± 66 1,300 ± 180 1,500 ± 190 12 ± 4.6 39 ± 16
7 306 50 ± 17 150 ± 52 7.9 ± 0.3 200 ± 69 670 ± 79 870 ± 110 23 ± 8.5 66 ± 29
8 409 9.0 ± 3.2 36 ± 13 2.5 ± 2.4 15 ± 15 390 ± 36 400 ± 40 3.8 ± 3.8 23 ± 10
9 756 47 ± 16 340 ± 120 1.0 ± 0.3 59 ± 26 530 ± 78 590 ± 82 10 ± 4.5 56 ± 26
10 989 60 ± 21 540 ± 190 1.3 ± 0.2 110 ± 42 470 ± 140 580 ± 140 19 ± 8.6 70 ± 33
Averages 11°S and 12°S
Shelf 250 ± 87 910 ± 320 15 ± 2.7 2,100 ± 830 3,300 ± 400 5,300 ± 1,000 34 ± 15 30 ± 13
OMZ 37 ± 13 150 ± 51 5.2 ± 1.8 130 ± 66 1,900 ± 260 2,000 ± 270 6.7 ± 3.8 32 ± 14
Below OMZ 59 ± 21 430 ± 150 1.3 ± 0.4 90 ± 43 790 ± 190 880 ± 200 12 ± 6.1 66 ± 30
All 110 ± 39 460 ± 160 7.7 ± 1.7 760 ± 310 2,100 ± 290 2,800 ± 500 17 ± 8.2 39 ± 18
Note. The shaded rows distinguish the OMZ stations from the shelf and deeper sites. Fluxes are moles of Si. Data are rounded to two significant figuresb.
aCBE values updated from Dale et al. (2015). bUncertainty calculation (±) are explained in Section 2.
Table 2
Mass Accumulation Rates and Sediment Silicon Budget at 11°S and 12°S on the Peruvian Margin
The lowest MAR were found for the OMZ at St. 4.1 (11°S) and St. 8 (12°S) where sediment deposition is inhibited by winnowing (Table 2). Highest MAR of 1,900 g m−2 yr−1 were found on the shelf; a factor of 3–4 higher than the global shelf average of 500 g m−2 yr−1 (Burwicz et al., 2011). On average, the MAR for stations below the OMZ were twice as high as for stations within the OMZ (150 vs. 430 g m−2 yr−1), likely due to down slope transport and deposition of particles resuspended from the shelf (Arthur et al., 1998;
Dale et al., 2015).
It is important to note that the ωacc and MAR values are characteristic of the lifetime of 210Pb (i.e., ∼100 years).
Long-term accumulation rates determined from 14C data indicate episodic removal of sediments through mass-wasting or scouring (DeMaster, 1981). The computed ωacc values are thus upper limits to the long-term (millennial) rates that should be used construct global silica budgets.
3.2. Silicic Acid in Porewaters
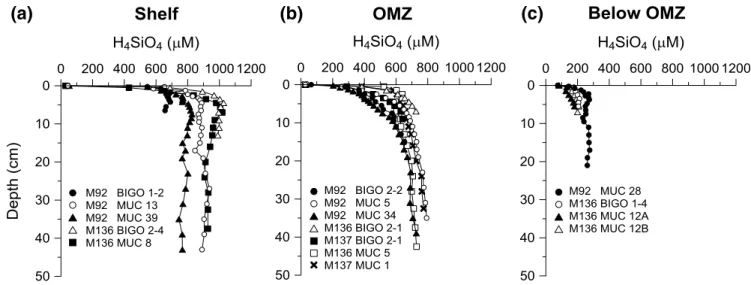
Examples of porewater silicic acid concentrations for the shelf, OMZ, and below the OMZ are shown in Figure 1 for 12°S (all cores are shown in Figures S5 and S6). Concentrations increased from bot- tom water values of 30–80 µM to quasiasymptotic values at depth below the sediment-water interface (H4SiO4∞). H4SiO4∞ generally decreased with water depth from 700 to 900 µM on the shelf to ∼200 µM below the OMZ (Figure S7). Given that bottom water temperature decreased from ca. 15° to 5°C across the margin (Figure S11), the decrease in H4SiO4∞ is consistent with thermodynamic (solubility) control on silica dissolution (Van Cappellen & Qiu, 1997a, 1997b). Yet, at all stations, H4SiO4∞ was well below the theoretical solubility of opal (H4SiO4_SAT) that decreased from 1,164 to 953 µM across the tran- sect (Figure S7). Qualitatively similar trends have been observed around the world (Hurd, 1973). This points toward further controls on H4SiO4∞ such as detrital content and sediment accumulation rates, as discussed later.
Diffusive silicic acid fluxes decreased from ∼4,000 mmol m−2 yr−1 on the shelf to ∼300 mmol m−2 yr−1 below the OMZ (not shown). At 12°S, these fluxes were very similar to BSirec determined using the ben- thic chambers, whereas at 11°S BSirec was 60% higher (Figure S8). For stations 1.1, 4.1, and 4.2 at 11°S where no in situ fluxes were available, BSirec was thus determined as JDiff × 1.6. A higher flux in ben- thic chambers is often attributed to enhanced pumping of porewater by tube-dwelling organisms (Glud et al., 1994). Given the lack of large communities of burrowing organisms in the OMZ, a better agreement between the two approaches might have been expected at 11°S. At present there is no clear explanation for these differences.
Figure 1. Silicic acid concentrations in sediment porewaters on the shelf (St. 1, 74 m), OMZ (St. 6, 244 m), and below the OMZ (St. 10, 989 m) at 12°S. Profiles from all cores are shown in Figures S5 and S6.
(a) (b) (c)
3.3. Biogenic Silica Distributions and Burial Efficiencies
Mean BSi content was highest on the shelf (22%) and decreased offshore to 1% below the OMZ (Table 2, Figure 2a). Downcore distributions of BSi were highly variable (Figures S9 and S10), as observed previously (Gutiérrez et al., 2009; Salvatteci et al., 2014). On average, the variability within a single core was within 40%
(11°S) and 20% (12°S) of the mean value. Down core variations in the content of POM and detritus are likely responsible for the variability in BSi rather than the measurement procedure (5%–10% reproducibility) or postburial dissolution of BSi (DeMaster, 1981).
In contrast to BSi, mean POC content tended to be relatively low on the shelf (<200 m, ∼2–10%) (Figure 2a).
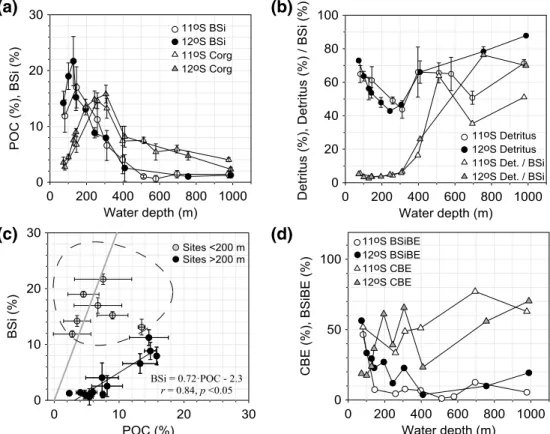
Maximum values of 16% were measured at St. 7 (300 m) at 12°S where bottom waters are permanently anoxic. Below the OMZ, POC decreased to ∼5%. POC content mirrored terrigenous detritus because these two components comprised the bulk of particulates, averaging 22% and 62%, respectively (Figure 2b). BSi accounted for 9% of the bulk material on average, with carbonate comprising ∼5% (not shown). The ratio of detritus to BSi was less than 10 on the shelf and in the OMZ, increasing sharply to ∼60 at the deepest sites (Figure 2b). This must be partly due to the abundance of diatoms close to the coast (Franz et al., 2012).
There was a marked correlation between BSi and POC in and below the OMZ, with a BSi:POC weight ratio of 0.7 (molar Si:C ratio of ∼0.14, black symbols, Figure 2c). This is below the value of 3.1 reported by De- Master (2002) for continental margins (molar Si:C ratio of 0.6), implying either preferential burial of POC (relative to BSi), preferential remineralization of BSi (relative to POC), or variations in BSi:POC export ratios (Tréguer et al., 2018). The shelf sites displayed weight ratios more similar to 3.1, and thus more typical of margins.
Figure 2. Particulate data across the sampling transect on the Peruvian margin. (a) POC and BSi content, where BSi refers to %SiO2, (b) detritus and detritus/BSi, (c) BSi versus POC content, and (d) CBE and BSiBE. The gray symbols in (c) within the dashed line denote shelf sites (<200 m) and the filled symbols are the sites within and below the OMZ along with the linear regression (solid line) and Pearson correlation coefficient (r). The gray line is the BSi:POC weight ratio of 3.1 reported by DeMaster (2002) for continental margin sediments (molar ratio ∼0.6). For clarity, error bars are omitted in (d) but given in Table 2.
(a) (b)
(c) (d)
BSi accumulation was highest on the shelf, with an average across the two transects of 2,100 mmol m−2 yr−1 (Table 2). BSi recycling fluxes were 57% higher (3,300 mmol m−2 yr−1). The mean BSi recycling flux in the OMZ was an order of magnitude higher than accumulation (1,900 vs.
130 mmol m−2 yr−1), implying a strong decrease in BSiBE. Indeed, mean BSiBE was 34% on the shelf, declining to 7% in the OMZ and 12% below the OMZ, with an overall mean of 17% ± 8% (Figure 2d, Table 2). At the deepest station on the 12°S transect, BSiBE increased to 19%, presum- ably due to sediment focusing (Dale et al., 2015). CBE was 30% on the shelf, and 32% and 66% in and below the OMZ (respectively). Overall, mean CBE (39% ± 18%) was more than twice that for BSi. BSi was pre- served at all stations even though H4SiO4∞ were always below H4SiO4_SAT
(Figure S7).
4. Discussion
4.1. Controls on BSi Burial Efficiency 4.1.1. Aluminum—Si Interactions
The data show that the mean BSiBE for the Peruvian margin is similar to the global mean of ∼15% reported by Tréguer and De La Rocha (2013). Their estimate is based on direct measurements of burial and recycling fluxes in the deep-sea and by scaling BSi burial to POC burial on the margins (DeMaster, 2002). On the Pe- ruvian margin, large differences in BSiBE with water depth are observed, decreasing from 35% on the shelf, to 7% in the OMZ and to 12% below the OMZ.
Ongoing discussion regarding silica preservation centers on the mechanisms put forward to explain why H4SiO4∞ is systematically lower than H4SiO4_SAT in the presence of dissolvable silica (Figure S7 and Sarmien- to & Gruber, 2006). Laboratory and field studies suggest that H4SiO4∞ is controlled by chemical interactions between silica shell fragments and dissolved Al released from detrital alumino-silicate clay minerals (Dixit
& Van Cappellen, 2003; Dixit et al., 2001; van Beusekom et al., 1997). To illustrate this idea, H4SiO4∞ cor- relates negatively with the detritus/BSi ratio (Figure 3). One could expect a similar trend between H4SiO4∞
and porewater Al(III) concentrations, given that the latter correlates positively with detrital content (Dixit et al., 2001). The data are in good agreement with the empirical relationship derived for deep-water sites by Dixit and Van Cappellen (2003). The elevated H4SiO4∞ found at higher ratios at Peru might be due to a greater input of soluble silica (cf. Archer et al., 1993), possibly as a result of sediment focusing. The detrital content is also enriched below the OMZ due to precipitation of glauconite (Scholz et al., 2014). Overall, though, it seems that the relationship between H4SiO4∞ and detritus/BSi on the Peruvian margin is similar to that in the deep-sea.
The observed decrease in H4SiO4∞ is generally interpreted as kinetic and/or thermodynamic control on silicic acid levels (Sarmiento & Gruber, 2006). The kinetic viewpoint argues that Al(III) solubilized from detritus is either incorporated into the silica mineral matrix or else blocks reactive sites on frustules, leading to more sluggish BSi dissolution and lower H4SiO4 concentrations (McManus et al., 1995; Sayles et al., 1996;
Van Cappellen & Qiu, 1997a, 1997b; Van Cappellen et al., 2002). An increase in BSi preservation would follow. Alternatively, H4SiO4∞ is controlled by the precipitation of authigenic alumino-silicate minerals as the sediment porewater becomes more enriched in dissolved Al as the detritus fraction increases (Dixit et al., 2001; Michalopoulos & Aller, 2004; Rickert et al., 2002; van Beusekom et al., 1997). H4SiO4∞ concen- trations are then thermodynamically controlled and intermediate between the solubility of the dissolving phase (i.e., opal) and the less-soluble precipitating phase (Van Cappellen & Qiu, 1997a). In fact, silicon isotopes (δ30Si) in Peruvian porewaters at 11 S support this idea (Ehlert et al., 2016). Silicic acid was found to be enriched in 30Si in and below the OMZ due to preferential removal of 28Si into authigenic minerals, whereas weaker enrichment of 30Si on the shelf with low detritus/BSi ratios indicated that precipitation was less important there. According to model results, 24% of the dissolving biogenic opal was re-precipitated Figure 3. Mean asymptotic silicic acid concentration (H4SiO4∞) at each
station versus the ratio of nonbiogenic detritus to biogenic silica. The curve shows the empirical relationship by Dixit and Van Cappellen (2003) for deep-water sites (>1,000 m water depth). For the Peru data, the arrow indicates a general increase in water depth with higher ratios.
into authigenic phases in the OMZ. Precipitation of clay minerals would tend to increase BSiBE by lowering BSirec (Equation 6). Thus, the BSiBE for the OMZ sediments might be even lower than 7% determined here.
Despite these observations, the abundance of detritus relative to BSi cannot be the main driver for BSi pres- ervation, because BSiBE and detritus/BSi show opposite trends with water depth (Figure 2, Table 2). Rather, the local concentrations of Al(III), H4SiO4 and reactive BSi are likely to be key considerations for kinetic and thermodynamic control on Si cycling. Porewater concentrations of Al(III) and H4SiO4 are close to ambient seawater levels at the sediment-water interface due to rapid diffusive exchange with the overlying water (cf.
Figure 1). Al(III) and H4SiO4 concentrations tend to increase with sediment depth due to biogeochemical reactions (e.g., van Beusekom et al., 1997). Consequently, fresh BSi is more likely to be preserved if it can reach quickly the sediment layers enriched in Al(III) and H4SiO4. As discussed next, the sediment accumu- lation rate indeed appears to be a key factor for silica burial efficiency at Peru.
4.1.2. Sediment Accumulation Rate
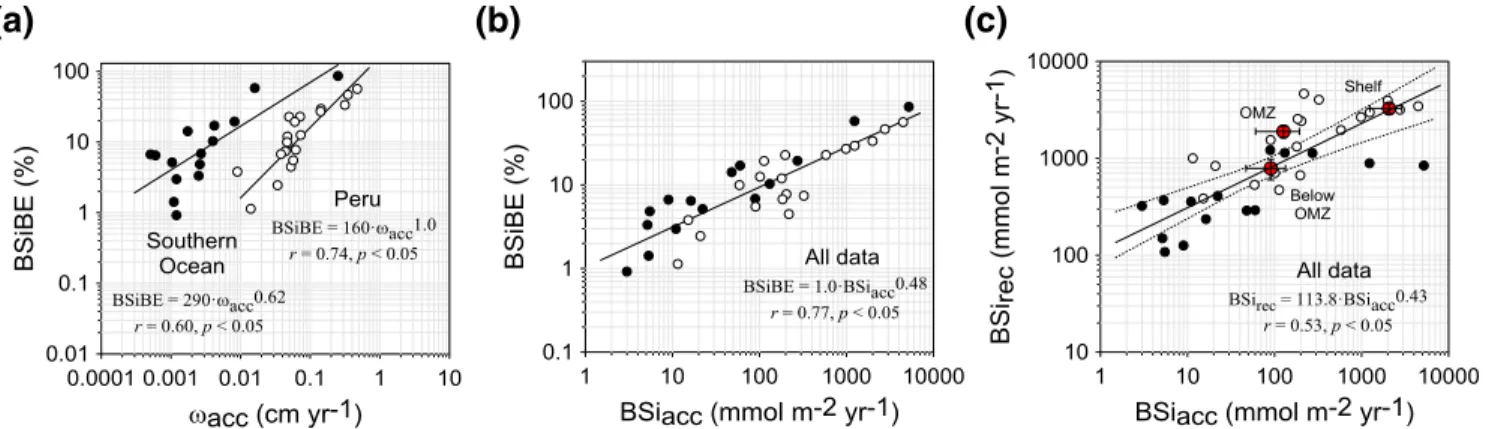
The relationship between BSiBE and ωacc at Peru can be approximated with a power law (Figure 4a). The exponent is > 0 and < 1, meaning that the rate of increase of BSiBE for a given increment in ωacc is highest at low ωacc. Similar observations were made by DeMaster (2003) for individual sites in the Ross Sea, which are reproduced in the figure with additional data from Southern Ocean sites along 170°W (Sayles et al., 2001;
black symbols). Values of ωacc at the majority of the Southern Ocean stations are 1–2 orders of magnitude lower than the Peruvian margin (Figure 4a, Table 1) due to their remoteness from major sediment sources.
While BSi preservation appears to correlate with ωacc in each region, it is obvious that ωacc by itself cannot be used to predict BSiBE at individual sites in the deep ocean and the Peru margin (cf. Ragueneau et al., 2000;
Sayles et al., 2001). The same applies to the MAR, whose global range is mainly determined by changes in ωacc (Equation 2).
DeMaster (2003) pointed out that higher rates of sediment accumulation decrease the residence time of BSi at the sediment surface where porewaters are undersaturated with regard to BSi solubility. Faster sedimen- tation promotes preservation because BSi is more rapidly transferred to the underlying saturated porewaters where further dissolution is thermodynamically inhibited and/or where dissolved Al concentrations begin to impede BSi dissolution (Rabouille et al., 1997). This effect is apparently more pronounced in the South- ern Ocean than Peru because, for a given ωacc, BSiBE is higher in the Southern Ocean. The explanation for this is probably related to the fact that the BSi content is several factors higher in the Southern Ocean (up to 92%) whereas at Peru it is more diluted with detritus and POC. Lower temperatures likely also contribute to slower BSi dissolution kinetics in the Southern Ocean. The effect of ωacc on BSi burial can be normal- ized by plotting the BSiBE against BSiacc. In doing so, the data from all sites adhere more closely to a single Figure 4. Log-log plots of data from individual sites on the Peruvian margin (open symbols) and the Southern Ocean (filled symbols, 170°W transect and Ross Sea, Table 1) with Pearson correlation coefficients (r) and regression curves. (a) BSiBE versus sedimentation rate, (b) BSiBE versus BSiacc, and (c) BSirec versus BSiacc (with 95% confidence intervals). The curve in (c) is an orthogonal regression to allow for interconversion between BSirec and BSiacc. The relationships are as follows (units mmol m−2 yr−1): BSirec = 113.8 BSiacc0.43 and BSiacc = 1.87 × 10⁻⁵ BSirec2.30. Note that BSirec and BSiacc in (c) are independent measurements. The mean Peru data for the shelf, OMZ, and below OMZ are shown as red symbols (labeled) and not included in the regressions (error bars are from Table 2).
(a) (b) (c)
relationship (Figure 4b). The results imply that BSiacc could be used to predict BSi preservation both in Southern Ocean deep waters and on the Eastern Tropical Pacific margin; two very different environments.
To a certain extent, a robust correlation between BSiBE and BSiacc is expected since the former is calculated from the latter. However, the observed correlation between BSirec and BSiacc, which are based on independ- ent measurements, supports the idea that BSi preservation is determined by the burial flux of BSi away from the undersaturated surface sediment layers (Figure 4c).
4.2. Low Burial Efficiencies Under Oxygen-Deficient Waters?
Few studies have discussed the role of bottom water oxygen levels on silica preservation even though low-ox- ygen upwelling areas may contribute up to 20% of BSi burial on the margins (DeMaster, 2019; Ragueneau et al., 2010). Berelson et al. (1987) determined a burial efficiency of ∼10% for sediments under low-oxygen waters in the California borderland basins (Table 1). Referring to earlier work, they alluded to higher BSi recycling fluxes under low oxygen conditions. When compared to the other sites in Table 1, the borderland basins do not exhibit enhanced BSi dissolution (see Figure 5 below). Low silica preservation under oxy- gen-deficient waters is perhaps counterintuitive. Diminished flushing of animal burrows (bioirrigation) ought to promote preservation by maintaining BSi saturation levels within the sediment. Similarly, low ox- ygen would help to preserve protective organic coatings on diatom frustules, slowing down dissolution (cf.
Hartnett et al., 1998; Holstein & Hensen, 2010). Yet, the depth-binned Peru data (Figure 4c, red symbols) ap- parently indicate that the quasipermanent anoxic OMZ sites have elevated BSirec for the derived BSiacc (i.e., low silica preservation under poorly ventilated bottom waters, see also Figure 5 below). The low BSi:POC weight ratios in the OMZ are consistent with this (Figure 2c); a feature exacerbated by the relatively high CBE (Figure 2d; Dale et al., 2015).
Based on the previous idea that BSiBE is determined by the rate at which BSi is buried below the under- saturated sediment layers, the rate of BSi dissolution at the sediment surface emerges as a key factor for preservation. Studies have shown that BSi dissolution decreases rapidly over the upper few centimeters where porewaters are undersaturated (Van Cappellen & Qiu, 1997b). Dissolution can be slowed down if highly reactive, fresh silica, deposited on the sediment surface is transported to deeper, saturated layers by rapid accumulation. Sedimentation rates are an almost an order of magnitude higher on the shelf compared to the OMZ where BSiBE are correspondingly lower. Similarly, the high BSiBE in the anoxic OMZ at 650 m depth in Guaymas Basin (56%, Table 1) is consistent with the exceptional accumulation rate of 180 cm kyr−1 that is comparable to the Peruvian shelf.
Analogous to burial, bioturbation distributes reactive particles to deeper sediment layers where BSi disso- lution is thermodynamically and/or kinetically inhibited (Ragueneau et al., 2001). Even very low rates of biodiffusive mixing can enhance the downward transport of particles (Schink et al., 1975). Sediments in the permanent OMZ at Peru lack large bioturbating organisms, whereas bioturbation on the shelf is inter- mittent depending on the local hydrographic conditions (Gutiérrez et al., 2009; Levin et al., 2002; Mosch et al., 2012). Mixing depths constrained by the 210Pbxs data decrease from median values of 7.6 cm on the shelf to 0.4 cm in and below the OMZ (Table S3). Higher rates of sediment accumulation and deeper surface mixing on the shelf are associated with elevated BSi preservation compared to sites in and below the OMZ with lower sediment accumulation rates and thinner mixed layers. A similar mechanism was proposed for the PAP site in Table 1 by Ragueneau et al. (2001). We conclude that differences in faunal composition and burial rates might play an important role in the fraction of BSi that is permanently buried on the Peruvian margin. This leads to spatial trends in BSi burial that differ greatly from POC that is preferentially preserved in the OMZ (Dale et al., 2015).
We consider that this interpretation is preliminary and tentative, and any potential direct role of oxygen versus sediment transport for BSi preservation is obfuscated by data uncertainties. Further mechanistic insight into the effect of O2 levels on BSi dissolution is required to fully understand what this entails for the interpretation of BSi accumulation rates and paleoproductivity in the sediment archive.
4.3. Regional Upscaling
The Si data from 11°S and 12°S can be used to provide a benthic Si budget for the margin (<1,000 m) from 3°S to 15°S, which encompasses the main upwelling cells of the Peruvian Humboldt Current Sys-
tem (Quiñones et al., 2002). For the analysis, the upper slope is divided into the shelf (0–200 m), OMZ (200–500 m) and below the OMZ (500–1,000 m) (Figure S1). We differentiate between the latitudinal bands north and south of 10°S on the basis of regional patterns in sediment type that result from the interaction of bottom currents and shelf morphology (Velazco et al., 2015). Upscaling is achieved by multiplying the mean fluxes in Table 2 with the corresponding seafloor areas. This approach is associated with high uncertainties regarding spatial and temporal variability of, for example, sediment type, primary production, and lateral transport of biogenic particles (see Ragueneau et al., 2001; Sayles et al., 1996). Sediment accumulation rates are also only characteristic on a ∼100-year-time scale (see Section 3). Nonetheless, it serves as a benchmark to compare BSi recycling and burial on the Peruvian margin with other regions.
The extrapolated fluxes show that Si cycling is dominated by the shelf due to its large area and the concen- tration of diatom assemblages close to the coast (Franz et al., 2012) (Table 3). The shelf accounts for 73% and 57% of the seafloor in the northern and southern sections, respectively, along with 98% of BSi accumulation and 87% of recycling. The mean BSi/POC burial weight ratio on the shelf (2.4) is somewhat lower than the ratio of 3.1 for a range of continental margin settings (DeMaster, 2002), yet drops dramatically to 0.34 in the OMZ. It indicates a weaker coupling between BSi and POC burial under oxygen-deficient waters compared to the shelf and the average continental margin.
Total BSi burial is 0.17 Tmol yr−1, which is higher than determined by DeMaster (1981) for the coast of Peru and northern Chile combined (0.1 Tmol yr−1). BSi burial might be lower than 0.17 Tmol yr−1 because the shelf broadens up to 130 km between 6°S and 10°S where the seafloor is swept clean of sediment by the poleward current (Reimers & Suess, 1983). The sand content increases to >60% at the expense of fine- grained particulates that are more prominently distributed below the shelf break (Velazco et al., 2015). If burial on the shelf north of 10°S is curtailed due to winnowing by bottom currents, total burial may be as low as 0.06 Tmol yr−1. Yet, mean core-top BSi contents measured at 28 stations on the upper slope along the Peruvian and Ecuadorian coastline down to 18°by Ehlert et al. (2012) are not significantly different (5.3 ± 2.9 vs. 9.5 ± 6.4, respectively (see also DeMaster [1981]). Our best estimate for BSi burial on the Peru- vian margin thus lies between 0.1 and 0.2 Tmol yr−1, depending on whether the sediments in the northern section accumulate BSi.
The global BSi burial flux on continental margins has been reported to be 2.7–4.1 Tmol yr−1 (DeMas- ter, 2019). Burial of unaltered BSi on the Peruvian margin, mainly on the shelf, can thus account for up to 7% of the total burial on margins. This is a nontrivial amount if it is characteristic of oxygen-deficient upwelling regions that occupy a few percent of the total margin area (Helly & Levin, 2004). Furthermore, if the mean BSiacc from the two sampling transects (760 mmol m−2 yr−1, Table 2) is integrated over the global
Shelf
(0–200 m) OMZ
(200–500 m) Below OMZ
(500–1,000 m) Σ
3°20'S-10o00'S
Area (km2) 52,629 10,304 8,747
Burial (Tmol yr−1) 0.109 0.001 0.001 0.11
Recycling (Tmol yr−1) 0.172 0.020 0.007 0.20
10°00'S-15°00'S
Area (km2) 26,983 12,388 7,694
Burial (Tmol yr−1) 0.056 0.002 0.001 0.06
Recycling (Tmol yr−1) 0.088 0.023 0.006 0.12
BSi/POC burial (molar)a 0.48 0.07 0.04
BSi/POC burial (weight) a 2.41 0.34 0.19
Note. Areas were calculated with Global Mapper software (see Figure S1). Fluxes refer to moles of Si.
aPOC burial fluxes are the mean fluxes for 11°S and 12°(Dale et al., 2015).
Table 3
Si Budget for the Peruvian Margin Between 3° 20' S and 15° 00' S
margin covered by accumulating muds (24.1 × 10¹² m2; Burdige, 2007), global burial would be 18 Tmol yr−1; several times higher than current estimates and clearly impossible. Taking instead the average of the sedi- ments below 200°m (∼110 mmol m−2 yr−1), burial would be 2.7 Tmol yr−1 and more in line with the global average. This leads us to conclude that the Peruvian shelf is an important hotspot of silica accumulation, whereas the deeper sediments are more representative of silica accumulation on the continental margins.
There may, therefore, be a need for global budgets of BSi accumulation in upwelling areas to distinguish between sediments underlying anoxic waters and adjacent shallower sediments receiving high amounts of diatomaceous detritus (DeMaster, 2019; Ragueneau et al., 2010).
4.4. Global Upscaling
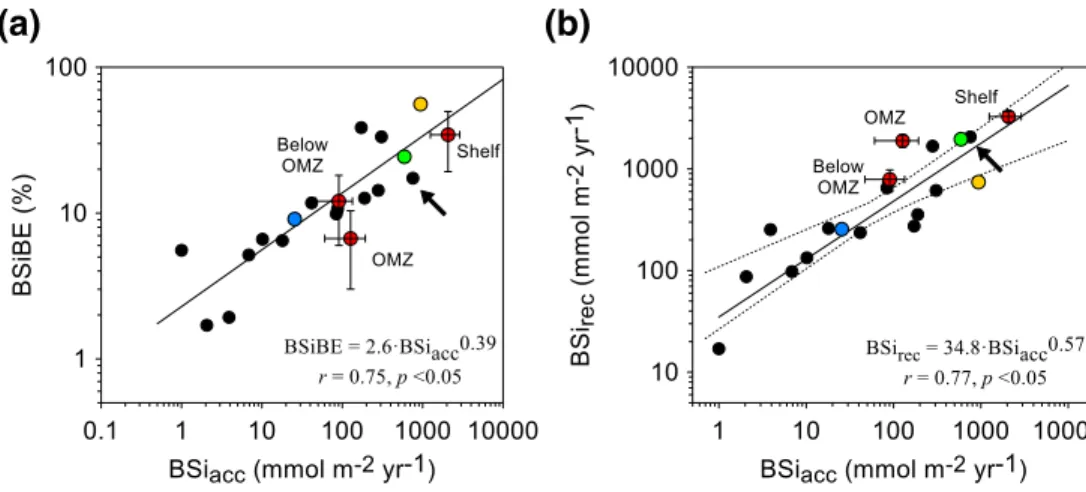
The following discussion takes a global perspective of the benthic silica budget using data from Peru and the sites in Table 1. Considered collectively, the same type of relationship as observed previously is found be- tween BSiBE and BSiacc and between BSirec and BSiacc (Figure 5) despite the range of applied methodologies, geochronologies, environmental parameters, and predepositional histories of BSi. It further implies that BSi preservation in the global ocean is mainly determined by a common set of master variables implicit in BSiacc. Spatial variability in the thermodynamic controls on BSi solubility (e.g., temperature, pressure, pH at the seafloor, and the degree of undersaturation with respect to the reacting solid) is apparently less important in driving global patterns of silica remineralization and burial. The global trends may be rationalized in terms of our previous discussion; higher rates of accumulation imply faster burial of “fresher” BSi with a high specific surface area and more rapid dissolution kinetics (Van Cappellen et al., 2002). This allows porewa- ters to reach local saturation closer to the sediment surface, preventing further dissolution and enhancing burial (Rabouille et al., 1997). The apparently low preservation in the Peruvian OMZ is again prominent in this global context (Figure 5b).
The close correlation between BSirec and BSiacc allows closure of the benthic Si budget with knowledge of either of these variables. From a paleoceanographic perspective, an understanding of the dependence of BSiRR on BSiacc is arguably more useful because BSiRR can be used to back-calculate primary production (e.g., Suess, 1980). It can be described as the following power law plotted in Figure 6:
Figure 5. Log-log plots of regional mean Si data from individual sites in Table 1 and for Peru (Table 2). (a) BSiBE versus BSiacc. Linear regression curve, equation, and Pearson correlation coefficient (r) are indicated. (b) BSirec versus BSiacc (with 95% confidence intervals). Note that BSirec and BSiacc are independent measurements with the exception of Dymond and Lyle (1994) (Table 1). The curve in (b) is an orthogonal regression to allow for interconversion between BSirec and BSiacc. The relationships are as follows (units mmol m−2 yr−1): BSirec = 34.8 BSiacc0.57 and BSiacc = 2.0 × 10⁻³ BSirec1.75. BSiBE can be calculated as BSiacc/(BSiacc + BSirec) × 100%. The mean Peru data for the shelf, OMZ, and below OMZ are shown as red symbols (labeled) and not included in the regressions (error bars are from Table 2). For our Peru data, only the mean data point (indicated by the arrow) is included in the regressions. Data for the Borderland basins (Berleson et al., 1987), Peru shelf (Froelich et al., 1988), and Guaymas Basin (Geilert et al., 2020) are shown as blue, green, and orange symbols, respectively.