1. Introduction
Anaerobic activity in the pelagic ocean plays a critical role in global biogeochemical cycles. Denitrifying metabolisms remove bioavailable (“fixed”) nitrogen from the water column (Codispoti & Richards, 1976;
Devol, 2008; B. B. Ward, 2013), potentially impacting rates of primary production (Oschlies et al., 2019).
Some of this nitrogen is lost as nitrous oxide (N2O), a potent greenhouse gas with a warming potential 200x that of CO2 (Ciais et al., 2013). Deoxygenation of the oceans due to global warming may lead to expansion of the anoxic zones where these metabolisms occur, potentially providing feedbacks to climate change (Ciais et al., 2013; Keeling et al., 2010; Oschlies et al., 2018). Therefore, understanding and accurately predicting anaerobic microbial activity at global scales is important for understanding and predicting the evolution of the climate.
Both physical and microbial processes drive the formation of anoxic zones and rates of nitrogen loss. Per- manently anoxic pelagic zones in the open ocean are characterized by the low ventilation of subsurface waters, where primary productivity at the surface may be relatively low or high (Fuchsman et al., 2019;
Luyten et al., 1983; Paulmier & Ruiz-Pino, 2009; Pennington et al., 2006; Wyrtki, 1962). A portion of the organic matter produced at the surface sinks into these subsurface waters. Aerobic heterotrophic organ- isms of all sizes consume and respire this organic matter using oxygen. Because of the weak ventilation, the oxygen supply to these subsurface areas is less than that demanded by the organisms, and so oxygen is depleted to nanomolar or lower levels, excluding all but microorganisms. At some threshold, anaerobic activity becomes energetically favorable, and some microorganisms use nitrate, nitrite, or sulfate rather than oxygen as an electron acceptor to respire the residual organic matter (Devol, 2008; Zumft, 1997). A
Abstract
Anaerobic microbial activity in the ocean causes losses of bioavailable nitrogen and emission of nitrous oxide to the atmosphere, but its predictability at global scales remains limited.Resource ratio theory suggests that anaerobic activity becomes sustainable when the ratio of oxygen to organic matter supply is below the ratio required by aerobic metabolisms. Here, we demonstrate the relevance of this framework at the global scale using three-dimensional ocean datasets, providing a new interpretation of existing observations. Evaluations of the location and extent of anoxic zones and a diagnostic rate of pelagic nitrogen loss are consistent with previous estimates. However, we demonstrate that a threshold based on substrate-supply fluxes is qualitatively different from a threshold based solely on the ambient oxygen concentration. This implies that use of the flux-based threshold in global biogeochemical models can result in different predictions of anaerobic activity and nitrogen loss.
Plain Language Summary
Where oxygen concentrations are sufficiently low in the ocean, nutrients are lost to the atmosphere because of specialized activity by microorganisms. Typically, biogeochemical models prescribe a critical oxygen concentration as a threshold to predict this activity.Here, we explain and demonstrate that an alternative threshold is more appropriate. The new threshold takes into account the supply flux of oxygen, rather than the concentration, as well as the supply flux of organic matter that is consumed by the microorganisms. We use global datasets to demonstrate that this threshold is relevant at the global scale. Since it is distinct from and more mechanistic than the typical oxygen concentration threshold, it may be used in global biogeochemical climate models to improve their ability to predict the loss of nutrients to the atmosphere and the impact on the climate system.
© 2021. The Authors.
This is an open access article under the terms of the Creative Commons Attribution-NonCommercial-NoDerivs License, which permits use and distribution in any medium, provided the original work is properly cited, the use is non-commercial and no modifications or adaptations are made.
Emily J. Zakem1 , Jonathan M. Lauderdale2 , Reiner Schlitzer3 , and Michael J. Follows2
1Department of Biological Sciences, University of Southern California, Los Angeles, CA, USA, 2Department of Earth, Atmospheric and Planetary Sciences, Massachusetts Institute of Technology, Cambridge, MA, USA, 3Alfred Wegener Institute, Bremerhaven, Germany
Key Points:
• We show that a threshold for anaerobic activity based on oxygen and organic matter fluxes is consistent with global ocean observations
• Our diagnostic calculation uses global datasets to define the three major pelagic anoxic zones in a new way
• The flux-based threshold is qualitatively different than a threshold based on the oxygen concentration
Correspondence to:
E. J. Zakem, zakem@usc.edu
Citation:
Zakem, E. J., Lauderdale, J. M., Schlitzer, R., & Follows, M. J. (2021).
A flux-based threshold for anaerobic activity in the ocean. Geophysical Research Letters, 48, e2020GL090423.
https://doi.org/10.1029/2020GL090423 Received 20 AUG 2020
Accepted 6 JAN 2021
portion of this respiration transforms fixed nitrogen species into gaseous forms, some of which is lost to the atmosphere. Chemoautotrophic metabolisms, both aerobic and anaerobic, are also key players. In gen- eral, heterotrophs oxidize the carbon in organic substrates but release the nitrogen at the same oxidation state, which chemoautotrophs then oxidize. Chemoautotrophic anaerobic ammonium oxidation (anam- mox) accounts for roughly a third of pelagic nitrogen loss (Babbin et al., 2014; Koeve & Kähler, 2010; B.
B. Ward, 2013).
However, the thresholds that drive the transitions from aerobic to anaerobic metabolisms are not well understood. The lack of a theoretical underpinning inhibits the extrapolation of the dynamics driving the observed phenomena to diverse environments. A dynamical understanding of these thresholds is critical for accurate prediction of nitrogen loss because of the dynamic nature of the processes. Despite the per- sistence of some anoxic zones, microbial communities in or near anoxic zones experience frequent oscil- lations in oxygen supply because physical transport is dominated by time-varying circulation (i.e., eddies and equatorial jets, Brandt et al., 2012; Oschlies et al., 2018; Pena-Izquierdo et al., 2015). Observations and experimental evidence suggest that communities have likely adapted to this dynamic state with facultative capabilities, high-oxygen affinity, and the ability to rapidly switch between aerobic and anaerobic respi- ration (Bristow et al., 2016; Dalsgaard et al., 2014; Kalvelage et al., 2015; F. J. Stewart et al., 2012; Tiano et al., 2014).
Resource ratio theory suggests that the transitions are controlled by the relative supply rates of oxygen to organic matter and other electron donors, and not strictly by the oxygen concentration (Smith, 1993; Til- man, 1982; Zakem et al., 2019). In previous work, we showed that for a given electron donor, the relevant threshold is the point where its supply rate relative to the oxygen supply rate meets the ratio required by aerobic metabolism (Zakem et al., 2019). Thus for the same low external oxygen concentration, respiration may be predominantly aerobic, predominantly anaerobic, or a combination of both aerobic and anaerobic, depending on the supply rates. This provides a hypothetical explanation for why aerobic and anaerobic metabolism can apparently co-occur, in addition to within-particle anoxia and vertical mixing (Bianchi et al., 2018; Karl et al., 1984; Zakem et al., 2019), and so may explain the oxygen consumption at the anoxic secondary chlorophyll maximum (Garcia-Robledo et al., 2017; Tiano et al., 2014). The framework applies to an aerobic and anaerobic pair competing for the same electron donor or to the activity of a facultatively aerobic population. In the complex microbial community, there are many competing metabolic demands for common substrates, such as the competition for ammonia by aerobic and anaerobic ammonia oxidation, as well as potentially for each of the thousands of organic compounds. In principle, a different threshold of oxygen to electron donor supply characterizes each of these interactions (Dalsgaard et al., 2014). Though the community metabolism is more complex, we here use its simple, average stoichiometry to explore the first-order controls on anoxic zone formation.
With broad brush strokes, we aim to connect the recently proposed theoretical framework, developed with mechanistic descriptions of microbial metabolism (Zakem et al., 2019), to observations of the global ocean. We test the theory with a diagnostic approach, using data-based gridded estimates of the relevant fluxes. We calculate the threshold for anaerobic activity in three dimensions using a climatology of oxy- gen concentrations, an inverse model estimate of ocean circulation, and an inverse model estimate of the sinking particulate organic carbon (POC) flux. The results delineate the volume of the ocean in which anaerobic metabolism is ecologically sustainable. Although this allows us to quantify global nitrogen loss, the main goal of this study is not a new and improved map of anoxic zones or global denitrification rate estimate. Rather, our goal is to first demonstrate the broad consistency between theory and observa- tions, and then to discuss how the flux-based threshold is qualitatively distinct from thresholds based on concentrations.
Our results imply that the flux-based model may be used in dynamic global biogeochemical models. In ad- dition to more mechanistically predicting the onset of anaerobic activity, this modeling strategy would allow stable aerobic respiration of organic matter in anoxic zones, supported by oxygen transport or local oxygen production at the secondary chlorophyll maximum. Consequentially, this could change model predictions of fixed nitrogen loss.
2. Methods
2.1. Theory: The Flux-Based Threshold for Anaerobic Activity in the Ocean
Here, we derive an expression for the conditions that allow sustained anaerobic activity in the ocean. Previ- ous work developed a theoretical model for the competition of aerobic and anaerobic metabolism (Zakem et al., 2019). The formulation accounts either for the literal competition between two obligate populations (one obligately aerobic, one obligately anaerobic), or for intracellular optimization for the more energet- ically favorable electron acceptor within one facultative population (Zakem et al., 2019). In a chemostat environment, the outcome of the competition depends on the ratio of the supply rate of oxygen to the supply rate of a mutually required electron donor, such as an organic substrate or ammonium. The ratio of this supply relative to the ratio demanded by the specified aerobic metabolism, a ratio of ratios, termed ϕ (Dutkiewicz et al., 2014; B. A. Ward et al., 2013; Zakem et al., 2019), determines whether a metabolism using an alternative electron acceptor can be sustained, even while the use of oxygen remains thermodynamically more efficient.
In the ocean environment, the physical transport of oxygen and organic substrate in three dimensions is relevant. The transports of each are decoupled because of the gravitational sinking of particulate organic matter. Using the metabolic descriptions in Zakem et al. (2019), we describe the rates of change of oxygen concentration (mmol m−3 O2) and POC, defined as detritus D (mmol m−3 C), as
2 2 2 2
advection diffusion microbial consumption
OO O
O B O O
t
u
(1)
advection diffusion
microbial consumption sinking
DO O DN N s ,
D B B D D w D
t z
u (2)
where BO and BN (mmol m−3 C) are the biomasses of aggregate microheterotrophic aerobic and anaerobic functional type populations, ij (t−1) is the specific uptake rate of substrate i by population j, u (m t−1) is the velocity, κ (m2 t−1) is the diffusion coefficient, and ws (m t−1) is the sinking rate of POC. The micro- bial biomasses may alternatively represent the fractions of one facultatively aerobic population (Zakem et al., 2019). For the pelagic subsurface, we assume that additional O2 consumed for the oxidation of dis- solved organic matter, ammonia, and nitrite is implicitly represented in these two equations, because to first order, all key reductants are derived from the sinking flux of POC.
We are interested in evaluating the incoming (gross) flux of O2 to a water parcel. This is because it is possible for aerobic populations to deplete O2 to their limiting subsistence concentrations (Zakem et al., 2019), and thus the incoming supply is relevant for the potential for anaerobic activity. Ultimately (below), we will ne- glect the outgoing oxygen flux from the water parcel. This is analogous to similar frameworks considering the depletion of inorganic nutrients by phytoplankton in the ocean surface (Dutkiewicz et al., 2014; B. A.
Ward et al., 2013). Following Dutkiewicz et al. (2014), we approximate Equations 1 and 2 by decomposing the physical transport into the three-dimensional gross incoming flux I (mmol m−3 t−1) and the gross out- going flux O (mmol m−3 t−1) as
O O O
adv diff in O adv diff out
2 2 2 2
t O OB I O
(3)
D
t DO OB DN NB ID OD
adv diff sink in adv diff sink out .
(4)
Assuming the steady state of Equation 3, which is a good first-order assumption for permanent anoxic zones (with additional complexity arising from time-varying circulation as we discuss below), we can ap- proximate the biomass associated with aerobic metabolism as
O2 O2
O2
1 .
O O
B I O
(5) Plugging Equation 5 into the steadystate version of Equation 4 gives an expression for anaerobic consumption:
O2 O2
O2DO .
DN N D D
O
B I O I O
(6) Therefore, for anaerobic biomass to be sustained (BN > 0), the right-hand side of Equation 6 must be posi- tive, and so
O2 O2
O2DO 1
D D
O
I O
I O
(7)
for sustained anaerobic activity.
We label the left-hand side of the conditional statement as ϕ. Redox chemistry links the uptake rates of oxygen and organic carbon, and so we represent them with ratio
O2O
DO
r (mol O2 consumed per mol C consumed). In the environment, r represents the requirements for aerobic oxidation by the aggregated het- erotrophic microbial community, and is similar to the “respiratory quotient,” the amount of CO2 produced per mol O2 respired (Robinson, 2008; Williams & del Giorgio, 2005).
We make two further simplifications. First, analogous to depleted inorganic nutrients in the surface (Dutk- iewicz et al., 2014), we neglect the outgoing supply of O2 from the water parcel. This is because in regions of interest, at the boundary where anaerobic metabolism becomes viable, oxygen is relatively low and likely to be consumed locally. We cannot neglect the outgoing supply of POC because its sinking happens at times- cales similar to or greater than the timescales of microbial growth, and thus sinking right through a water parcel of interest is likely, preventing its complete depletion at any one location. This gives ϕ as
1 O2 .
D D
r I
I O
(8) Second, we make the assumption that the three-dimensional divergence of the POC flux (ID − OD) is domi- nated by the sinking flux FPOC (mmol C m−2 t−1), and thus that
r I
FPOC
1 O2 ,
(9) where ∇ · FPOC (mmol C m−3 t−1) is the divergence of the sinking flux of POC.
The critical threshold is ϕ = 1. When ϕ < 1, the ratio of oxygen supply to available organic matter is lower than the ratio of demand by aerobic metabolism, and anaerobic metabolism is sustainable. When oxygen is supplied in abundance, aerobic metabolism can competitively exclude anaerobic metabolism, and only ox- ygen will be used to oxidize the electron donor. When the oxygen supply drops below the amount required for aerobic oxidation, anaerobic metabolism can access a portion of the electron donor. In this regime of sustained coexistence, the ratio of aerobic to anaerobic activity is proportional to the ratio of the supply of
oxygen to electron donor. Because of this coexistence, the zone designated by the threshold ϕ = 1 represents an upper bound on the zone of anaerobic activity.
2.2. Data-Based Calculation of ϕ
We use data-based estimates of oxygen supply, the POC flux, and the metabolic requirements of the bulk heterotrophic microbial community to evaluate ϕ in three dimensions in the ocean (Figure 1).
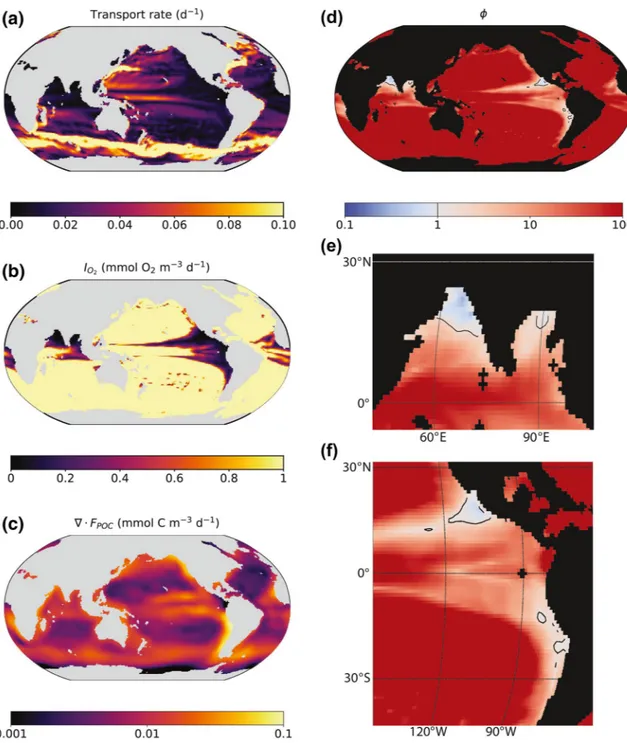
Figure 1. The flux-based criteria for anaerobic activity ϕ and its components at 270 m depth: (a) the bulk gross (incoming) transport rate of oxygen, analogous to a chemostat dilution rate for each water parcel (calculated as IO2O21) (b) the incoming flux of oxygen IO2, (c) the divergence of the sinking particulate organic carbon (POC) flux ∇ · FPOC from the inverse model of Schlitzer (2002), and (d–f) resulting ϕ (Equation 1), with the thin black line designating the threshold ϕ = 1. For clarity, we here plot solely the upper uncertainty bound on ϕ = 1 (see Figure 2 for detail). Panels (e) and (f) zoom in on the zones of viable anaerobic metabolism. Note the log scale.
We calculate the incoming oxygen flux IO2 (mmol O2 m−3 d−1) from ocean circulation and oxygen concen- trations. For the circulation, we use the Ocean Comprehensible Atlas (OCCA) state estimate of the annual mean ocean circulation (1° × 1° horizontal resolution with 50 depth levels; Forget, 2010) using routines similar to “the offline calculation” in Lauderdale et al. (2016) (see code). OCCA provides a dynamically plausible inverse estimate of advective and diffusive flows using the adjoint method. We include the im- pact of along-isopycnal eddy transport and mixing in the calculation of gross (incoming) transport rates (Figure 1a).
For oxygen concentrations, we use the World Ocean Atlas 2013 version 2 climatology of dissolved oxygen concentration (Garcia et al., 2013) (1° × 1° horizontal resolution with 102 depth levels), incorporating the correction scheme of Bianchi et al. (2012) for the systematic overestimate. Global standard error is 2%, but error increases for lower oxygen concentrations. We account for the 12% error of the concentrations less than 10 µM. This does not account for sampling bias that also contributes to a systematic overestimate of oxygen concentrations in anoxic zones in particular. We interpolate the oxygen climatology to match the vertical resolution of the transport, and then compute IO2 as the sum of all incoming fluxes of oxygen at the faces of each grid box (Figure 1b).
We estimate the divergence of the organic matter flux ∇ · FPOC (mmol C m−3 d−1) using the three-dimension- al gridded estimate of the POC flux from the inverse model of Schlitzer (2002) (experiment C). The model is on a non-uniform horizontal grid varying from 1° to 3° resolution with 21 depth levels (beginning at 133 m), and has a global export flux of about 10 GtC yr−1 (Schlitzer, 2002). We interpolate the values on the non-uniform horizontal grid to the uniform 1° × 1° grid of the oxygen flux, and retain the depth resolution.
Uncertainty in the POC fluxes ranges from 20% to 35%, although the lowest uncertainties are associated with the depths relevant to our conclusions (200–800 m) (Schlitzer, 2002). To overestimate the uncertainty at these depths, we incorporate the midpoint of 28% when propogating the errors. We consider the resulting divergence as a coarse estimate of the available organic carbon (Figure 1c).
The ratio of demand r reflects the chemical composition and stoichiometry of the organic matter being respired as well as the bulk growth efficiency of the heterotrophic microbial community (Robinson, 2008;
Williams & del Giorgio, 2005). We expect r to vary spatially and temporally with changes in community structure and function (Moreno et al., 2020), although r on average may be relatively stable (Tanioka &
Matsumoto, 2020). Here, we use the respiratory quotient for average algal material of 0.9 mol CO2 per mol O2 (Williams & del Giorgio, 2005), and incorporate a 10% uncertainty.
We evaluate ϕ in three dimensions using Equation 9. We interpolate the incoming oxygen supply to the depth resolution of the POC divergence. Our final calculation has a horizontal resolution of 1° × 1° and 20 vertical levels, with resolution in depth increasing from about 100 to 500 m. The shallowest resolved depth is 176 m, limited by the depth resolution of our POC flux estimate. We calculate upper and lower bounds for ϕ and N loss with propogation of error assuming linear (Taylor) expansion, incorporating an overall uncertainty of 32%.
3. Results and Discussion
Our data-based calculation of ϕ allows us to identify zones favorable for anaerobic metabolism in the wa- ter column as a function of the relative supply rates of oxygen and organic matter. Locations where ϕ < 1 should coincide with anaerobic activity and N loss within limits of uncertainties.
3.1. The 3D Calculation Identifies Major Anoxic Zones
Figure 1 shows ϕ and its components in the global ocean at 270 m depth. The incoming transport rate (cal- culated as IO2O21) is analogous to a chemostat dilution rate for each location, representing the rate of supply of oxygen (Figure 1a). Transport is low at low latitudes along the eastern continental boundaries. In idealized gyre circulation theory, these are the “shadow zones” that are not ventilated by access to the near- by surface (Luyten et al., 1983). Thus the incoming flux of oxygen is minimal in these zones (Figure 1b).
Simultaneously, the POC flux and its divergence (i.e., the inferred consumption of POC at that location) is
high in these areas because of the characteristic upwelling along eastern boundaries fuels surface production, subsequently fueling deep commu- nities with abundant organic substrate (Figure 1c).
Values of ϕ reach one or below at the locations known to have permanent anoxia (Figures 1d–1f). Both the high values of the POC divergence and the low values of the incoming oxygen flux contribute to the low val- ues of ϕ. The contour ϕ = 1 (white line) in Figure 2 identifies the three main pelagic anoxic zones: The eastern tropical North and South Pacif- ic (ETNP and ETSP) zones, and the northern Arabian Sea (Devol, 2008;
Ulloa et al., 2012). In these areas, POC availability exceeds the supply of oxygen necessary to oxidize all of it aerobically. The calculation does not show any areas with ϕ ≤ 1 in the Eastern Tropical Atlantic, where oxygen minimum zones are generally less intense (Paulmier & Ruiz-Pino, 2009), yet where anaerobic activity is known to occur (Kuypers et al., 2005). The calculation does show lower values of ϕ in these zones (Figure 1d), and so the lack of ϕ ≤ 1 here may reflect the unquantified uncertainties of our calculation discussed below.
Thus, our ϕ-based identification of the zones where anaerobic metab- olism is viable largely coincides with those inferred from a threshold oxygen concentration. Empirical identification utilizes measurements of oxygen concentration, or more directly, anaerobic microbial activity.
Nevertheless, the extent of the zones calculated with ϕ = 1 also reflects underlying uncertainties associated with the different components of our calculation. We discuss these uncertainties in the next section.
3.2. Estimation of Global N Loss
Using the resulting ϕ and the POC divergence, we can estimate the amount of bioavailable nitrogen lost via anaerobic activity. If all of the organic matter consumed in the volume with ϕ ≤ 1 were oxidized anaerobically, assuming the bulk esti- mated denitrification remineralization ratio rdenitrN C: of 104:106 of Gruber and Sarmiento (1997), a calculated average of 42 Tg N yr−1 would be lost from the ocean globally, with an uncertainty range of 17–102 Tg N yr−1. The ratio rdenitrN C: implicitly accounts for the amount of nitrogen that would be lost via the combination of heterotrophic denitrification and anammox, since it accounts for the complete oxidation of the organic carbon and nitrogen.
This estimate is consistent with, though at the lower end, of other estimates of global denitrification in the pelagic ocean, which range from 65 to 150 Tg N yr−1 (Bianchi et al., 2012; Codispoti, 2007; DeVries et al., 2013; Galloway, 2004; Gruber, 2008; Martin et al., 2019; Somes et al., 2013). Recent estimates using global models show a narrower and lower range, from 50 to 80 Tg N yr−1 (DeVries et al., 2013; Martin et al., 2019; Somes et al., 2013).
Our estimate is highly uncertain for multiple reasons. First, there are three large, unquantified uncertain- ties in the underlying datasets: (a) the oxygen climatology is most certainly an overestimate in low oxygen regions due to sampling bias and sparsity, given widespread measurements of nanomolar or lower oxygen concentrations in anoxic zones (Revsbech et al., 2009; Thamdrup et al., 2012), which contributes to higher ϕ and lower N loss. (b) Much of the time-varying circulation dominating the dynamics in the anoxic zones is not represented in the 1° × 1° circulation climatology. Also, (c) our calculation is limited to depths below 176 m due to our POC flux data set, and so does not account for N loss in shallower waters. In this sense, our calculation provides a lower bound on pelagic N loss.
Second, ϕ = 1 represents a threshold for the viable, stable coexistence of anaerobic metabolism, not nec- essarily the onset of dominant anaerobic activity. Where ϕ ≈ 1 at the periphery of the zones, a signifi- cant fraction of organic carbon and reduced nitrogen may still have been oxidized aerobically. Thus, when Figure 2. Data-based estimate of the zones of favorable anaerobic activity.
The white line designates ϕ = 1 (with uncertainty bounded by dashed white lines), overlaid on a climatology of dissolved oxygen concentrations (Garcia et al., 2013). For comparison, the gray line designates the contour [O2] = 10 mmol m−3. Top: At 270 m depth. Bottom: At 17°N in the eastern Pacific Ocean.
calculated accurately, ϕ = 1 can be interpreted as an upper bound on the volume in which anaerobic activity is dominant when neglecting the other uncertainties. Third, the calculation does not account for any systematic changes in parameter r due to changes in the average hetero- trophic growth efficiency. If the average growth efficiency decreases with depth, for example, as the quality of organic substrate decreases, then r will increase, and the anaerobic domain will be larger for the same nu- trient fluxes. Fourth, the actual anaerobic domain is broader because of the persistence of anaerobic activity in unsustainable locations because of vertical mixing (such as in the oxycline, Zakem et al., 2019) and with- in-particle anoxia (Bianchi et al., 2018; Karl et al., 1984). Indeed, Bianchi et al. (2018) estimated that particle anoxia amidst higher ambient oxygen concentrations may double pelagic denitrification. However, the utility of our calculation in this study is not providing a new number for global N loss, but rather, demonstration that the flux-based framework can identi- fy the well-known regions of persistent anaerobic metabolism, and thus be useful for future applications.
3.3. Organization of the Ocean by Resource Supply Ratios: A Dynamic Threshold
We use the components of ϕ to assemble a resource ratio diagram for aerobic versus anaerobic microbial metabolism in the ocean (Figure 3) (Tilman, 1982). The incoming oxygen flux IO2 is plotted against the divergence of the sinking POC flux ∇ · FPOC at each of the grid points, with the color indicating the corresponding oxygen concentration. The line ϕ = 1 delineates the flux ratio space in which anaerobic activity is favorable.
This illustrates how the multifactorial flux-based threshold controls anaerobic activity. For a given rate of oxygen supply, anaerobic activity may or may not be favorable. As organic matter availability increases, more oxygen is required to maintain exclusively aerobic activity.
The overall pattern in Figure 3 is similar to that of a prognostic biogeochemical model (Figure A2 in Zakem et al., 2019). However, for high POC divergences in Figure 3, the supply ratios from low oxygen environ- ments loosely track the ϕ = 1 line. This reflects in part that observed oxygen concentrations were used as one of the constraints in the adjoint method producing the POC flux (Schlitzer, 2000, 2002). Thus the POC flux and O2 climatology are not entirely independent, although O2 was only one of eight datasets used as a constraint (Schlitzer, 2002). Despite this correlation, our conclusions remain robust because we are showing that a novel arrangement of observed quantities is consistent with the theoretical framework, rather than making a quantitative prediction. Furthermore, in only a handful of locations does the oxygen concentra- tion reach below 1 µM in the climatology. If oxygen concentrations in the climatology reached the measured nanomolar concentrations (Revsbech et al., 2009), we would expect more points with ϕ ≪ 1 to fill the bot- tom third of the diagram (as in Figure A2 in Zakem et al., 2019).
3.4. The Flux-Based Threshold versus Oxygen Concentrations
Though broadly consistent, the flux-based threshold for the onset of anaerobic microbial activity is qualita- tively different from a threshold based on the external oxygen concentration. To demonstrate, we compare the ϕ = 1 contour (white line) to the [O2] = 10 µM contour (gray line) along a transect through the ETNP anoxic zone (Figure 2). The shape of the two contours is different: the ϕ = 1 area sits higher up in the water column. Unfortunately, the resolution and lower limit of the oxygen climatology do not allow us to compare the contours using the nanomolar concentrations of oxygen known to designate anoxic zones (Revsbech et al., 2009).
The difference in the ϕ = 1 and [O2] = 10 µM contours reflects that the flux-based threshold changes with depth despite consistently low ambient oxygen concentrations, according to the underlying data. This Figure 3. Resource ratio diagram of the delineation of favorable anaerobic
activity in the ocean using ϕ = 1. Incoming oxygen flux IO2 is plotted against the divergence of the sinking particulate organic carbon (POC) flux
∇ · FPOC for all grid points in the ocean at 176 m depth and below (1° × 1°
horizontal resolution with 20 depth levels). Color indicates the oxygen concentration.
implies a possibility that in the real ocean, some deeper portions of pelagic anoxic zones may exhibit a high- er frequency of aerobic activity amidst low-oxygen concentrations. Higher in the water column, the POC flux (and divergence) is higher, and so anaerobic activity is favorable. Lower in the water column, where the POC flux has attenuated, anaerobic activity may no longer be favorable. Thus, some deep regions of anoxic zones may contain predominantly aerobic respiration of organic matter, ammonium, and nitrite.
If this is the case, a model using only the oxygen concentration to govern the onset of anaerobic metabolism would overestimate anaerobic activity and N loss in these deep regions of anoxic zones. The flux-based threshold, in contrast, would allow a proportionate amount of aerobic activity in these regions, where the ratio of aerobic to anaerobic activity reflects the ratio of oxygen to POC supply. Therefore, global models employing the flux-based threshold may predict different amounts of fixed N loss.
4. Outlook
In the diagnostic calculation, microbial activity is implicitly represented. The divergence of the POC flux is due to heterotrophic microbial consumption, and the oxygen concentrations used to calculate the oxygen supply are low also because of heterotrophic consumption. Thus, the datasets contain correlations because these underlying processes (i.e., the consumption of organic matter and oxygen) are intertwined. Here, we use resource ratio theory to reveal these correlations and consistencies through a new lens.
In addition to representing a more mechanistic modeling strategy, our resource ratio framework is also ecologically relevant (Smith, 1993). The framework can be used to think about the activity of microbes in a small volume in the ocean or laboratory. The theory presented here was originally developed for microbial growth in a chemostat (Zakem et al., 2019), which suggests that when averaging over small periods of time or space, a population of facultatively aerobic cells may be partitioned into two fractions, one operating aerobically and the other anaerobically. On the smallest scale, we can use the framework to think about the activity of a single facultatively aerobic cell. The cell may opt to use oxygen or nitrate (or other electron acceptor) based on its possible utilization rates of oxygen and organic substrate, or potentially even use both oxygen and nitrate simultaneously (Chen & Strous, 2013).
Technically, of course, it is the oxygen concentration that microorganisms detect. However, according to resource competition theory, limiting concentrations are set by the physiological traits and ecological char- acteristics of the microorganisms themselves (F. M. Stewart & Levin, 1973; Tilman, 1982; Zakem & Fol- lows, 2016). These resource subsistence concentrations dictate the outcome of competition for substrate, while the substrate fluxes structure the community (Babbin et al., 2014; B. B. Ward et al., 2008; Zakem et al., 2019).
Application of our framework to prognostic biogeochemical models is the ultimate goal. Why did we here opt for the diagnostic calculation instead of a prognostic ecosystem model to demonstrate the flux-based threshold? Presently, our biogeochemical models are riddled with too many uncertainties in parameteri- zations to accurately estimate global N loss without tuning or incorporating data-based constraints. The parameterization of the sinking organic matter flux in particular remains limited. In contrast, the diagnostic calculation allows us to demonstrate the relevance of the flux-based framework directly and transparently, though still limited by the depth resolution of the sinking flux.
A fully prognostic ecosystem model resolves the consumption of substrate and subsequent growth and respiration by the heterotrophic populations. Consumption of oxygen by aerobic functional types depletes oxygen and creates the niche for the anaerobic types. A biogeochemical model that resolves the biomass of these functional types thus would allow quantification of the coexistence of aerobic and anaerobic activity (Zakem et al., 2019). Critically, this improvement in mechanistic representation of anaerobic activity could change model estimates of fixed N loss.
Furthermore, the accuracy of predictions should increase with spatial and temporal model resolution, as studies comparing the impact of model resolution on microbial productivity suggest (Lévy et al., 2001). A model with sufficiently high-resolution circulation (eddy-permitting) would allow for the investigation of how time-varying circulation impacts the competitive outcomes. For example, this could capture the impact of the advection of oxygenated water through multiple grid cells that exceeds the mixing times within each
cell, such as by equatorial jets (Brandt et al., 2012), leading to time-varying fluxes and concentrations. Spe- cifically, the competitive exclusion of anaerobic metabolisms when oxygen is replete requires a sufficient number of growth cycles. Therefore, intermittent supply of oxygen at timescales on par or shorter than microbial growth timescales may inhibit competitive exclusion and allow anaerobic metabolisms to persist in more oxygenated conditions, expanding the anaerobic domain.
Other studies have used the geochemical indicator N* to estimate global pelagic nitrogen loss (Deutsch et al., 2001; Gruber & Sarmiento, 1997). Our estimate of 42 Tg N yr−1 (range 17–102 Tg N yr−1) is somewhat quantitatively consistent with extrapolation using this method (65 ± 20 Tg N yr−1; Gruber, 2008). Each meth- od has its advantage. N* indicates where nitrate concentrations are lower than an assumed proportionality to phosphate concentrations, since nitrate and phosphate on average are coupled in the ocean due to universally similar biological requirements. Unlike ϕ = 1, N* in principle represents the actual loss of fixed nitrogen without the implicit overestimate due to stable coexistence. Also, the climatologies of nitrate and phosphate concentrations are more accurate than that of oxygen in anoxic zones, and so N* is not influenced by an oxy- gen sampling bias at low concentrations. However, N* does not precisely estimate the locations of fixed N loss because physical transport disperses the waters with depleted nitrate, and furthermore, N fixation confounds the signature. Thus, ϕ may more precisely identify the geography of N loss. Incorporation of the flux-based threshold into a dynamic global biogeochemical model could allow for a comparison of ϕ with the modeled N*, further elucidating how localized N loss impacts regional- and global-scale nutrient limitation.
The flux-based threshold represents a mechanistic description of the transition from aerobic to anaerobic activity. Accounting for anaerobic activity in this way in global biogeochemical models may change model predictions of fixed nitrogen loss. Coupled with accurate resolution of organic matter dynamics and phys- ical transport, this new framework can improve our understanding and predictions of anaerobic microbial feedbacks to changes in climate.
Data Availability Statement
The POC flux data set, links to the other datasets, and the model code created for the calculations are avail- able via Zenodo at doi. org/10.5281/zenodo.4416973.
References
Babbin, A. R., Keil, R. G., Devol, A. H., & Ward, B. B. (2014). Organic matter stoichiometry, flux, and oxygen control nitrogen loss in the ocean. Science, 344, 406–408. https://doi.org/10.1126/science.1248364
Bianchi, D., Dunne, J. P., Sarmiento, J. L., & Galbraith, E. D. (2012). Data-based estimates of suboxia, denitrification, and N2O production in the ocean and their sensitivities to dissolved O2. Global Biogeochemical Cycles, 26(2), GB2009. https://doi.org/10.1029/2011GB004209 Bianchi, D., Weber, T. S., Kiko, R., & Deutsch, C. (2018). Global niche of marine anaerobic metabolisms expanded by particle microenvi-
ronments. Nature Geoscience, 11, 263–268. https://doi.org/10.1038/s41561-018-0081-0
Brandt, P., Greatbatch, R. J., Claus, M., Didwischus, S. H., Hormann, V., Funk, A., et al. (2012). Ventilation of the equatorial Atlantic by the equatorial deep jets. Journal of Geophysical Research, 117, C12015. https://doi.org/10.1029/2012JC008118
Bristow, L. A., Dalsgaard, T., Tiano, L., Mills, D. B., Bertagnolli, A. D., Wright, J. J., et al.(2016). Ammonium and nitrite oxidation at nano- molar oxygen concentrations in oxygen minimum zone waters. Proceedings of the National Academy of Sciences, 113(38), 10601–10606.
https://doi.org/10.1073/pnas.1600359113
Chen, J., & Strous, M. (2013). Denitrification and aerobic respiration, hybrid electron transport chains and co-evolution. Biochim Biophys Acta, 1827, 136–144. https://doi.org/10.1016/j.bbabio.2012.10.002
Ciais, P., SabineBala, C. G., Bopp, L., Brovkin, V., Canadell, J., Chhabra, A., et al. (2013). Carbon and other biogeochemical cycles, In Hein- ze, C., Tans, P., Vesala, T. (Eds.), Climate change 2013 physics science basis contribution working group i to fifth assess rep. intergov. panel climate change (pp. 465–570). Cambridge and New York: Cambridge University Press.
Codispoti, L. A. (2007). An oceanic fixed nitrogen sink exceeding 400 Tg N a-1 vs the concept of homeostasis in the fixed-nitrogen inven- tory. Biogeosciences, 4(2), 233–253. https://doi.org/10.5194/bg-4-233-2007
Codispoti, L. A., & Richards, F. A. (1976). An analysis of the horizontal regime of denitrification in the eastern tropical North Pacific.
Limnology & Oceanography, 21(3), 379–388. https://doi.org/10.4319/lo.1976.21.3.0379
Dalsgaard, T., Stewart, F. J., Thamdrup, B., Dalsgaard, T., Stewart, F. J., Thamdrup, B.,et al. (2014). Oxygen at nanomolar levels reversibly suppresses process rates and gene expression in anammox and denitrification in the oxygen minimum zone off Northern Chile. mBio, 5(6), 14. e01966. https://doi.org/10.1128/mBio.01966-14
Deutsch, C., Key, R. M., Sarmiento, J. L., & Ganachaud, A. (2001). Denitrification and N2 fixation in the Pacific Ocean. Global Biogeochem- ical Cycles, 15(2), 483–506.
Devol, A. H. (2008). Denitrification including anammox. In D. G. Capone, D. A. Bronk, M. R. Mulholland, & E. J. Carpenter (Eds.), Nitrogen in the Marine Environment. 2nd ed. (pp. 263–301) Academic Press.
Acknowledgments
Emily J. Zakem was supported by the Simons Foundation Postdoctoral Fel- lowship in Marine Microbial Ecology.
Jonathan M. Lauderdale was supported by U.S. National Science Foundation (NSF #OCE-1259388). Michael J.
Follows was supported by the Gordon and Betty Moore Foundation (GBMF
#3778) and the Simons Foundation: the Simons Collaboration on Computation- al Biogeochemical Modeling of Marine Ecosystems (CBIOMES #549931). Data- sets used for this research are available in this in-text data citation reference:
Garcia et al. (2013), and referenced in these papers: Forget (2010) and Schlitzer (2002).
DeVries, T., Deutsch, C., Rafter, P. A., & Primeau, F. (2013). Marine denitrification rates determined from a global 3-D inverse model.
Biogeosciences, 10(4), 2481–2496. https://doi.org/10.5194/bg-10-2481-2013
Dutkiewicz, S., Ward, B. A., Scott, J. R., & Follows, M. J. (2014). Understanding predicted shifts in diazotroph biogeography using resource competition theory. Biogeosciences, 11, 5445–5461. https://doi.org/10.5194/bg-11-5445-2014
Forget, G. (2010). Mapping ocean observations in a dynamical framework: A 2004–06 ocean atlas. Journal of Physical Oceanography, 40, 1201–1221. https://doi.org/10.1175/2009JPO4043.1
Fuchsman, C. A., Palevsky, H. I., Widner, B., Duffy, M., Carlson, M. C. G., Neibauer, J. A., et al. (2019). Cyanobacteria and cyanophage contributions to carbon and nitrogen cycling in an oligotrophic oxygen-deficient zone. The ISME Journal, 13(4), 2714–2726. https://doi.
org/10.1038/s41396-019-0452-6
Galloway, J. N. (2004). Nitrogen cycles: Past, present, and future. Biogeochemistry. 70(2), 153–226. https://doi.org/10.1007/s10533-004-0370-0 Garcia-Robledo, E., Padilla, C. C., Aldunate, M., Stewart, F. J., Ulloa, O., Paulmier, A., et al. (2017). Cryptic oxygen cycling in anoxic marine
zones. Proceedings of the National Academy of Sciences, 114(31), 8319–8324. https://doi.org/10.1073/pnas.1619844114
Garcia, H. E., Locarnini, R. A., Boyer, T. P., Antonov, J. I., Mishonov, A. V., Baranova, O. K., et al. (2013). World Ocean Atlas 2013. Vol. 3:
Dissolved oxygen, apparent oxygen utilization, and oxygen saturation. National Oceanic and Atmospheric Administration Atlas NESDIS 75(3), 27. https://doi.org/10.7289/V5XG9P2W
Gruber, N. (2008). The marine nitrogen cycle: Overview and challenges. In D. G. Capone, D. A. Bronk, M. R. Mulholland, & E. J. Carpenter (Eds.), Nitrogen in the marine environment. 2nd ed. (pp. 1–50), Academic Press.
Gruber, N., & Sarmiento, J. L. (1997). Global patterns of marine nitrogen fixation and denitrification. Global Biogeochemical Cycles, 11(2), 235–266.
Kalvelage, T., Lavik, G., Jensen, M. M., Revsbech, N. P., Löscher, C., Schunck, H., et al. (2015). Aerobic microbial respiration in oceanic oxygen minimum zones. PloS One, 10(7). e0133526. https://doi.org/10.1371/journal.pone.0133526
Karl, D. M., Knauer, G. A., Martin, J. H., & Ward, B. B. (1984). Bacterial chemolithotrophy in the ocean is associated with sinking particles.
Nature, 309, 54–56. https://doi.org/10.1038/309054a0
Keeling, R. E., Körtzinger, A., & Gruber, N. (2010). Ocean deoxygenation in a warming world. Annual Review of Marine Science, 2, 199–229.
https://doi.org/10.1146/annurev.marine.010908.163855
Koeve, W., & Kähler, P. (2010). Heterotrophic denitrification vs. autotrophic anammox - quantifying collateral effects on the oceanic carbon cycle. Biogeosciences, 7, 2327–2337. https://doi.org/10.5194/bg-7-2327-2010
Kuypers, M. M., Lavik, G., Woebken, D., Schmid, M., Fuchs, B. M., Amann, R., et al. (2005). Massive nitrogen loss from the Benguela upwelling system through anaerobic ammonium oxidation. Proceedings of the National Academy of Sciences of the United States of America, 102(18), 6478–6483. https://doi.org/10.1073/pnas.0502088102
Lauderdale, J. M., Dutkiewicz, S., Williams, R. G., & Follows, M. J. (2016). Global biogeochemical cycles quantifying the drivers of ocean-atmosphere CO2 fluxes. Global Biogeochemical Cycles, 30, 983–999. https://doi.org/10.1002/2016GB005400.Received
Lévy, M., Klein, P., & Treguier, A. M. (2001). Impact of sub-mesoscale physics on production and subduction of phytoplankton in an olig- otrophic regime. Journal of Marine Research, 59(4), 535–565. https://doi.org/10.1357/002224001762842181
Luyten, J., Pedlosky, J., & Stommel, H. (1983). Climatic inferences from the ventilated thermocline. Journal of Physical Oceanography, 13, 292–309. https://doi.org/10.1007/BF02423489
Martin, T. S., Primeau, F., & Casciotti, K. L. (2019). Assessing marine nitrogen cycle rates and process sensitivities with a global 3-D inverse model. Global Biogeochemical Cycles, 33(8), 1026–1047. https://doi.org/10.1029/2018GB006088
Moreno, A. R., Garcia, C. A., Larkin, A. A., Lee, J. A., Wang, W. L., Moore, J. K., et al. (2020). Latitudinal gradient in the respiration quo- tient and the implications for ocean oxygen availability. Proceedings of the National Academy of Sciences of the United States of America, 117(37), 22866–22872. https://doi.org/10.1073/pnas.2004986117
Oschlies, A., Brandt, P., Stramma, L., & Schmidtko, S. (2018). Drivers and mechanisms of ocean deoxygenation. Nature Geoscience, 11, 467–473. https://doi.org/10.1038/s41561-018-0152-2
Oschlies, A., Koeve, W., Landolfi, A., & Kähler, P. (2019). Loss of fixed nitrogen causes net oxygen gain in a warmer future ocean. Nature Communications, 10(1), 1–7. https://doi.org/10.1038/s41467-019-10813-w
Paulmier, A., & Ruiz-Pino, D. (2009). Oxygen minimum zones (OMZs) in the modern ocean. Progress in Oceanography, 80, 113–128.
https://doi.org/10.1016/j.pocean.2008.08.001
Pena-Izquierdo, J., Van Sebille, E., Pelegri, J. L., Sprintall, J., Mason, E., Llanillo, P. J., et al. (2015). Water mass pathways to the North Atlan- tic oxygen minimum zone. Journal of Geophysical Research: Oceans, 120, 3350–3372. https://doi.org/10.1002/2014JC010557.Received Pennington, J. T., Mahoney, K. L., Kuwahara, V. S., Kolber, D. D., Calienes, R., & Chavez, F. P. (2006). Primary production in the eastern
tropical Pacific: A review. Progress in Oceanography, 69(2–4), 285–317. https://doi.org/10.1016/j.pocean.2006.03.012
Revsbech, N. P., Larsen, L. H., Gundersen, J., Dalsgaard, T., Ulloa, O., & Thamdrup, B. (2009). Determination of ultra-low oxygen concen- trations in oxygen minimum zones by the STOX sensor. Limnology and Oceanography: Methods, 7, 371–381. https://doi.org/10.4319/
lom.2009.7.371
Robinson, C. (2008). Heterotrophic bacterial respiration. In D. L. Kirchman (Ed.), Microbial Ecology of the Oceans. 2nd ed. (pp. 299–334) Wiley-Blackwell.
Schlitzer, R. (2000). Applying the adjoint method for biogeochemical modeling: Export of particulate matter in the World Ocean. Geophys- ical Monograph Series, 114, 107–124. https://doi.org/10.1029/GM114p0107
Schlitzer, R. (2002). Carbon export fluxes in the Southern Ocean: Results from inverse modeling and comparison with satellite-based estimates. Deep-Sea Research, 49, 1623–1644. https://doi.org/10.1016/S0967-0645(02)00004-8
Smith, V. H. (1993). Applicability of resource-ratio theory to microbial ecology. Limnology & Oceanography, 38(1), 239–249. https://doi.
org/10.4319/lo.1993.38.1.0239
Somes, C. J., Oschlies, A., & Schmittner, A. (2013). Isotopic constraints on the pre-industrial oceanic nitrogen budget. Biogeosciences, 10(9), 5889–5910. https://doi.org/10.5194/bg-10-5889-2013
Stewart, F. M., & Levin, B. R. (1973). Partitioning of resources and the outcome of interspecific competition: A model and some general considerations. The American Naturalist, 107(954), 171–198. https://doi.org/10.1086/282825
Stewart, F. J., Ulloa, O., & DeLong, E. F. (2012). Microbial metatranscriptomics in a permanent marine oxygen minimum zone. Environ- mental Microbiology, 14(1), 23–40. https://doi.org/10.1111/j.1462-2920.2010.02400.x
Tanioka, T., & Matsumoto, K. (2020). Stability of marine organic matter respiration stoichiometry. Geophysical Research Letters, 47(1), 1–10. https://doi.org/10.1029/2019GL085564
Thamdrup, B., Dalsgaard, T., & Revsbech, N. P. (2012). Widespread functional anoxia in the oxygen minimum zone of the Eastern South Pacific. Deep-Sea Research Part I Oceanographic Research Papers, 65, 36–45. https://doi.org/10.1016/j.dsr.2012.03.001
Tiano, L., Garcia-Robledo, E., Dalsgaard, T., Devol, A. H., Ward, B. B., Ulloa, O., et al. (2014). Oxygen distribution and aerobic respiration in the north and south eastern tropical Pacific oxygen minimum zones. Deep-Sea Research I, 94, 173–183. https://doi.org/10.1016/j.
dsr.2014.10.001
Tilman, D. (1982). Resource competition and community structure. Princeton, NJ, Princeton University Press.
Ulloa, O., Canfield, D. E., DeLong, E. F., Letelier, R. M., & Stewart, F. J. (2012). Microbial oceanography of anoxic oxygen minimum zones.
Proceedings of the National Academy of Sciences, 109(40), 15996–16003. https://doi.org/10.1073/pnas.1205009109 Ward, B. B. (2013). Oceans. How nitrogen is lost. Science, 341(6144), 352–353. https://doi.org/10.1126/science.1240314
Ward, B. A., Dutkiewicz, S., Moore, C. M., & Follows, M. J. (2013). Iron, phosphorus, and nitrogen supply ratios define the biogeography of nitrogen fixation. Limnology & Oceanography, 58(6), 2059–2075. https://doi.org/10.4319/lo.2013.58.6.2059
Ward, B. B., Tuit, C. B., Jayakumar, A., Rich, J. J., Moffett, J., & Naqvi, S. W. a. (2008). Organic carbon, and not copper, controls denitrifi- cation in oxygen minimum zones of the ocean. DeepSea Research Part I Oceanographic Research Papers, 55(12), 1672–1683. https://doi.
org/10.1016/j.dsr.2008.07.005
Williams, P. J. l. B., & del Giorgio, P. A. (2005). Respiration in aquatic ecosystems: History and background. In del Giorgio, P.
A., & Williams, P. J. l. B. (Eds.), Respiration in aquatic ecosystem (pp. 1–17) Oxford University Press. https://doi.org/10.1093/
acprof:oso/9780198527084.001.0001
Wyrtki, K. (1962). The oxygen minima in relation to ocean circulation. Deep Sea Research and Oceanographic Abstracts, 9, 11–23. https://
doi.org/10.1016/0011-7471(62)90243-7
Zakem, E. J., & Follows, M. J. (2016). A theoretical basis for a nanomolar critical oxygen concentration. Limnology & Oceanography, 62, 795–805. https://doi.org/10.1002/lno.10461
Zakem, E. J., Mahadevan, A., Lauderdale, J. M., & Follows, M. J. (2019). Stable aerobic and anaerobic coexistence in anoxic marine zones.
The ISME Journal, 14, 288–301. https://doi.org/10.1038/s41396-019-0523-8
Zumft, W. G. (1997). Cell biology and molecular basis of denitrification. Microbiology and Molecular Biology Reviews, 61(4), 533–616.