https://doi.org/10.5194/bg-16-4157-2019
© Author(s) 2019. This work is distributed under the Creative Commons Attribution 4.0 License.
Controls on redox-sensitive trace metals in the Mauritanian oxygen minimum zone
Insa Rapp1,a, Christian Schlosser1, Jan-Lukas Menzel Barraqueta1,2, Bernhard Wenzel1, Jan Lüdke1, Jan Scholten3, Beat Gasser4, Patrick Reichert1, Martha Gledhill1, Marcus Dengler1, and Eric P. Achterberg1
1Helmholtz Centre for Ocean Research Kiel (GEOMAR), Wischhofstr. 1–3, 24148 Kiel, Germany
2Department of Earth Sciences, Stellenbosch University, Stellenbosch, 7600, South Africa
3Institute of Geosciences, Christian-Albrechts-Universität zu Kiel (CAU), Otto-Hahn-Platz 1, 24118 Kiel, Germany
4International Atomic Energy Agency (IAEA), Environment Laboratories, 4 Quai Antoine 1er, 98012, Monaco
anow at: Department of Biology, Dalhousie University, Halifax, Nova Scotia B3H 4R2, Canada Correspondence:Insa Rapp (irapp@geomar.de)
Received: 5 November 2018 – Discussion started: 16 November 2018
Revised: 19 September 2019 – Accepted: 27 September 2019 – Published: 5 November 2019
Abstract. The availability of the micronutrient iron (Fe) in surface waters determines primary production, N2 fixa- tion, and microbial community structure in large parts of the world’s ocean, and thus it plays an important role in ocean carbon and nitrogen cycles. Eastern boundary up- welling systems and the connected oxygen minimum zones (OMZs) are typically associated with elevated concentrations of redox-sensitive trace metals (e.g., Fe, manganese (Mn), and cobalt (Co)), with shelf sediments typically forming a key source. Over the last 5 decades, an expansion and in- tensification of OMZs has been observed and this trend is likely to proceed. However, it is unclear how trace-metal (TM) distributions and transport are influenced by decreas- ing oxygen (O2) concentrations. Here we present dissolved (d;<0.2 µm) and leachable particulate (Lp;>0.2 µm) TM data collected at seven stations along a 50 km transect in the Mauritanian shelf region. We observed enhanced concentra- tions of Fe, Co, and Mn corresponding with low O2 con- centrations (<50 µmol kg−1), which were decoupled from major nutrients and nutrient-like and scavenged TMs (cad- mium (Cd), lead (Pb), nickel (Ni), and copper (Cu)). Ad- ditionally, data from repeated station occupations indicated a direct link between dissolved and leachable particulate Fe, Co, Mn, and O2. An observed dFe (dissolved iron) de- crease from 10 to 5 nmol L−1coincided with an O2increase from 30 to 50 µmol kg−1 and with a concomitant decrease in turbidity. The changes in Fe (Co and Mn) were likely driven by variations in their release from sediment pore wa-
ter, facilitated by lower O2 concentrations and longer resi- dence time of the water mass on the shelf. Variations in or- ganic matter remineralization and lithogenic inputs (atmo- spheric deposition or sediment resuspension; assessed us- ing Al as indicator for lithogenic inputs) only played a minor role in redox-sensitive TM variability. Vertical dFe fluxes from O2-depleted subsurface-to-surface waters (0.08–
13.5 µmol m−2d−1) driven by turbulent mixing and verti- cal advection were an order of magnitude larger than at- mospheric deposition fluxes (0.63–1.43 µmol m−2d−1; esti- mated using dAl inventories in the surface mixed layer) in the continental slope and shelf region. Benthic fluxes are there- fore the dominant dFe supply to surface waters on the conti- nental margins of the Mauritanian upwelling region. Overall, our results indicated that the projected future decrease in O2 concentrations in OMZs may result in increases in Fe, Mn, and Co concentrations.
1 Introduction
The micronutrient iron (Fe) is essential for phytoplankton growth, but due to biological uptake coupled with a low sol- ubility and low supply rates the availability of Fe is typically low in open ocean surface waters (Bruland and Lohan, 2006).
As a result, Fe limits primary production in high-nitrate low- chlorophyll regions (Boyd, 2007) and regulates dinitrogen (N2) fixation in (sub)tropical waters (Moore et al., 2009).
Alongside Fe, other trace metals (TMs) such as cobalt (Co), manganese (Mn), zinc (Zn), and copper (Cu) may (co-)limit phytoplankton growth and influence community composition (Browning et al., 2017; Moore et al., 2013; Morel and Price, 2003; Saito et al., 2008).
Oxygen minimum zones (OMZs) are characterized by sta- ble subsurface oxygen (O2) minima, which are maintained by a combination of enhanced O2consumption in the ther- mocline and a limited supply of O2-rich water masses (e.g., Brandt et al., 2015; Karstensen et al., 2008; Wyrtki, 1962).
Enhanced O2consumption is a result of elevated surface pro- ductivity caused by upwelling of nutrient-rich subsurface wa- ters in eastern boundary regions of the oceans through Ek- man divergence and intense remineralization of sinking par- ticles (e.g., Helly and Levin, 2004). Elevated organic matter supply and water column O2depletion lead to enhanced ben- thic release of redox-sensitive elements by influencing sedi- ment diagenetic processes (Noffke et al., 2012; Severmann et al., 2010). Elevated concentrations of sediment-derived dis- solved Fe, Co, and Mn have been associated with lateral off- shore advection in O2-depleted waters in the Arabian Sea and Pacific and Atlantic oceans (Biller and Bruland, 2013; Hatta et al., 2015; Hawco et al., 2016; Milne et al., 2017; Moffett et al., 2015; Noble et al., 2012).
Oxygen concentrations affect the distribution of redox- sensitive TMs by controlling oxidation rates and influencing microbially mediated redox transformations. The reduced forms of redox-sensitive TMs, such as iron (Fe(II)), cobalt (Co(II)), and manganese (Mn(II)), have a higher solubility in aqueous solutions than their oxidized forms (Fe(III), Co(III), Mn(III/IV)) (Liu and Millero, 2002; Stumm and Morgan, 1995). Reduction of these metals occurs to a large extent in anoxic sediment pore waters by microbial-induced disso- lution of particulate Fe(III) and Mn(III/IV) oxyhydroxides (Burdige, 1993; Chaillou et al., 2002; Froelich et al., 1979).
Sediment pore waters are released to overlying bottom wa- ters by diffusion and bio-irrigation and during submarine groundwater discharge (Beck et al., 2007; Elrod et al., 2004;
Green et al., 2002). In contact with O2 and other oxidants (e.g., nitrate; Schlosser et al., 2018; and hydrogen perox- ide; Moffett and Zika, 1987), Fe(II) oxidizes to the poorly soluble Fe(III) species, which are rapidly transformed into amorphous Fe oxyhydroxides or scavenged onto particle sur- faces (Moffett and Zika, 1987; Scholz et al., 2016; Wu and Luther, 1994). Mn(II) also oxidizes to insoluble Mn(III/IV) oxides, but due to the slow abiotic oxidation kinetics, es- pecially under low-O2 conditions (e.g., von Langen et al., 1997), biotic oxidation by manganese-oxidizing bacteria is the main oxidation mechanism for Mn (Moffett, 1994; Sunda and Huntsman, 1988; Tebo and Emerson, 1986). Co(II) re- moval is mainly associated with incorporation of Co into Mn oxides by Co co-oxidation (Moffett and Ho, 1996).
Stabilizing mechanisms that prevent removal by scaveng- ing and precipitation of Fe, Co, and Mn are organic ligand complexation (Elrod et al., 2004; Liu and Millero, 2002; Old-
ham et al., 2017; Parker et al., 2007) and adsorption onto small, slowly sinking or neutrally buoyant particles (Lam et al., 2012). Recent studies suggest a potentially impor- tant role for dynamic exchange processes between dissolved and particulate phases of Fe, thereby influencing cycling and transport (Achterberg et al., 2018; Fitzsimmons et al., 2017;
Labatut et al., 2014; Milne et al., 2017). This was further indicated by Fe isotope studies suggesting an equilibrium isotopic fractionation between the dissolved and particulate phases in deep waters (Labatut et al., 2014) and the con- comitant deepening of the dissolved and particulate Fe plume that originated from a hydrothermal vent (Fitzsimmons et al., 2017).
Spatial and seasonal variations in TMs that are released from sediments, as well as ex situ sediment incubation exper- iments, suggest a direct influence of bottom water and water column O2concentrations on the distribution of Fe, Co, and Mn (e.g., Biller and Bruland, 2013; Homoky et al., 2012).
Differences in benthic TM supply in field studies, however, suggest other factors such as sediment type, shelf topogra- phy, and organic matter supply also influence the benthic re- lease of TMs (Homoky et al., 2016). Ex situ sediment in- cubation experiments offer a potential means to disentangle the influence of O2concentrations relative to these controls (Homoky et al., 2012). These experiments, however, need to be interpreted within the context of the confined conditions that eliminate potentially important interactions in open sys- tems, such as seawater exchange and mixing. Furthermore, they offer no means to confidently evaluate controls on TM distributions in the pelagic water column.
In an attempt to resolve the controls on TM release and stabilization in OMZs we measured the concentration of a suite of TMs along a 50 km long transect on the Mauritanian shelf in the Eastern Tropical North Atlantic (ETNA). The Mauritanian shelf is associated with a major OMZ (minimum O2concentrations below 40 µmol kg−1; Brandt et al., 2015) and is an important Fe source to the North Atlantic Ocean (Milne et al., 2017). Furthermore, atmospheric dust deposi- tion from the Saharan desert can markedly elevate surface water Fe concentrations in the ETNA (Conway and John, 2014; Rijkenberg et al., 2012). Recent observations suggest a decline in O2content of the oceans, particularly in the north- ern and southeastern Atlantic, and an expansion of OMZs, modulated by the variability in our climate system (Hahn et al., 2017; Schmidtko et al., 2017; Stramma et al., 2008b).
These changes may result in changes in TM supply, and a mechanistic understanding of the factors regulating TM re- lease and stabilization in OMZs is therefore urgently needed.
The aim of this study was to evaluate the direct influence of variability in water column O2concentrations on the dis- tribution of redox-sensitive TMs and to identify responsible control mechanisms. Firstly, we assess the fluxes of dFe in the OMZ to surface waters by vertical advection and diffu- sive mixing and compared those to the atmospheric depo- sition flux of dFe. Secondly, we evaluate the importance of
redox and non-redox controls on Fe, Co, and Mn by focus- ing on the influence of O2and particles on the distribution of dissolved (d) and leachable particulate (Lp) TMs, including redox-sensitive (Fe, Co, and Mn) and nutrient type and scav- enged trace metals (aluminum (Al), lead (Pb), nickel (Ni), Cd, and Cu). Thirdly, we determine the influence of variabil- ity in the eastern boundary circulation and O2concentrations in regulating TM concentrations.
2 Methods 2.1 Sampling
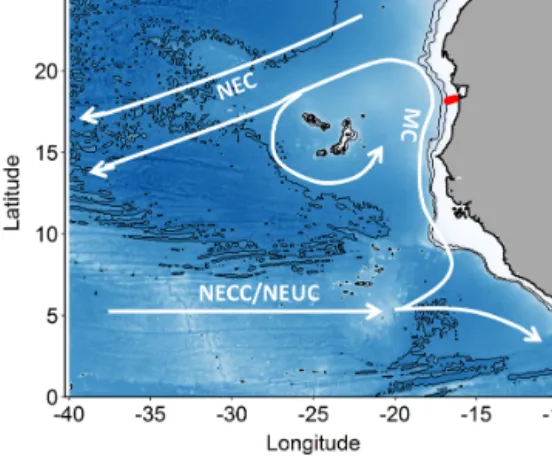
Samples were collected on RV Meteor cruise M107 in June 2014 during nine deployments at seven locations (two stations were occupied twice) along a cross-shelf transect at 18◦200N on the Mauritanian shelf in the ETNA (Fig. 1).
The bottom depths of stations varied between 50 m on the shelf to 1136 m furthest offshore. Seawater sampling was car- ried out using a trace-metal-clean CTD (TM-CTD, Sea-Bird SBE25) rosette frame equipped with 24 trace-metal-clean samplers (12 L, Ocean Test Equipment (OTE)). The CTD frame was attached to plastic-coated nonconductive steel ca- ble and deployed using a carousel auto-fire module (AFM, Sea-Bird) that closed the bottles at predefined depths. After recovery, the bottles were transferred to a clean-laboratory container and pressurized to 0.2 bar overpressure using fil- tered N2gas. Samples were collected unfiltered for total dis- solvable (TD) TM measurements and filtered using a 0.2 µm cartridge filter (Acropack 500, Pall) for dissolved (d) TMs and iodide. Trace-metal samples were collected in acid-clean 125 mL low-density polyethylene (LDPE) bottles (Nalgene), and iodide samples in opaque 60 mL high-density polyethy- lene (HDPE) bottles (Nalgene). Trace-metal samples were acidified to pH 1.9 using ultra-clean HCl (UpA, Romil) and stored (double bagged) for >6 months before preconcen- tration and analysis. Samples for iodide measurements were stored frozen at−20◦C until analysis.
Samples for the determination of radium isotopes (223Ra;
t1/2=11.4 d;224Ra;t1/2=3.7 d) were obtained using in situ filtration pumps (Challenger Oceanic) following the proce- dures described in Charette et al. (2015) and Henderson et al. (2013). Briefly, each in situ filtration pump was equipped with two particle filters (70 and 1 µm) and two Mn diox- ide (MnO2)-impregnated cartridges (CUNO Micro Klean III acrylic) on which dissolved Ra adsorbs. In this work,
224Ra/223Ra ratios are shown, which were analyzed from the first cartridge. The pumped water volumes varied be- tween 1000 and 1700 L and flow rates were 10–15 L min−1. For the determination of Ra in surface waters (∼5 m water depth), about 200–300 L of seawater was pumped into sev- eral 120 L plastic barrels followed by filtration over MnO2- coated acrylic fibers (Mn fibers).
Figure 1.Map of the study area. Stations along the transect dur- ing cruise M107 (June 2014) are displayed in red and major cur- rents with white lines (adapted from Brandt et al., 2015). MC rep- resents Mauritania Current; NEC represents North Equatorial Cur- rent; NECC represents North Equatorial Countercurrent; NEUC represents North Equatorial Undercurrent.
2.2 Trace-metal analysis
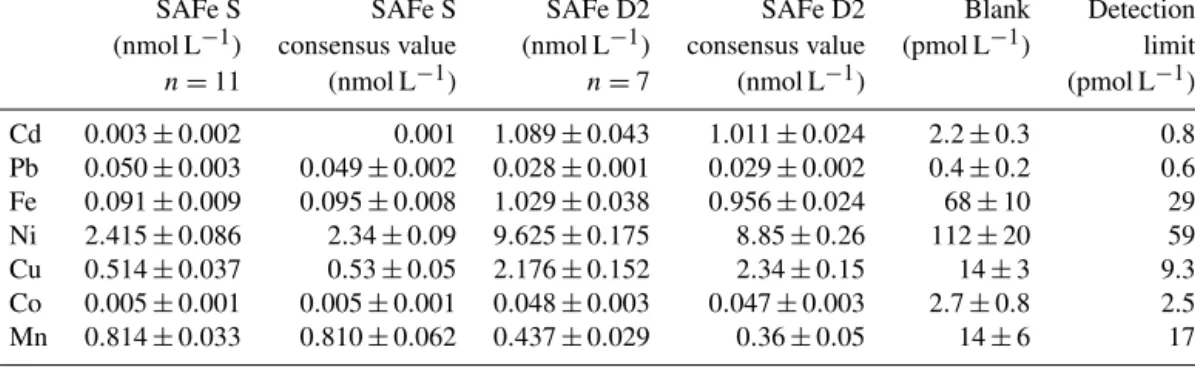
Determination of Co, Mn, Fe, Cd, Pb, Ni, and Cu was car- ried out as described in Rapp et al. (2017). Briefly, samples were preconcentrated using an automated preconcentration device (SeaFAST, Elemental Scientific Inc.) equipped with a cation chelating resin (WAKO; Kagaya et al., 2009). Sam- ples were UV digested prior to preconcentration to break- down metal–organic complexes, which would cause an un- derestimation of the determined TM concentrations. Sam- ples were in-line buffered to pH 6.4±0.2 using 1.5 M am- monium acetate buffer before loading onto the resin. The pH buffer was prepared using an ammonium hydroxide solu- tion (22 %, OPTIMA grade, Fisher) and acetic acid (glacial, OPTIMA grade, Fisher) in deionized water (Milli-Q, Milli- pore), adjusted to pH 8.5. Retained TMs were eluted from the resin using 1 M distilled HNO3 and collected in 4 mL polypropylene scintillation vials (Wheaton). The acid was distilled from supra-pure HNO3(SpA grade, Romil) using a sub-boiling perfluoroalkoxy polymer (PFA) distillation sys- tem (DST-1000, Savillex). Preconcentration was performed within a clean laboratory (ISO 5) and all sample and reagent handling was performed within the same laboratory in an ISO 3 laminar flow bench with a HEPA (high-efficiency par- ticulate air) filter unit. Preconcentrated samples were ana- lyzed by high-resolution inductively coupled plasma mass spectrometry (HR-ICP-MS, ELEMENT XR, Thermo Fisher Scientific) using isotope dilution for Fe, Cd, Pb, Cu, and Ni and standard additions for Co and Mn. SAFe (sampling and analysis of iron) reference seawaters S and D2 were analyzed with each analytical run and concentrations produced were in good agreement with consensus values (Table 1).
Table 1.Analyzed reference seawater, procedural blanks, and detection limits (3 times the standard deviation of the blank). Mean values and standard deviations for Cd, Pb, Fe, Ni, Cu, Mn, and Co as well as available consensus values (±1 standard deviation);nrepresents number of measurements.
SAFe S SAFe S SAFe D2 SAFe D2 Blank Detection
(nmol L−1) consensus value (nmol L−1) consensus value (pmol L−1) limit
n=11 (nmol L−1) n=7 (nmol L−1) (pmol L−1)
Cd 0.003±0.002 0.001 1.089±0.043 1.011±0.024 2.2±0.3 0.8
Pb 0.050±0.003 0.049±0.002 0.028±0.001 0.029±0.002 0.4±0.2 0.6 Fe 0.091±0.009 0.095±0.008 1.029±0.038 0.956±0.024 68±10 29 Ni 2.415±0.086 2.34±0.09 9.625±0.175 8.85±0.26 112±20 59 Cu 0.514±0.037 0.53±0.05 2.176±0.152 2.34±0.15 14±3 9.3 Co 0.005±0.001 0.005±0.001 0.048±0.003 0.047±0.003 2.7±0.8 2.5 Mn 0.814±0.033 0.810±0.062 0.437±0.029 0.36±0.05 14±6 17
Leachable particulate (Lp) concentrations were calculated as the difference between total dissolvable and dissolved con- centrations. The limit of quantification (LOQ) for the Lp concentrations was determined as the sum of the analyti- cal standard deviations of TD and dissolved concentrations.
Extended uncertainty calculations were performed using the Nordtest approach (Naykki et al., 2015) accounting for ran- dom as well as systematic errors (Rapp et al., 2017). The Lp fraction represents the particulate fraction which is readily dissolvable in the acidified samples during storage at pH 1.9 for 6 months and therefore does not contain any refractory particle components. This more labile fraction of particulate TMs mainly includes TMs in organic and/or biogenic par- ticles, adsorbed to particle surfaces, and TM oxides and/or oxyhydroxides (Hurst et al., 2010).
2.3 Aluminum measurements
Aluminum concentrations were determined in surface water samples for all stations along the transect and at two stations (stations 3 and 8) for the entire water column. Samples were analyzed for Al using the batch lumogallion method (Hy- des and Liss, 1976). Acidified samples were buffered man- ually with a 2 M ammonium acetate buffer (Romil, UpA) to a pH between 5.1 and 5.2. The buffer was prepared using ammonium hydroxide (Romil, UpA) and acetic acid (Romil, UpA) in deionized water (Milli-Q, Millipore). Buffered sam- ples were spiked with a 2 mg L−1lumogallion (TCI) solution allowing the complexing agent to be in excess. The lumogal- lion solution was prepared in 2 M ammonium acetate buffer (Romil, UpA). After spiking, samples were heated up for 1.5 h at 80◦C in an oven (Heratherm, Thermo Scientific) and left to cool down overnight at room temperature to allow the formation of a fluorescent Al complex. Samples were mea- sured using a fluorescence spectrophotometer (Cary Eclipse, Agilent). The samples were measured with excitation and emission wavelengths of 465 and 555 nm, respectively. The excitation and emission slits were set to 10 nm. The plas- tic cuvettes used for the measurements were precleaned in
a 2 M HCl (trace-metal grade, Fisher) for at least 24 h. In between samples, the cuvette was thoroughly rinsed with deionized water followed by actual sample. The same cuvette was used during an analytical session. All samples were ana- lyzed in duplicate and the concentrations calculated from the peak heights via standard addition. Samples and reagent nat- ural fluorescence was monitored by analyzing their content in the absence of the complexing agent. The standards were prepared in low-trace-metal seawater from a 500 nmol L−1 stock standard solution prepared from a 1000 ppm Al stan- dard solution (Merck Millipore). A typical calibration had the following standard concentrations: 0, 10, 20, 40, and 60 nmol L−1. GEOTRACES reference seawater (GS) was run with a mean average Al value of 27.76±0.17 nmol L−1 (n=4; consensus value 28.2±0.2 nmol L−1).
2.4 Iodide measurements
Frozen samples were defrosted overnight at room tem- perature prior to analysis for iodide by cathodic strip- ping square-wave voltammetry after Luther et al. (1988).
The voltammetry unit consisted of a voltammeter stand (663 VA, Metrohm), an autosampler (863 Compact Au- tosampler, Metrohm), and an automatic burette (843 Pump Station, Metrohm) for automated spike addition. The system was controlled by Computrace software (797 VA; Metrohm).
2.5 Oxygen, salinity, nutrient, turbidity, and chlorophyll fluorescence analyses
Oxygen, salinity, nutrients, turbidity, and chlorophyll fluores- cence were measured during 62 CTD deployments (includ- ing some repeated deployments at the same location) along the 18◦200N transect using a Sea-Bird SBE 9 CTD rosette system equipped with double sensor packages for O2, salin- ity, and temperature and 24 Niskin samplers (10 L; OTE).
Turbidity and chlorophyllawere measured with a combined WETlabs turbidity and fluorescence sensor that was attached to the CTD. The output of both sensors was corrected us- ing the calibration provided by the manufacturer. Through-
out this article, turbidity data are presented in nephelomet- ric turbidity units (NTU). The noise level of the sensor in our data set was found to be lower than 0.14 NTU. Oxy- gen sensor data were calibrated by Winkler titration (Hansen, 2007; Winkler, 1888; Sommer et al., 2015) on 348 discrete water samples that were collected from the OTE samplers.
Oxygen sensor data were initially processed using calibra- tion coefficients provided by the manufacturer. Subsequently, O2 sensor data were fitted to the O2 concentrations deter- mined by the Winkler titration method using linear functions for temperature, O2, and pressure (i.e., depth). An uncer- tainty of 1.5 µmol kg−1 was determined for O2 concentra- tions. Onboard nutrient measurements of nitrite (NO−2), ni- trate (NO−3), phosphate (PO3−4 ), and silicic acid (Si(OH)4) of the discrete water samples were conducted using a QuAA- tro autoanalyzer (Seal Analytical) according to the study by Grasshoff et al. (1983).
Apparent oxygen utilization (AOU) was calculated as the difference between saturation concentrations of O2and mea- sured O2concentrations. The saturation concentration of O2 was calculated after the Weiss methods (Weiss, 1970) using the R package marelac (Soataert et al., 2016), taking into ac- count salinity and temperature.
2.6 Radium analysis
Aboard the ship, the Mn cartridges and Mn fibers were washed with Ra-free tap water to remove any residual sea salt and particles. Ra was removed from the tap water by slowly (<1 L min−1) passing it through a Mn-fiber-filled cartridge. Afterwards, both cartridges and fibers were par- tially dried with filtered compressed air to remove excess wa- ter. The samples were analyzed for223Ra,224Ra, and228Th using a radium delayed coincidence counting (RaDeCC) sys- tem (Moore and Arnold, 1996). For the efficiency calibra- tion of the RaDeCC, 227Ac and 232Th standard solutions were used, and the calibration followed the procedure de- scribed in Scholten et al. (2010) and Moore and Cai (2013).
Counting errors were propagated following Garcia-Solsona et al. (2008). Excess 224Ra (224Raex), i.e., the224Ra activ- ity corrected for228Th-supported224Ra, was calculated by subtracting the 228Th activity from the 224Ra activity. The
228Th activity was measured 3 weeks after the first mea- surement of 224Ra, when the initial224Ra had decayed. As we measured only the first Mn cartridge and the Mn car- tridges do not adsorb radium quantitatively, we report here only224Raex/223Ra ratios.
2.7 Turbulence measurements and vertical flux calculations
In order to advance understanding of the role of benthic Fe supply to the productive surface waters of the upwelling re- gion, vertical diffusive fluxes (Eq. 1: left term, right-hand side) and wind-induced vertical advective fluxes (Eq. 1: right
term, right-hand side) were estimated. On the continental margin below the surface mixed layer, solutes are transferred vertically toward the near-surface layers by turbulent mixing processes and by vertical advection forced by Ekman diver- gence (e.g., Kock et al., 2012; Milne et al., 2017; Rhein et al., 2010; Steinfeldt et al., 2015; Tanhua and Liu, 2015):
Jz=Kz∂[TM]
∂z +w·1[TM]. (1)
Here, Kz is the turbulent eddy diffusivity (m2s−1),
∂[TM]/∂z the vertical gradient with depth (z) of the TM concentration [TM] (µmol m−4),1[TM] is a TM concentra- tion difference (µmol m−3), andwrepresents vertical veloc- ity (m s−1). Average advective and diffusive TM fluxes were calculated for a depth interval from the shallow O2-depleted waters to surface waters. The exact depth interval varied for each station (see Table S2) due to differences in the depths where TM samples were collected. The upper depth (8–29 m) was always in layers with enhanced chlorophylla fluores- cence, although for some stations the upper depth was below the surface mixed layer.
Diffusive Fe fluxes were determined by combining TM concentration measurements from the TM-CTD stations with nearby measured microstructure profiles. The microstruc- ture measurements were performed with an MSS90-D pro- filer (S/N 32, Sea & Sun Technology). The loosely tethered profiler was optimized to sink at a rate of 0.55 m s−1 and equipped with three shear sensors, a fast-response tempera- ture sensor, an acceleration sensor, two tilt sensors, and con- ductivity, temperature, depth sensors sampling with a lower response time. At TM-CTD stations with bottom depths less than 400 m, 18 to 65 microstructure profiles were available at each station. At deeper stations, 5 to 12 profiles were used.
Standard processing procedures were used to determine the rate of kinetic energy dissipation (ε) of turbulence in the water column (see Schafstall et al., 2010, for detailed de- scription). Subsequently, Kz values were determined from Kρ=0εN−2(Osborn, 1980), whereN is stratification and 0is the mixing efficiency for which a value of 0.2 was used.
The use of this value has recently been shown to yield good agreement between turbulent eddy diffusivities determined from microstructure measurements and from tracer release experiments performed in our study region (Köllner et al., 2016). The 95 % confidence intervals for station-averaged Kρvalues were determined from Gaussian error propagation following Schafstall et al. (2010). Finally, diffusive fluxes were estimated by multiplying station-averagedKρwith the vertical gradient of the respective TM solute, implicitly as- sumingKz=Kρ.
The vertical advective flux by Ekman divergence requires determination of vertical velocity in the water column that varies with depth and distance from the coastline. Convinc- ing agreement between vertical velocities derived from Ek- man divergence following Gill (1982) determined from scat- terometer winds and from helium isotope disequilibrium
within the Mauritanian and Peruvian coastal upwelling re- gions was found by Steinfeldt et al. (2015) (see their Fig. 4).
In their study, vertical velocities were parameterized as (Gill, 1982)
w= τy
ρf Lre−x/Lr, (2)
where τy represents the alongshore wind stress, ρ the density of sea water, x the distance from maximum Ek- man divergence taken here as the position at 50 m bot- tom depth on the shelf, and Lr the first baroclinic Rossby radius. The parameterization results from considering the baroclinic response of winds parallel to a coastline in a two-layer ocean (Gill, 1982). The baroclinic Rossby radius Lr=f−1
q
gρ2−ρρ 1HH1H2
1+H2 (ρ1/2 and H1/2 are density and thickness of the surface and lower layer, respectively) was found to be 15 km from hydrographical data collected dur- ing the cruise. Similar values were determined by Stein- feld et al. (2015) in the same region. Using average along- shore wind stress from satellite data (0.057 Nm−2, deter- mined from daily winds from Remote Sensing Systems AS- CAT C-2015, version v02.1 (Ricciardulli and Wentz, 2016) at 18◦22.50N, 016◦7.50W usingτy=ρairCdv2, wherevrep- resents alongshore wind, Cd is drag coefficient for which 1.15×10⁻³was used (e.g., Fairall et al., 2003), andρair is density of air) for June 2014, maximum vertical velocities of 3.7×10⁻⁵m s−1were determined for the shelf region (50 m water depth), which decayed offshore to 1.7×10⁻⁶m s−1at the position of the 1000 m isobath at 18◦N. As these vertical velocities describe the magnitude of upwelling at the base of the mixed layer, additional corrections need to be considered for deeper depths. Here, we approximated the vertical decay ofwas a linear function which diminishes at the ocean floor.
The calculation of the vertical advective flux supplying so- lutes from the shallow O2-depleted waters to surface waters requires knowledge of a concentration difference1[TM] as- sociated with the upwelling flux. Ideally, the vertical length scale over which the concentration difference is determined can be diagnosed as the TM concentration variance divided by its mean vertical gradient (e.g., Hayes et al., 1991). How- ever, in our study TM concentration time series data are not available. Previous studies have used a vertical length scale of 20 m to calculate the concentration differences between the target depth and the water below (e.g., Hayes et al., 1991;
Steinfeldt et al., 2015; Tanhua and Liu, 2015). For our cal- culations, we chose to use a smaller length scale of 10 m fol- lowing Hayes et al. (1991), which results in vertical advective TM flux presumably on the lower side of possible values.
2.8 Figures
All figures were produced in R (version 3.4.3). Data gridding in Figs. 2 and 3 was performed using the Tps function within the fields package in R (Nychka et al., 2016).
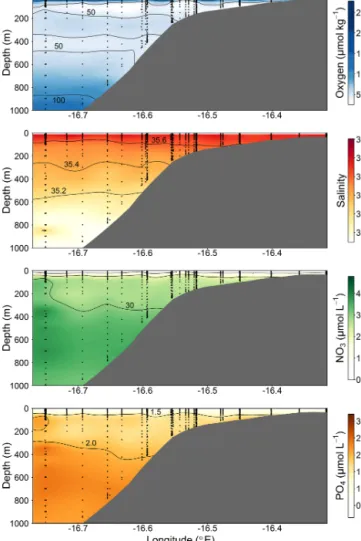
Figure 2. Section plots of oxygen (µmol kg−1), salinity (PSU), NO3(µmol L−1), and PO4(µmol L−1) along the transect off the Mauritanian coast in June 2014.
3 Results and discussion
3.1 Oceanographic settings of the study area
The cruise was conducted in June 2014 along a transect crossing a narrow shelf off the Mauritanian coast at 18◦200N.
The vertical structure of the OMZ in this region is character- ized by a deep OMZ at about 400 m depth and a shallow OMZ at about 100 m depth (Brandt et al., 2015). Coastal up- welling of nutrient-rich deep water occurs as a result of off- shore transport of surface waters caused by a northeast trade wind component parallel to the coast. While north of 20◦N upwelling persists throughout the year, upwelling south of 20◦N, including the Mauritanian upwelling region, under- goes seasonal changes in upwelling strength (Barton et al., 1998), with strongest upwelling occurring between Decem- ber and April. The seasonal variability is mainly driven by changes in wind forcing associated with the migration of the Intertropical Convergence Zone (Lathuilère et al., 2008).
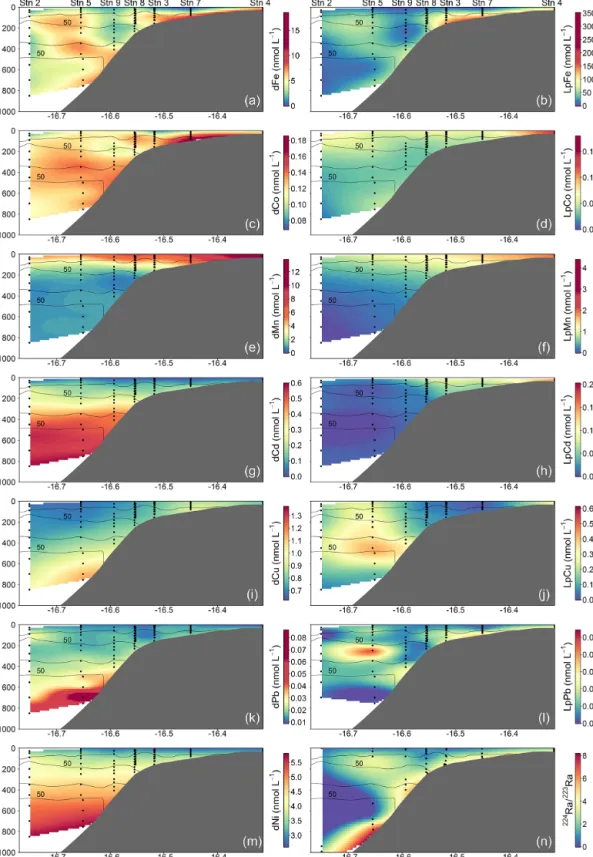
Figure 3.Spatial distributions of dissolved (d) and leachable particulate (Lp) trace metals and224Ra/223Ra across the Mauritanian shelf at 18◦200N in June 2014. Each sample location is indicated by a black dot and oxygen contours at 50 µmol kg−1enclosing the upper and lower OMZ are displayed with black contour lines.
During the cruise period, cold upwelled waters with temper- ature less than 20◦C were still present on the shelf and upper continental slope (Thomsen et al., 2019, their Fig. 1) indicat- ing active upwelling.
The eastern boundary circulation consists of the Mauri- tania Current (MC, Fig. 1) flowing poleward at the surface against the equatorward winds and of the poleward undercur- rent (PUC) flowing in the same direction at depths between 50 and 300 m (Barton, 1989; Klenz et al., 2018; Mittelstaedt, 1983; Peña-Izquierdo et al., 2015). Both currents supply cold, O2- and nutrient-rich waters of predominantly South Atlantic origin (South Atlantic Central Water, SACW) to the coastal upwelling region (e.g., Mittelstaedt, 1991, 1983;
Peña-Izquierdo et al., 2015). In response to the changing winds, the eastern boundary circulation likewise exhibits a pronounced seasonal variability (Klenz et al., 2018; Stramma et al., 2008a). The strongest poleward flow is observed dur- ing the relaxation period between May and July when along- shore, upwelling-favorable winds weaken but wind stress curl is at its maximum (Klenz et al., 2018). During the up- welling season in boreal winter, the circulation more closely resembles the classical eastern boundary circulation regime, with a weak PUC flowing beneath an equatorward coastal jet (Klenz et al., 2018; Kounta et al., 2018). At deeper levels (300–500 m depth), flow was found to be equatorward during both seasons. The shallow (<300 m depth) boundary circu- lations turn offshore at the southern flank of the Cape Verde frontal zone (CVFZ) (e.g., Tomczak, 1981; Zenk et al., 1991) at about 20◦N, separating SACW from more saline and O2- rich central waters formed in the North Atlantic (NACW).
The circulation in June 2014 was typical for a relaxation pe- riod characterized by strong poleward flow over the shelf and the upper continental slope between the surface and 250 m depth (Klenz et al., 2018; Thomsen et al., 2019). During the later parts of the cruise, the core of the MC moved off- shore and reduced poleward flow was observed near the shelf break. Periods of elevated northward flow on the Mauritanian shelf inhibits the onshore near-bottom supply of low oxygen but nitrate-rich waters onto the shelf with consequences for benthic nitrogen cycling (Yücel et al., 2015).
Meridional sections of water mass properties and O2con- centrations from around 18◦N showed that waters with an enhanced SACW proportion advected from the south as well as NACW coming from the north have higher O2 concen- trations than the ambient waters (Klenz et al., 2018). The mixture of SACW and NACW waters found in the thermo- cline particularly during boreal winter, previously identified as a regional water mass and termed the Cape Verde SACW (SACWcv) by Peña-Izquierdo et al. (2015), is a signature of an older water mass with lower O2 concentrations than those of SACW or NACW due to a longer residence time and O2 consumption through remineralization. Elevated pelagic oxygen consumption levels at the Mauritanian continental margin were recently determined by Thomsen et al. (2019).
During the transition period in May through to July, upper
central waters (50–300 m depth) are dominated by SACW accounting for 80 %–90 % of the water masses in the bound- ary current region (Klenz et al., 2018).
The SACW transported poleward within the bound- ary circulation is supplied by the zonal North Equatorial Counter Current (NECC) and North Equatorial Undercur- rent (NEUC), which flow eastward at about 5◦N (Brandt et al., 2015) before diverging into a northward and a southward flowing branch in front of the African coast.
As a result of interactions between tidal currents, topog- raphy, and critically sloping upper continental slope topog- raphy (e.g., Eriksen, 1982), the Mauritanian upwelling re- gion is known for elevated nonlinear internal wave activity resulting in enhanced mixing in the water column of the up- per slope and shelf region (Schafstall et al., 2010). Vertical fluxes of nutrients driven by mixing processes are amongst the largest reported in literature, although lower than in the Celtic Sea (Tweddle et al., 2013) and the lower St. Lawrence estuary (Cyr et al., 2015).
The CTD and microstructure deployments were performed along the east–west transect in the period 8 to 27 June (2014) (Fig. 1). Oxygen concentrations reached a deep minimum of 40–50 µmol kg−1at about 400 m and a shallow minimum of 30–50 µmol kg−1at about 50–100 m (Fig. 2), which is in agreement with previous studies (Brandt et al., 2015; Thom- sen et al., 2019). Mixed layer depths ranged from 10 to 22 m during the cruise. Salinity was highest at the surface (ca.
36.02) and generally decreased with depth to a minimum of 34.71 at around 1000 m. Nitrate (NO−3) concentrations in the surface mixed layer varied between 0.1 and 11.3 µmol L−1 and phosphate (PO3−4 ) between 0.15 and 0.91 µmol L−1. NO−3 and PO3−4 concentrations increased with depth to a maximum of 47.6 and 3.2 µmol L−1, respectively (Fig. 2).
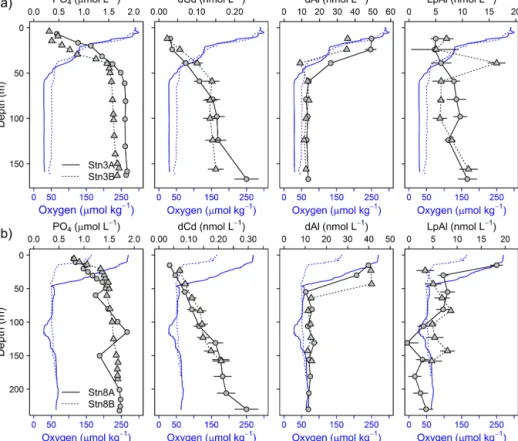
Over a time period of 19 d, two trace-metal stations along the transect at water depths of 170 m (18.23◦N, 16.52◦W;
first deployment: 12 June; second deployment: 21 June) and 189–238 m (18.22◦N, 16.55◦W; first deployment: 24 June;
second deployment: 26 June) were reoccupied. Minimum O2concentrations of 30 µmol kg−1observed before 15 June increased to 50 µmol kg−1 after 19 or 24 June, depending on the location. This oxygenation event, captured in ocean glider measurements, is discussed in detail by Thomsen et al. (2019). Variability in oxygen concentrations observed fur- ther offshore was attributed to physical transport of SACW into the region (Thomsen et al., 2019). In contrast, closer to the coast, enhanced pelagic oxygen consumption rates were determined that significantly contribute to the vari- ability in observed oxygen concentrations (Thomsen et al., 2019). Short-term variability in oxygen concentrations has also been observed further south in nearshore Senegalese wa- ters where an anoxic event was likely attributed to the off- shore advection of a decaying diatom bloom (Machu et al., 2019).
The sediments in the study area contain a large amount of carbonate, biogenic silica, and quartz (Hartman et al., 1976). The fraction of sand and mud varies largely depend- ing on bottom depth, with sand comprising between 7 % and 70 % of the dry weight (Dale et al., 2014). The particulate organic carbon (POC) content varies between 0.55 wt % at shallow depth (66 and 90 m) and increases to 3.3 wt % at 1108 m depth (Schroller-Lomnitz et al., 2019). A more de- tailed description of the sediments underlying our study re- gion and sediment parameters collected on the same cruise, including Fe(II) concentrations and Fe/Al ratios, are given in Schroller-Lomnitz et al. (2019).
3.2 Spatial distributions of dissolved and leachable particulate trace metals
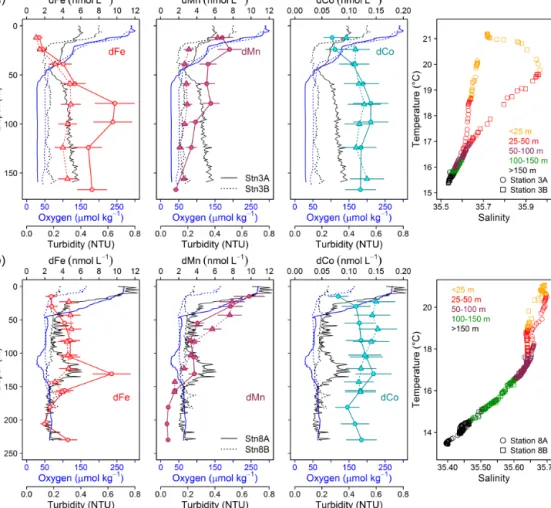
Dissolved Fe and LpFe concentrations ranged between 0.97–
18.5 and 1.6–351 nmol L−1, respectively (Fig. 3a, b). Sur- face waters (5–29 m) had lowest dFe (0.97–4.7 nmol L−1) and LpFe (1.6–35.9 nmol L−1) concentrations, whereas high- est concentrations were present on the shelf close to the seafloor (up to 18.5 nmol L−1dFe and 351 nmol L−1LpFe).
Enhanced concentrations of both Fe fractions at any given station were observed at depths with low O2 concentra- tions (30–60 µmol O2kg−1). A similar distribution pattern was observed for dCo, with concentrations between 0.069 and 0.185 nmol L−1 (Fig. 3c). In contrast, LpCo concentra- tions varied from below the limit of quantification (LOQ) up to 0.179 nmol L−1and were generally highest in surface waters and close to the coast (Fig. 3d). Compared to dFe, the concentration range of dCo was much narrower and en- hanced concentrations were observed over a broader depth range and further offshore.
Surface dFe and dCo concentrations were low, presum- ably due to enhanced biological uptake. No clear increas- ing trend in dFe and dCo with depth was observed, indicat- ing that processes other than, or in addition to, remineraliza- tion influenced their distributions. Elevated concentrations were found close to the sediments and within low-O2 wa- ters. This suggested a benthic source of Fe and Co under O2- depleted conditions and offshore transport along O2-depleted water filaments, which is in agreement with previous studies (e.g., Baars and Croot, 2015; Hatta et al., 2015; Noble et al., 2012). Our sharper onshore–offshore gradient of dFe con- centrations compared to dCo in O2-depleted waters shows that oxidation and removal mechanisms or scavenging rates were faster for Fe than Co (Noble et al., 2012). Previously reported dFe concentrations in coastal regions of the tropi- cal North Atlantic were lower than we observed, between 0.5 and 6.3 nmol L−1(Hatta et al., 2015; Milne et al., 2017; Wut- tig et al., 2013). However, all these samples were collected at a greater distance from the coast. In the near-coastal Ore- gon and Washington shelf bottom water dFe concentrations were similar to our study under equivalent O2 concentra- tions (18.7–42.4 nmol L−1dFe, 42–61 µmol kg−1O2; Lohan
and Bruland, 2008), whereas in the euxinic waters from the Peruvian shelf region, dFe concentrations were more than an order of magnitude higher, exceeding 200 to 300 nmol L−1 (Schlosser et al., 2018; Scholz et al., 2016). Similar dCo concentrations to our study were observed in the North At- lantic and South Atlantic, with highest concentrations of
∼0.16 nmol L−1present within O2-depleted waters (Noble et al., 2012, 2017).
Dissolved Mn concentrations ranged between 0.46–
13.8 nmol L−1 and LpMn from below the LOQ to 4.4 nmol L−1(Fig. 3e, f). Highest dMn and LpMn concentra- tions were observed in surface waters, generally decreasing with depth. Additionally, concentrations were highest on the shelf and decreased offshore. The dMn concentrations were generally elevated within and below the deeper O2-depleted waters with 0.70–1.34 compared to 0.46–0.91 nmol L−1just above. The increased dMn concentrations within the deeper O2-depleted waters (∼350–500 m depth) indicate a benthic source, similar to Fe and Co, which is in accordance with previous studies (Noble et al., 2012). However, in the shal- low O2-depleted waters (∼50–200 m depth), this effect is not resolvable due to high surface concentrations, which were maintained by photo-reduction of Mn oxides to solu- ble Mn(II) that prevents loss of Mn from solution (Sunda and Huntsman, 1994). Reported dMn concentrations in the North Atlantic and South Atlantic were lower than in our study, with concentrations<3.5 nmol L−1in surface waters and around 0.5–1 nmol L−1dMn within the OMZ (Hatta et al., 2015; Noble et al., 2012; Wuttig et al., 2013). As for dFe, these lower reported values can also be explained by sam- pling stations positioned at further distance from the coast and removal of dMn via biological oxidation processes with distance from the source (Moffett and Ho, 1996).
Dissolved Cd and Ni concentrations were lowest in surface waters with 0.022–0.032 nmol Cd L−1 and 2.6–
2.8 nmol Ni L−1 and showed an increasing trend with depth to maximum values of 0.60 and 5.8 nmol L−1, respectively (Fig. 3g, m). Leachable particulate Cd concentrations were from below the LOQ to 0.20 nmol L−1, and LpNi concentra- tions from below the LOQ to 1.7 nmol L−1. A large fraction of Ni (72 %–100 %) was present in the dissolved form. The majority of LpNi samples were below the LOQ (>70 % of the data) and LpNi is therefore not included in Fig. 3. LpCd concentrations were highest close to the coast and decreased offshore (Fig. 3h). In surface waters close to the coast the LpCd fraction was dominant with up to 84.3 % of the en- tire Cd pool (d+Lp). The fraction of LpCd in surface wa- ter beyond the shelf break (including stations 2, 1, and 9) contributed still up to 54.3 % of the Cd pool, whereas below 50 m only 0 %–12.8 % of TDCd was in the Lp phase beyond the shelf break. In contrast to Fe, Co, and Mn, no increases in Cd and Ni were observed near the seafloor and within the O2-depleted waters indicating that Cd and Ni concen- trations are mainly controlled by remineralization of sinking organic matter, which is typical for these two nutrient-like
TMs (Biller and Bruland, 2013). Similar distributions with concentrations between 0 and 1000 m water depth ranging from∼2 to 5.5 and from∼0 to 0.55 nmol L−1for dNi and dCd, respectively, were observed during the GEOTRACES transect GA03_w in the tropical North Atlantic (Mawji et al., 2015; Schlitzer et al., 2018).
Dissolved Cu concentrations in surface waters ranged be- tween 0.63 and 0.81 nmol L−1 (Fig. 3i). Concentrations in- creased with depth to around 1.37 nmol L−1at 700 m depth close to the seafloor, whereas highest observed concentra- tions further offshore were 0.95 nmol L−1 at the greatest sampled depth of 850 m. These results indicate that in ad- dition to remineralization processes of sinking biogenic par- ticles, the distribution of Cu is influenced by inputs from the seafloor. This is in accordance with previous studies, sug- gesting that Cu is released from continental shelf sediments under oxic and moderately reducing conditions (Biller and Bruland, 2013; Heggie, 1982), whereas no increase in Cu concentrations near the seafloor was observed at low bot- tom water O2concentrations (O2<10 µmol L−1; Johnson et al., 1988). A decrease in Cu concentrations in the bottom boundary layer was also reported with a seasonal decrease in O2 in summer from a minimum of 70 µmol L−1O2in May to 40 µmol L−1O2in August, suggesting a decrease in sedi- mentary release of Cu (Biller and Bruland, 2013). In strongly reducing sediments and the presence of H2S, Cu forms inor- ganic sulfides and precipitates, which may explain reduced sedimentary Cu release under low bottom water O2concen- trations (Biller and Bruland, 2013). Therefore, the sediment source of dCu might show a different dependency on bottom water O2concentrations than dFe, dCo, and dMn explaining the distinct distribution of dCu. Concentrations of LpCu were from below the LOQ to 0.61 nmol L−1with enhanced levels at station 4 close to the coast and at mid-depths of the three stations furthest offshore (9, 5, and 2) (Fig. 3j).
Observed dPb concentrations were lowest in the surface waters at 9–14 pmol L−1 and increased with depth to 29–
86 pmol L−1below 600 m depth (Fig. 3k). Lead is not con- sidered a nutrient-like TM (e.g., Boyle et al., 2014), but our observations indicate a release of Pb from sinking parti- cles following remineralization. The concentration range and depth distribution is similar to reported distributions further offshore at about 21◦W (Noble et al., 2015). These authors suggested that increased concentrations of up to 70 pmol L−1 between 600 and 800 m depth were related to the influence of Mediterranean Outflow Waters (MOW). Additionally, in- creased Pb concentrations in proximity to sediments have been attributed to the benthic release of historic Pb through reversible scavenging from particles and the release of dPb associated with Fe/Mn oxyhydroxides during reductive dis- solution of those oxides in anoxic sediments (Rusiecka et al., 2018). The major source of Pb to the ocean is atmospheric dust deposition from anthropogenic emissions (Bridgestock et al., 2016; Nriagu and Pacyna, 1988; Véron et al., 1994) with a recent indication of reduced anthropogenic Pb inputs
to surface waters in the eastern tropical Atlantic under the north African dust plume (Bridgestock et al., 2016). Low surface-water concentrations on the Mauritanian shelf indi- cate low atmospheric inputs of Pb to this region. LpPb was from below the LOQ to 27 pmol L−1and the distribution of LpPb was similar to that of LpFe, with subsurface maxima within O2-depleted waters (Fig. 3l), and this may indicate in- creased scavenging of dPb in these layers, which might be associated with Fe-containing particles.
In general, sediment-derived TM concentrations decrease with distance from the shelf and with time that passed since the water mass has been in contact with the sediments due to water mass mixing and removal processes such as precipita- tion and scavenging (Bruland and Lohan, 2006). Radium iso- topes can be used as a tracer for benthic sources. The major source of Ra to the ocean is input from sediments through the efflux of pore water, sediment resuspension, and submarine groundwater discharge (Moore, 1987; Moore and Arnold, 1996; Rama and Moore, 1996). Due to the distinctive half- lives of the different Ra isotopes (e.g.,224Ra (t1/2=3.66 d) and223Ra (t1/2=11.4 d)) and their conservative behavior in seawater, it is possible to quantify the time that has passed since a parcel of water was in contact with the sediments us- ing the following equation by Moore (2000):
A224 A223
obs
= A224
A223
i
e−λ224τ
e−λ223τ (3)
and solved for water mass age (τ )
τ= ln
A224 A223
obs
−ln A224
A223
i
λ223−λ224
, (4)
whereA224/A223 is the activity ratio of 223Ra and 224Ra, with the subscript obs for the observed seawater ratio and the subscriptifor the initial groundwater endmember ratio, andλ223andλ224are the decay constants in units of per day (d−1) for223Ra and224Ra. The ratio224Ra/223Ra is not af- fected by dilution assuming there is no mixing with waters having significantly different224Ra/223Ra ratios.
Highest224Raex/223Ra activity ratios were observed close to the seafloor (Fig. 3n). The average224Raex/223Ra ratio in proximity to the sediment source (<2.60 m above seafloor) was 4.9±1.5 and was similar to the reported ratios for shelf waters off South Carolina (224Raex/223Ra=4.4±1.5;
Moore, 2000). The 224Raex/223Ra ratios decreased away from their benthic source due to decay (224Raex/223Ra=0–
0.5 in surface waters). Ratios close to the seafloor were rela- tively constant along the transect at bottom depths<600 m, whereas dFe, dCo, and dMn concentrations varied largely in the bottom samples. This suggests that factors, which are not influencing the Ra distribution, impacted the distributions of dFe, dCo, and dMn, with a likely influence of enhanced O2 concentrations reducing sediment release or increasing removal rates of these metals at water depths between 200
and 400 m. At around 800 m bottom depth, 224Raex/223Ra ratios were slightly elevated and coincided with increased dCo, dFe, dMn, and dCu concentrations despite O2concen- trations>70 µmol kg−1. This suggests that the enhanced TM concentrations at this location were influenced by a strong sediment source which may be related to the presence of a benthic nepheloid layer as indicated by an increase in turbid- ity in proximity to the seafloor. An elevated 224Raex/223Ra ratio of 3.5±0.6 was observed at about 16.65◦N and 80 m water depth (bottom depth 782 m) and coincided with a lo- cal maximum of dFe, dMn, and dCo and reduced O2con- centrations. These observations indicate that the waters with the local maximum of dFe, dMn, and dCo have been in rel- atively recent contact (12–20 d assuming initial pore water
224Raex/223Ra ratios between 18 and 38; Moore, 2007) with sediments, likely originated from south of our transect as a result of a strong poleward flow (Klenz et al., 2018), and the dynamic current system in this region can cause local and short-term variability in the transport of sediment-derived TMs.
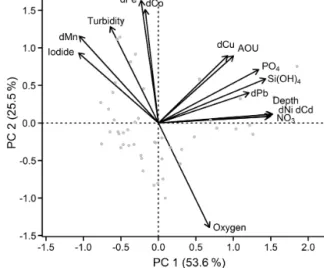
3.3 Classification of different groups of trace metals based on principal component analysis
Principal component analysis (PCA) was performed (using the RDA function within the vegan package in R; Oksa- nen et al., 2018) to investigate different groups and corre- lations in the data set. Dissolved TMs (Fe, Mn, Co, Ni, Pb, Cu, and Cd), nutrients (silicic acid, nitrate, and phosphate), dissolved O2, apparent oxygen utilization (AOU), depth, and iodide concentrations (Supplement Fig. S1) were utilized in the PCA. Radium data were not included in the PCA as the number of available data points for224Raex/223Ra was much lower than for the other parameters. Surface waters shallower than 50 m were excluded from the PCA to remove the influ- ence of localized atmospheric deposition and photochemical processes, which in particular influence Mn and iodide dis- tributions. The PCA generated three principal components (PC) with eigenvalues larger than 1, with PC1 explaining 53.6 % and PC2 25.5 % of the total variance in the data set (together 79.1 %). Inclusion of PC3 in the analysis explained only 6.8 % more of the variance.
The first PC group is formed by dCd, dCu, dNi, and dPb (Fig. 4), which are associated with depth, AOU, nitrate, and phosphate. This indicates that the distributions of Cd, Cu, Ni, and potentially Pb are controlled by organic matter reminer- alization processes. This is in agreement with strong Pearson correlations, R >0.9, for the relationships of dCd and dNi with depth, nitrate, and silicic acid (Supplement Table S1).
Weaker correlations with major nutrients were observed for dPb (R >0.6) and dCu (R >0.4), potentially due to addi- tional remineralization or removal mechanisms for these el- ements (e.g., prior atmospheric inputs and water mass trans- port, Pb; sediments, Cu and Pb; and scavenging). The second group of TMs is composed of dFe, dCo, and dMn that are as-
Figure 4.Principal component analysis of the Mauritanian shelf data set. Principal component loadings for each variable are indi- cated by black vectors. Component scores of each sample are indi- cated as gray circles. Loadings and scores have been scaled sym- metrically by square root of the eigenvalue.
sociated with elevated iodide and turbidity, and low dissolved O2 (Fig. 4). Iodide (I−) is the reduced form of iodine (I), which is typically present as iodate (IO−3) in oxygenated sub- surface water. Both I forms are present as soluble anions in seawater. Due to a relatively high redox potential (pE∼10), iodine is one of the first redox-sensitive elements to undergo reduction under suboxic conditions, and is therefore a use- ful indicator for active reductive processes (Rue et al., 1997).
Despite their role as micronutrients, Fe, Mn, and Co do not correlate with nutrients indicating that processes other than remineralization controlled their distributions.
The anticorrelation with O2 (also shown in Fig. S2) and correlation with iodide support the notion that Fe, Co, and Mn distributions were strongly influenced by water column O2concentrations, presumably through (i) enhanced benthic metal fluxes from anoxic sediments and (ii) decreased oxida- tion rates in the overlying water column under O2-depleted conditions. This is also supported by elevated benthic Fe(II) fluxes observed at the seafloor within the shallow OMZ, with benthic fluxes of 15–27 µmol m−2d−1(Schroller-Lomnitz et al., 2019).
Variability in the redox-sensitive metals, Fe, Mn, and Co, was not fully explained by either O2 or iodide concentra- tions; Pearson correlations with O2were−0.55,−0.61, and
−0.58, respectively (Supplement Table S1). As shown be- fore, other factors such as water mass mixing and age, the amount and type of particles present, and remineralization all likely impact their dissolved concentrations. Consequently, such a complex chain of factors and processes means that one variable alone is unlikely to explain the behavior of Fe, Mn, and Co.
3.4 Influence of the different sources of Fe, Mn, and Co The main sources of TMs in our study region are sedimentary release and atmospheric dust deposition (e.g., Rijkenberg et al., 2012). Also, release of TMs via organic matter reminer- alization may have an important influence on the distribution of TMs. In the following, we discuss the relative influence of remineralization, atmospheric dust deposition, and sedi- mentary release on the supply of Fe, Co, and Mn to surface waters.
3.4.1 Remineralization
To quantify the influence of remineralization for dFe, we employed dFe-to-carbon (dFe/C) ratios (carbon was cal- culated using AOU, with an AOU/carbon ratio of 1.6;
Martin et al., 1989). Surface data, where O2 was over- saturated (due to biological O2production), were excluded.
Dissolved Fe/C ratios for the entire transect varied be- tween 15 and 74 µmol mol−1. These results agree with those for shelf-influenced waters with dFe/C ratios of 13.3–
40.6 µmol mol−1further south at 12◦N (Milne et al., 2017).
Reported ratios for the North Atlantic, further away from the shelf were lower and ranged between 4 and 12.4 µmol mol−1 (Fitzsimmons et al., 2013; Milne et al., 2017; Rijkenberg et al., 2014). To estimate the amount of dFe being de- rived by remineralization, we assume a dFe/C ratio of 4–
12 µmol mol−1from organic matter remineralization, similar to the observed dFe/C ratios in the open ocean close to our study area without a strong shelf influence. These offshore ratios may still be influenced by an atmospheric source of dFe, which would result in an overestimation of dFe/C ra- tios from remineralization and thereby an overestimation of the fraction of remineralized dFe. Apart from additional in- puts, the dFe/C ratios are influenced by the respective Fe/C stoichiometry in the sinking organic matter and removal of dFe by scavenging. Furthermore, it is not clear if the offshore ratios can be transferred to a location close to the coast, as the balance between remineralization and scavenging processes might be different due to differences in phytoplankton pro- ductivity and particle load. Hence, this approach only pro- vides a broad estimate of the relative influence of remineral- ization on the distribution of dFe in the study area.
We obtain a range between 5±3 % and 54±27 % for dFe being derived from remineralization processes with low- est values observed on the shelf at 34 m depth at station 4 (5±3 %) and highest values estimated beyond the shelf break at Stn. 9 at 213 m depth (54±27 %) and Stn. 2 at 450 m depth (52±26 %). However, no clear increase in the contribu- tion of remineralized dFe to total dFe with depth or distance to the coast was observed. For example at depths between 35 and 200 m, our estimates of dFe from remineralization ranged between 10±5 % and 51±25 % with high values of up to 41±20 % at 50 m depth at station 7 close to the coast, whereas relatively low values of 19±9 % were observed at
89 m at station 2. These results indicate that, locally, reminer- alization can be an important control on dFe concentrations, but that the contribution varies largely with additional impor- tant controls, often dominating over remineralization.
Similar analysis for dCo/C ratios revealed an in- creased importance of an additional source close to the shelf. Observed dCo/C ratios ranged between 0.81 and 2.2 µmol mol−1. The larger ratios were observed close to the coast and decreased further offshore. Overall, the ob- served ratios were somewhat higher than reported cellu- lar ratios of phytoplankton in the North Atlantic of 0.5–
1.4 µmol mol−1 (Twining et al., 2015). However, relatively constant dCo/C ratios beyond the shelf break (dCo/C: 0.82–
1.09 µmol mol−1, stations 2, 5, and 9) that are similar to cel- lular ratios of phytoplankton suggest a large influence of rem- ineralization on dCo beyond the shelf break, whereas en- hanced ratios close to the coast suggest an additional ben- thic source. Due to the lack of comparable data of offshore dCo/C ratios and the multiple processes influencing this ratio (varying phytoplankton nutrient stoichiometry and scaveng- ing), we did not use these values to estimate the remineral- ized dCo fraction.
The distribution of Mn was not predominantly determined by biological uptake and remineralization processes in our study region. In contrast, dMn/C ratios were largely influ- enced by photoreduction in the surface (Sunda and Hunts- man, 1994), removal via biotic oxidation, and formation of Mn oxides at depth (Tebo et al., 2004). Therefore, we did not assess remineralization processes for Mn using dMn/C ratios.
3.4.2 Atmospheric deposition
Aluminum is present as a relatively constant fraction of
∼8.15 wt % in the continental crust (Rudnick and Gao, 2006), is supplied to open ocean surface waters mainly by atmospheric deposition (Orians and Bruland, 1986), and is not considered to be taken up by phytoplankton (apart from a small amount being incorporated into siliceous diatom frus- tules; Gehlen et al., 2002). Therefore, dAl in the surface mixed layer is used as a tracer for atmospheric deposition to the surface ocean (Measures and Brown, 1996; Measures and Vink, 2000). The atmospheric input in the study region is mainly influenced by north African or Saharan mineral dust with only a small contribution of anthropogenic sources, which differ greatly in TM composition and solubilities from mineral dust (Baker et al., 2013; Patey et al., 2015; Shel- ley et al., 2015). Close to continental shelves, Al can also be supplied by sediment resuspension in addition to atmo- spheric input (Menzel Barraqueta et al., 2018; Middag et al., 2012; Moran and Moore, 1991). Enhanced aerosol op- tical depth above our study region (Supplement Figs. S3 and S4) indicates high dust loading at the time of our cruise. Our dAl concentrations in surface water ranged between 30 and 49 nmol L−1and LpAl between 3.4 and 18.2 nmol L−1. Dis-
solved Al concentrations decreased with depth (Fig. 8), indi- cating that Al was released by eolian dust deposition to sur- face waters and removed through scavenging at depth (Ori- ans and Bruland, 1985).
Dissolved atmospheric deposition fluxes can vary largely depending on the aerosol solubility, which is dependent on aerosol source, atmospheric aerosol processing during trans- port, and dissolution in surface waters (Jickells, 1999). Here, atmospheric dFe fluxes were calculated using the dAl inven- tory in the surface mixed layer, a residence time for dAl of 0.65±0.45 years as reported for the Canary Current system (Dammshäuser et al., 2011), and a ratio of 0.31 for dust- derived dissolved Fe/Al (Buck et al., 2010). This approach is independent of the fractional solubility of Al, as we do not account for total atmospheric deposition fluxes and only use the already dissolved fraction of Al. However, this ap- proach is dependent on the ratio of Fe/Al from dissolution of aerosols. This ratio, however, is not clearly defined and can vary between different dust sources and deposition pathways, such as wet or dry deposition (e.g., Shelley et al., 2018).
In our study region, dry deposition is the dominant deposi- tion pathway, as it is located north of the Intertropical Con- vergence Zone and precipitation is minimal<0.001 g cm−3 (NASA). Here, we utilized a ratio observed for total aerosol samples in the remote North Atlantic from a Saharan dust source (Buck et al., 2010). Soluble ratios under the Saharan dust plume were, however, lower for all leach media (Fe/Al:
0.051–0.25; Shelley et al., 2018), indicating that the ratio of 0.31 utilized here might result in an overestimation of the dFe flux estimates. This approach also assumes that dAl is only supplied to the surface ocean via atmospheric deposi- tion. Vertical fluxes of Al from sediment resuspension are unlikely to contribute significantly to concentrations of dAl in surface waters here as dAl concentrations decreased with depth, indicating removal of dAl via scavenging.
Mean atmospheric dFe fluxes of the individual stations were 0.63–1.4 µmol m−2d−1(Fig. 5, Supplement Table S2), values similar to reported fluxes close to our study re- gion of 2.12 µmol m−2d−1 further north between 22.5–
25◦N and 26.5–27.5◦W (Rijkenberg et al., 2012) and 0.120 µmol m−2d−1around 20◦N close to the African coast (Ussher et al., 2013). The uncertainty in the residence time of dAl, however, creates a large uncertainty in calculated fluxes resulting in a lowest flux of 0.37 µmol m−2d−1when using the largest estimated residence time of 1.1 years and a high- est flux of 4.65 µmol m−2d−1 when using the shortest esti- mated residence time of 0.2 years. In fact, a residence time of 3 months has been shown to give similar results for total Al atmospheric deposition fluxes as modeling studies (Men- zel Barraquetta et al., 2019). Short residence times of a few months have also been suggested for Al and Fe in areas with a large dust deposition including our study region (e.g., Croot et al., 2004; Dammshäuser et al., 2011). Therefore, we sug- gest that the atmospheric dFe flux is more likely to be closer to the upper range of our flux estimates. However, the atmo-
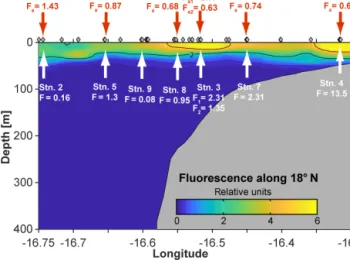
Figure 5.Atmospheric dFe fluxes (Fa; red) and vertical dFe fluxes (F; white) in micromoles per square meter per day (µmol m−2d−1) along the transect at 18◦200N in June 2014.
spheric deposition fluxes using a short residence time may be larger than the annual average since the dust load is high- est between June and August in our study area (Supplement Fig. S4).
3.4.3 Vertical trace element fluxes to surface waters The vertical diffusive and advective fluxes of dFe from shal- low O2-depleted waters to surface waters with enhanced chlorophyllafluorescence were determined to assess the po- tential Fe contribution to phytoplankton growth from suboxic waters (Fig. 5). A detailed summary of the individual dFe flux estimates, and their uncertainties, is given in the Supple- ment Table S2.
Vertical dFe fluxes increased by 2 orders of magnitude from 70 km offshore to the shallow shelf region. On the shelf (bottom depth: 50 m), an elevated mean dFe flux of 13.5 µmol m−2d−1 was estimated. The contribution from vertical advection (upwelling) here (11.99 µmol m−2d−1) was an order of magnitude larger than the diffusive flux (1.56 µmol m−2d−1). Our estimate agrees with a reported vertical dFe flux of 16 µmol m−2d−1 on the shelf at 12◦N (Milne et al., 2017). Average estimates from the upper continental slope and the lower shelf region (sta- tions 3, 7, and 8, bottom depth: 90–300 m) were be- tween 1 and 2.5 µmol m−2d−1. Here, the vertical diffu- sive fluxes dominated (0.72–1.75 µmol m−2d−1) and were about a factor of 3 larger than vertical advective fluxes (0.22–0.68 µmol m−2d−1). The elevated diffusive fluxes at the upper continental slope and lower shelf region are due to enhanced diapycnal mixing that originates from tide–
topography interactions (Schafstall et al., 2010). At 170 m depth of the repeated station (3), vertical dFe flux estimates were 2.3 and 1.4 µmol m−2d−1, respectively. The differences in the two values are due to differences in the strength of