www.biogeosciences.net/13/1609/2016/
doi:10.5194/bg-13-1609-2016
© Author(s) 2016. CC Attribution 3.0 License.
Thermocline mixing and vertical oxygen fluxes in the stratified central North Sea
Lorenzo Rovelli1,2,a, Marcus Dengler1, Mark Schmidt1, Stefan Sommer1, Peter Linke1, and Daniel F. McGinnis1,3
1GEOMAR Helmholtz Centre for Ocean Research Kiel, Kiel, Germany
2Scottish Association for Marine Sciences (SAMS), Oban, UK
3Institute F.-A. Forel, Faculty of Science, University of Geneva, Geneva, Switzerland
anow at: Nordic Center for Earth Evolution (NordCEE), Department of Biology, University of Southern Denmark, Odense, Denmark
Correspondence to: Lorenzo Rovelli (lorenzo@biology.sdu.dk)
Received: 24 April 2015 – Published in Biogeosciences Discuss.: 3 July 2015 Revised: 8 February 2016 – Accepted: 26 February 2016 – Published: 15 March 2016
Abstract. In recent decades, the central North Sea has been experiencing a general trend of decreasing dissolved oxygen (O2)levels during summer. To understand potential causes driving lower O2, we investigated a 3-day period of summer- time turbulence and O2dynamics in the thermocline and bot- tom boundary layer (BBL). The study focuses on coupling biogeochemical with physical transport processes to iden- tify key drivers of the O2and organic carbon turnover within the BBL. Combining our flux observations with an analytical process-oriented approach, we resolve drivers that ultimately contribute to determining the BBL O2levels. We report sub- stantial turbulent O2fluxes from the thermocline into the oth- erwise isolated bottom water attributed to the presence of a baroclinic near-inertial wave. This contribution to the local bottom water O2and carbon budgets has been largely over- looked and is shown to play a role in promoting high car- bon turnover in the bottom water while simultaneously main- taining high O2 concentrations. This process may become suppressed with warming climate and stronger stratification, conditions which could promote migrating algal species that potentially shift the O2production zone higher up within the thermocline.
1 Introduction
1.1 Hypoxia in shelf seas and coastal regions
The distribution of dissolved oxygen (O2) in marine sys- tems results from a complex interaction between biological
processes (photosynthesis and respiration) and physical pro- cesses (O2flux pathways) occurring within the water column and at the seafloor. O2is regarded as an important indicator of ecosystem functioning for aquatic organisms (Best et al., 2007) and for benthic activity (e.g., Glud, 2008). Changes in O2distribution, concentrations and supply can therefore have severe impacts on shelf ecosystems. O2concentrations be- low 62.5 µmol L−1, which is generally regarded as the thresh- old of hypoxia (Vaquer-Sunyer and Duarte, 2008), are shown to significantly stress aquatic communities and increase the mortality among fish communities (Diaz, 2001). These eco- logical and economic impacts of O2 depletion lead to in- creasing concern regarding hypoxia occurrence and hypoxic events. As reviewed by Diaz and Rosenberg (2008), hypoxia in coastal environments is spreading and so are the reports of unprecedented occurrence of hypoxia in several shelf seas and coastal regions (Grantham et al., 2004; Chan et al., 2008;
Crawford and Pena, 2013).
1.2 Hydrodynamics and oxygen depletion in the North Sea
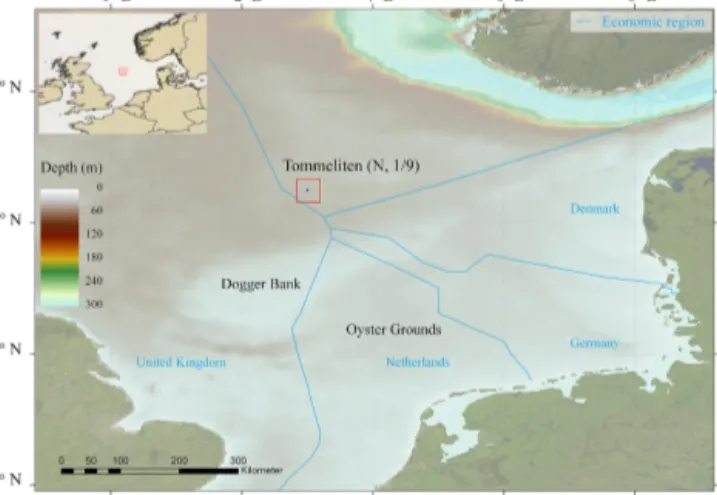
The North Sea is situated on the northwest European con- tinental shelf, between the British Islands and continental Europe (Fig. 1). Its semi-enclosed basin covers an area of 575 300 km2, with an average depth of 74 m and a general decrease in depth from north to south (Otto et al., 1990). The central region is characterized by the presence of the Dog- ger Bank, a shallow sandbank that acts as a hydrological di- vide. The northern and central North Sea hydrology is mainly
Figure 1. Map of the North Sea indicating the water depths and location of the Tommeliten site and the borders of the economic regions of the surrounding European countries.
dominated by inflow from the North Atlantic Ocean at the northern open boundary, while the southern part relies on in- flow from the English Channel (Thomas et al., 2005). North- ern and central North Sea areas are characterized by sea- sonal water column stratification (from April to September–
October; Meyer et al., 2011). With only weak, wind-driven residual currents (Otto et al., 1990), this stratification leads to isolation of central North Sea bottom water and subsequent O2depletion.
In the central North Sea, the occurrence of low O2 lev- els in bottom waters has been reported (e.g., North Sea Task Force, 1993; Greenwood et al., 2010). Additional monitor- ing studies in the central North Sea in 2007 and 2008 have shown that O2concentration in bottom waters at the Oyster Grounds and North Dogger can drop to 163–169 µmol L−1 (60–63 % saturation) and∼200 µmol L−1(71 % saturation), respectively (Fig. 1; Greenwood et al., 2010). Comparable field observations were also reported in the summer of 2010 (Queste et al., 2013). The authors also reviewed the available historical O2data in the North Sea (1900–2010), revealing a clear increase in O2depletion after 1990.
While the reported O2levels were still above the hypoxic threshold, growing concerns of hypoxia developing in the North Sea have highlighted the need for more detailed studies on O2dynamics and its driving forces (Kemp et al., 2009).
Since 1984, surface water temperatures in the North Sea have increased by 1–2◦C higher than the global mean (OSPAR, 2009, 2010; Meyer et al., 2011). On seasonal timescales, cli- mate projections indicate longer durations of the stratifica- tion period and stronger thermocline stability (Lowe et al., 2009; Meire et al., 2013), with some projections suggesting earlier onset of stratification (e.g., Lowe et al., 2009). Due to the semi-enclosed nature of the North Sea, earlier onset and longer stratification increases the length of time that deep
waters are isolated, potentially allowing lower O2concentra- tions to develop (Greenwood et al., 2010).
1.3 Physical drivers of oxygen dynamics
The distribution of O2 and other dissolved constituents within aquatic systems are largely driven by physical trans- port processes. These include wind-driven air–water–gas ex- change at the sea surface (Wanninkhof, 1992), molecular dif- fusion at the sediment–water interface (Jørgensen and Revs- bech, 1985), horizontal advection (e.g., Radach and Lenhart, 1995) and turbulent transport in the water column, where the latter transport was reported to significantly contribute to constituent balances (see Rippeth, 2005; Fischer et al., 2013; Kreling et al., 2014; Brandt et al., 2015). In shelf seas, the seasonal occurrence of steep thermoclines acts as an important physical barrier separating the surface layer from nutrient-rich deeper waters (Sharples et al., 2001). As mea- surements of shear and stratification have shown, the central North Sea thermocline is in a state of marginal stability (van Haren et al., 1999). Hence additional sources of shear could trigger shear instability leading to local production of turbu- lence within the thermocline. This enhanced local turbulence would subsequently enhance the vertical exchange of con- stituents such as O2, organic carbon and nutrients. Resolv- ing processes that drive diapycnal (i.e., vertical) fluxes across the thermocline throughout the stratification period is key to understanding the biogeochemical functioning of shelf seas (e.g., Sharples et al., 2001).
1.4 Present study
The goal of this study is to provide understanding of key tur- bulent processes driving O2 fluxes across the thermocline during the summertime stratification period in the central North Sea using data from a 3-day process study. We investi- gate and describe O2dynamics and fluxes to the bottom wa- ters and discuss their potential influence on the seasonal O2 balance. Using the resolved O2fluxes, we perform a simple 1-D mass balance model to quantify O2sources and sinks.
Finally, processes that could further promote hypoxia in the central North Sea in a warming climate are discussed.
2 Methods 2.1 Study site
We performed O2and turbulence measurements in the Nor- wegian sector of the central North Sea, N. 1/9, at the Tom- meliten site (56◦2903000N, 2◦5900000E; Fig. 1) from 8–11 Au- gust 2009 aboard the R/V Celtic Explorer (cruise CE0913).
The site, located∼100 km northeast from the northern Dog- ger Bank, and its surroundings are characterized by shallow waters (∼70 m) relatively far from coastal areas (on average
∼3000 km). The site is known for the presence of buried salt
diapirs, methane (CH4)seeps and bacterial mats (Hovland and Judd, 1988). Bathymetric surveys from Schneider von Deimling et al. (2010) revealed a rather flat sandy seabed with almost no features, with the exception of centimeter- sized ripples (McGinnis et al., 2014).
The currents of the central North Sea are predominantly driven by the semi-diurnal lunar tide (M2)(Otto et al., 1990).
Seasonal stratification begins in April around Julian day 100 and lasts until the end of September or early October, Julian days 270–290 (e.g., Meyer et al., 2011). The thermocline has been identified as an important zone for the establishment of primary production and the O2maximum layer (see Pingree et al., 1978). In fact, the North Sea deep chlorophyll maxi- mum (DCM) is estimated to account for 58 % of the water column primary production and 37 % of the annual new pro- duction for the summer stratified North Sea (Weston et al., 2005). Thus, the development of the associated O2maximum due to this production is important and, so far, not considered in the overall O2balance of the central North Sea.
2.2 Instrumental setup
High-resolution (millimeter-scale) turbulent shear and tem- perature profiles were obtained with a MSS90-L microstruc- ture turbulence profiler (Sea and Sun Technology, Trap- penkamp, Germany). The MSS90-L is a free-falling, loosely tethered profiler which samples at 1024 Hz with 16 channels and is designed for an optimal sink rate of 0.5–0.6 m s−1. The probe was equipped with two airfoil shear probes, an ac- celerometer (to correct for probe pitch, roll and vibration), a fast temperature sensor (FP07, 7–12 ms response time), stan- dard CTD sensors (temperature, pressure, conductivity) and a fast (0.2 s response time) galvanic O2sensor (AMT, Anal- ysenmesstechnik GmbH, Rostock, Germany). Absolute O2 concentrations were calibrated against shipboard CTD O2 profiles and Winkler titrations using discrete water samples (see below).
Water column hydrodynamics were characterized with the compact benthic paleoceanography (POZ) lander, which was deployed using a video-guided launcher (Pfannkuche and Linke, 2003). The POZ lander recorded 3-D current veloc- ity profiles and acoustic backscatter information throughout the water column using a 300 kHz acoustic Doppler cur- rent profiler (ADCP; Workhorse Sentinel, Teledyne RD In- struments, Poway, United States), which sampled every 15 s with a bin size of 0.5 m starting from 2.75 m from the bot- tom. A conductivity–temperature–depth (CTD) logger (XR- 420 CT logger, RBR, Canada) recorded temperature, con- ductivity and pressure (Digiquartz, Paroscientific, Redmond, United States) every 2 s near the seafloor (∼0.3 m distance).
The POZ lander was also equipped with a Winkler-calibrated O2 optode sensor (Aanderaa Data Instruments AS, Bergen, Norway), which recorded bottom boundary layer (BBL) O2 concentration at 1 min intervals.
Water column profiles were obtained using a SBE9plus CTD-rosette system (Seabird, Washington, United States).
The CTD sampled at 24 Hz and was equipped with standard temperature, conductivity, pressure, O2 and light transmis- sion sensors. The rosette system mounted 12 Niskin bottles (10 L each) for discrete water sampling. Each water sample was subsampled with three Winkler bottles of known vol- ume (∼62 mL on average) upon recovery, and the samples were immediately fixed on deck and titrated manually within 24 h after the sampling (see Winkler, 1888). CTD O2read- ings were calibrated against O2concentrations from Winkler samples; values deviated by < 5 %.
2.3 Hydrodynamic data evaluation
The main tidal directions (major and minor axis of the tidal ellipsoid) were determined by performing a variance analy- sis on the ADCP velocity time series. Theu andv veloc- ities were rotated over a stepwise increasing rotation angle (r) asurot=ucos(−r)−vsin(−r)andvrot=usin(−r)+ vcos(−r), and the variance was computed at each step. The angle with the largest variance is the main tidal direction.
Barotropic and baroclinic flow contributions of tides were separated by least-square fitting the detrended velocity time series to harmonicsu=Acos(ωt+ϕ)withA,ω,φ being the amplitude, frequency, and the phase lag, respectively.
In the analysis below, the barotropic semi-diurnal principle lunar tide (M2)and diurnal declination tide (K1)contribu- tions had frequencies of 1.93227 cycles per day (cpd) and 1.00274 cpd, respectively, and were subtracted from the time series to analyze residual flow. For barotropic contributions, the fit was applied to the depth average of the time series, while baroclinic contributions were obtained by fitting the harmonics to the velocity time series from each 0.5 m ADCP bin. The occurrence of enhanced shear in the stratified wa- ter column was investigated by calculating the vertical shear of horizontal velocity,S, from the vertical gradients between adjacent bins of east and north velocity (0.5 m resolution) as S=p
(du/dz)2+(dv/dz)2. Frequency spectra of the time series of horizontal velocity and vertical shear of horizon- tal velocity were used to identify the tidal and non-tidal flow components. The spectra were calculated using fast Fourier transforms combined with a 1/2 cosine taper (Hanning win- dow), which was applied to the first and last 10 % of the time series data.
Turbulent kinetic energy dissipation rate (ε) was quantified from airfoil shear readings by integrating shear wavenumber spectra assuming isotropic turbulence (Batchelor, 1953):
ε=7.5µ Z kmax
kmin
Edu0/dz(k)dk, (1) whereµis the dynamic viscosity of seawater. Shear spectra Edu0/dz(k)were calculated from 1 s ensembles (1024 values) and integrated between a lowerkmin=3 cycles per minute (cpm) and an upper wavenumber kmin that varied between
14 and 30 cpm depending on the Kolmogorov wavenumber.
Here, a Bartlett window was applied to the whole ensemble prior to spectral decomposition. Loss of variance due to lim- ited wavenumber band was taken into account by fitting the observed shear spectra to the universal Nasmyth spectrum.
Similarly, corrections for the loss of variance due to finite sensor tip of the airfoil probes were applied (see Schafstall et al., 2010). The detection limit, or noise level, of the used profiler for ε was inferred to be 1×10⁻⁹W kg−1 (Schaf- stall et al., 2010); the upper detection limit is a function of the shear sensor geometry (up to 10−4W kg−1; Prandke and Stips, 1998).
Estimates of turbulent eddy diffusivities of mass (Kρ) were obtained from measurements ofεas
Kρ=γ ε/N2, (2)
whereγ is the mixing efficiency andN2the water column stability. This method, proposed by Osborn (1980), approxi- matesKρunder the assumption of a local equilibrium of pro- duction and dissipation of turbulent kinetic energy. Values for N2were calculated from temperature, salinity and pressure data using the adiabatic method (Fofonoff, 1985) as N2=
−g ρ−1∂ρ/∂z−g/c2
, whereρ,g, andcare the density, the earth’s gravitational acceleration, and speed of sound. Mix- ing efficiency values in stratified waters range from 0.1 to 0.2 (Ivey and Imberger, 1991) and decrease in weakly stratified waters such as within the BBL (Lorke et al., 2008). To ac- count for this decrease, we used theγandKρ parameteriza- tion of Shih et al. (2005). Based on the turbulence activity pa- rameterε/υN2, with the kinematic viscosity,v, the authors found that in energetic regimes, i.e.,ε/υN2>100, eddy dif- fusivities are better estimated as Kρ=2υ(/υN2)1/2. As horizontal density gradients at the study site were deemed to be small compared to vertical gradients (see Discussion), we equated diapycnal eddy diffusivities with vertical diffu- sivities (i.e.,Kρ=Kz).
To obtain representative mean turbulent eddy diffusivities, the data were evaluated in ensembles of three to four con- secutive profiles and averaged in depth and time to reduce uncertainties due to the patchiness of turbulence, temporal fluctuation ofN2and temporalγvariations (see Smyth et al., 2001). As proposed by Ferrari and Polzin (2005), the level of uncertainty of the averagedKzcan be quantified as:
1Kz=Kz
"
1γ γ
2
+ 1ε
ε 2
+ 1N2
N2
2#1/2
, (3) with1being the absolute uncertainty of the various average terms. Here, the uncertainties are evaluated in the region of strong vertical O2gradients and in 2 m depth bins. The ab- solute uncertainty for 1γ was assumed to be 0.04 (see St.
Laurent and Schmitt, 1999). The absolute uncertainty onN2 (1N2)was determined by the standard error over the 2 m average, computed as the standard deviation divided by the
square root of the number of estimates. Finally, the statistical uncertainty ofεfor each bin was calculated using a bootstrap method (104resamples) (Efron, 1979).
The vertical O2fluxesFθwere then obtained fromKzand the O2concentration gradients∂[O2]/∂zas
Fθ=Kz∂[O2]
∂z . (4)
Accordingly, the uncertainty of averaged turbulent O2 fluxes were given by
1Fθ=Fθ
"
1Kz
Kz
2
+
1∂z[O2]
∂z[O2] 2#1/2
, (5)
where1∂z[O2] denotes the standard error of mean vertical gradients of O2concentrations. It should be noted that the analysis did not include biases or uncertainties due to mea- surement errors.
3 Results
During the 3-day observational period (8–11 August 2009), we collected 39 high-resolution MSS profiles in consecutive sets of three to five profiles at 5–10 min intervals. Most of the profiles were in the evening (profiles 1–8, 26–28, 36–39) or at night (9–15, 29–35) with the remaining profiles acquired in the morning (06:00 to 09:00). One shipboard CTD profile was performed prior to the actual MSS profiles to provide hydrographic information, the water turbidity and O2 con- centrations, and discrete water samples for subsequent on- board Winkler titrations. Hydroacoustic water column cur- rent measurements were carried out continuously throughout the observational period. The following results are structured to first present a characterization of the site’s physical set- tings and turbulence drivers, followed by the O2fluxes and O2BBL budget.
3.1 Water column structure
The∼70 m deep water column was characterized by a stable, well-defined four-layer temperature structure (Fig. 2a). The well-mixed surface boundary layer (SBL) and BBL, 15 and 30 m thick, respectively, were separated by a weakly strati- fied transition layer (15–25 m depth) and a strongly stratified interior layer (25–40 m depth). The stratified interior layer was characterized by two very steep thermoclines situated in the upper (27–30 m depth) and lower (36–39 m depth) re- gion of the layer, with vertical temperature gradients of up to 4◦C m−1. The average salinity was 35.08 with little vari- ation throughout the water column (35.04–35.1). The light transmission profile from the ship CTD ranged from 89 to 96 % (Fig. 2b). The most turbid layer (89 %) was observed at the lower boundary of the interior layer (at 40 m depth) suggesting the presence of the deep chlorophyll maximum, phytoplankton, zooplankton and suspended particles.
Figure 2. Water column profiles based on high-resolution MSS pro- files (a, c, d) and ship CTD profile (b). (a) Potential temperature profiles. Water column layers were identified based on the temper- ature profiles. A 0.2 and 1.5◦C decrease from the surface boundary layer average temperature (3–6 m depth) was used determine the depth of the surface boundary layer to the transition layer interface and the transition layer to the interior layer interface, respectively.
Correspondingly, a 0.2◦C from a 50–60 m depth average tempera- ture was used to locate the interior layer to the BBL interface. (b) Light transmission profile. (c, d) O2saturation profiles and associ- ated absolute concentrations.
The O2profiles were generally characterized by near satu- ration in the SBL and transition layers (238–243 µmol kg−1) and undersaturated (∼80 %) in the BBL (∼243 µmol kg−1) (Fig. 2c, d). The stratified interior layer was oversaturated by up to 115 %, with a well-established O2 maximum at
∼39 m depth with concentrations up to ∼315 µmol kg−1. Below that maximum, at the thermocline–BBL interface, we observed a 2–3 m thick steep oxycline, with an O2gradient of 34 µmol kg−1m−1. We did not detect significant variations in the O2values, or gradient over our limited measurement range (Fig. 2c, d). We resolve the O2flux into the BBL asso- ciated with this oxycline.
3.2 Hydrodynamics
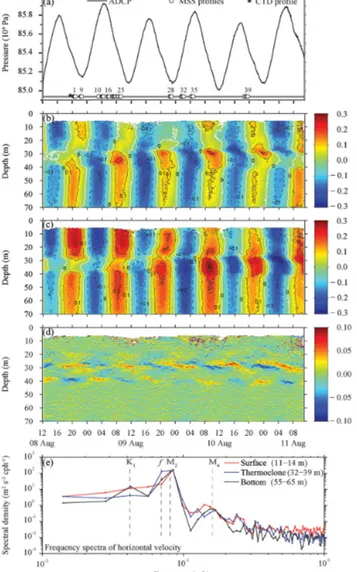
The hydrostatic pressure data set (POZ lander) revealed that the tidal water level ranged from 0.6 to 0.9 m (Fig. 3a). Vari- ance analysis on the ADCP velocity data identified the ma- jor and minor axis of the tidal ellipsoid components to oc- cur at 45 and 135◦from true north, respectively. Along these axes, the current amplitudes were 0.21 and 0.04 m s−1, indi- cating a narrow tidal current ellipsoid, as reported by Otto et al. (1990). The site was characterized by a negative tide polarity (anticyclonic) for the semi-diurnal tides. A domi- nance of the barotropic M2 current amplitude at all depths was clearly visible in the velocity time series (Fig. 3b, c) and the harmonic analyses. East (zonal) and north (meridional) barotropicM2-current amplitudes were 0.12 and 0.17 m s−1,
Figure 3. Current regime at the Tommeliten site from ADCP mea- surements (a–d) and spectral analysis (e). (a) Sea surface eleva- tion relative to average level during the observational period (el- evation=0 m) and schedule of different instrument deployments.
Numbers on the MSS markers indicate the profile number. (b, c) Horizontal velocities, showing 20 min averaged east (b) and north (c) velocities. (d) Vertical shear of north velocity, dv/dz, calculated from the ADCP velocity data (see panels b, c). Note that panels (a–d) have the same time axis. (e) Frequency spectra of horizontal velocity calculated from the ADCP data for selected depth ranges for the SBL (surface; red line), thermocline (blue line) and BBL (bottom; black line). The inertial frequency,f, and the frequency for the diurnal declination tide,K1, semi-diurnal lunar tide,M2, and shallow water tidal constituent,M4, are marked.
respectively, whileK1-current amplitudes were only 0.005 and 0.03 m s−1.
Although the limited length of the ADCP velocity time series did not allow for full separation of the M2 and f frequencies, the spectral density functions indicated maxi- mum energy at frequencies of about the semi-diurnal tide.
This maximum varied little with depth, indicating barotropic
M2motions. Superimposed on those barotropic currents, we observed the presence of baroclinic velocity contributions (Fig. 3b, c). Additionally, near-inertial motions were also de- tected.
The occurrence of near-inertial motions was most pro- nounced in the thermocline (32–39 m; Fig. 3e). Lower, but still elevated, energy densities at the near-inertial band were found in the SBL and BBL. Moreover, the near-inertial cur- rents exhibited a distinct 180◦phase shift between the SBL and the thermocline as well as between the thermocline and the BBL, suggesting a second vertical mode nature of these fluctuations. Average amplitudes of the near-inertial fluctu- ations in the thermocline obtained from least-square fitting were 0.11 m s−1. In the BBL and SBL, average amplitudes were reduced to 0.06 and 0.04 m s−1, respectively, suggest- ing that f oscillations might account for enhanced shear in the thermocline.
Enhanced vertical shear of horizontal velocity was found at the interior layer to the transition layer and at the interior layer to the BBL interfacial regions (Fig. 3d). As indicated by the spectral density function of the shear time series from the interior layer interfacial layers (Fig. S1 in the Supplement), the shear exhibited near-inertial frequencies (1.6722 cpd), and resulted from the baroclinic near-inertial wave. The high vertical resolution (0.5 m) of our velocity data allowed the resolution of the interfacial shear layers, which were typ- ically 2–3 m thick with elevated values of up to 0.05 s−1. Comparisons with CTD data showed that they are collocated with the two enhanced temperature gradient layers in the thermocline (27–30 and 36–39 m depth; Fig. 2a).
The dissipation rates (ε)of turbulent kinetic energy (TKE) determined from microstructure shear probes were partic- ularly low in the center of the stratified interior layer (2–
5×10⁻⁹W kg−1) but still above the MSS detection limit.
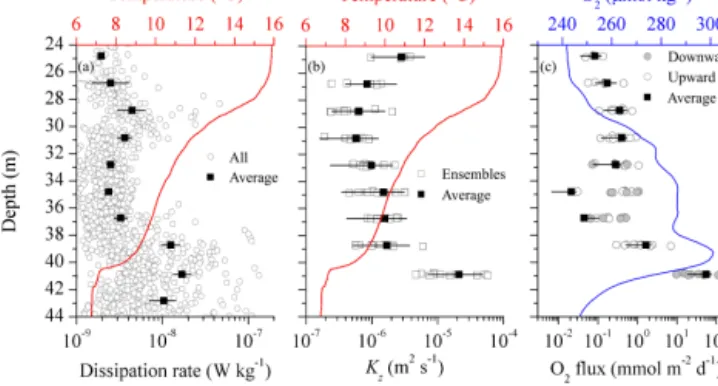
However, ε increased to 5×10⁻⁹ and 2×10⁻⁸W kg−1 at the upper and lower interior layer limits, respectively (Fig. 4a). These coincided with the depth range of the in- terfacial shear layers (Fig. 3d) at the strong temperature gra- dients (Fig. 2a) and resulting water column stability maxima (∼1×10⁻³s−2).
Bin-averaged values of Kz varied by a factor of 5, rang- ing from 6×10⁻⁷m2s−1 in the central interior layer to 3×10⁻⁶m2s−1 in the lower region of the transition layer (Fig. 4b). In the upper interface (thermocline–transition layer), whereεwas elevated with respect to the central inte- rior layer but reduced compared to the lower interfacial layer, stronger stratification (i.e., largerN2values up to 10−3s−2) reduced the eddy diffusivities. At the interior layer to the BBL interface, higher Kz values (∼2×10⁻⁵m2s−1) re- sulted from increased turbulence and weaker stratification.
This enhanced turbulent transport was located where the ver- tical O2gradient was the strongest (Fig. 2d).
Figure 4. Overview of turbulent transport and O2 fluxes within the interior layer (defined in Fig. 2). Each panel is overlaid with temperature (a, b) and O2concentration (c) profiles. (a) Dissipa- tion from all profiles (open dots) together with the arithmetic mean (solid squares). (b) Average vertical eddy diffusion coefficientKz with uncertainties bars and theKzvalues for every ensemble (open squares), which represent the average over 3–4 consecutive profiles.
(c) Calculated average O2flux over 2 m bins with the respective un- certainties intervals (solid square and black line). The values for each profile cluster are shown both downward and upward fluxes (grey solid and open dots, respectively). Note that in the center in- terior layer (33–37 m) the average reflects the combination of the variability of the observed upward and downwards fluxes.
3.3 Oxygen fluxes and budget
With the fast-responding AMT galvanic O2sensor and rapid sampling rate, we were able to resolve the O2gradient with high precision. Figure 4c shows the 2 m bin average O2fluxes for the interior layer together with the averages from each ensemble. Small O2 fluxes (∼1 mmol m−2d−1) were esti- mated for the center and upper region of the interior layer, suggesting that relatively little O2is transported upward from the O2 maximum to the upper interior layer. In contrast, a substantial O2 flux ranging from 9–134 mmol m−2d−1(av- erage of 54 mmol m−2d−1) was identified from the lower thermocline towards the BBL. The confidence interval asso- ciated with the uncertainties of the O2flux estimates was 18–
74 mmol m−2d−1. Although the O2fluxes to the BBL water from the thermocline were variable in magnitude (Fig. 4c) and the measurements limited to the observational period (Fig. 3), their magnitude nevertheless suggests an important, yet overlooked, O2pathway.
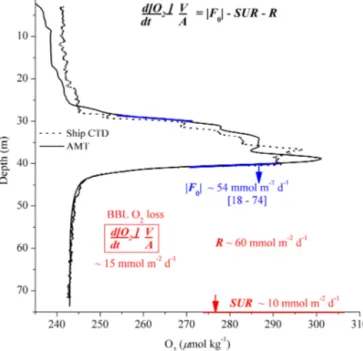
We performed a simple 1-D BBL mass balance to inves- tigate the relevance to the local O2 balance during our ob- servational period. Here, we defined the apparent (measured) O2loss rate in the BBL∂[O2]/∂tas the consequence of O2 replenishment fromFθ and the O2 utilization via sediment O2uptake rate (SUR) and water column organic matter res- piration (R)expressed as
∂[O2]
∂t V
A = |Fθ| − |SUR| − |R|n
mmol m−2d−1o
. (6)
The mass balance was constrained to the (assumed) well- mixed 35 m deep BBL section of area,A=1 m2with a vol- ume V =35 m3. We further assumed negligible horizontal O2 gradients (as observed from the CTD casts), and thus a net zero horizontal O2advective transport.
The average SUR for the same time period and location, obtained from parallel eddy correlation measurements, was
∼ −10 mmol m−2d−1 (McGinnis et al., 2014). The SUR was consistent with the average SUR at Oyster Grounds reported by Neubacher et al. (2011), −9.8 mmol m−2d−1, and with modeled SURs at the same site (average
−8.6 mmol m−2d−1; Meire et al., 2013). The apparent BBL O2 loss of−0.42 µmol kg−1d−1 was determined from the POZ lander O2 optode time series (Fig. 5a) over 52 h, (R2=0.60). Though limited to our short observational pe- riod, the vertically integrated apparent BBL O2 loss was about−15 mmol m−2d−1and thus within 2 % of the nearby North Dogger average presented by Greenwood et al. (2010).
Based on Eq. (6) and using the observed BBL O2loss rate, Fθ and SUR, the water column respiration, R was calcu- lated to be∼ −60 mmol m−2d−1. This implies that without the O2replenishment, the apparent BBL O2 loss would be
∼ −2 µmol kg−1d−1and thus 4 times higher than observed.
Our results indicated that the total respiration in the bottom water was therefore∼ −70 mmol m−2d−1 (SUR+R), with about 14 % of the organic carbon mineralization occurring in the sediment and 86 % in the BBL.
4 Discussion
During our 3-day observational period, we found that the baroclinic near-inertial wave in the interior layer was the main contributor to the detected enhanced shear (Fig. 3d) and the observed elevated vertical O2flux to the BBL (Fig. 6).
As near-inertial waves decay after a few weeks, it should be noted that we observed a rather special situation, and that vertical O2fluxes will not likely be as highly elevated during periods when near-inertial waves are not present.
Within this context, we (1) discuss the turbulent mech- anisms leading to these thermocline O2 fluxes and mecha- nisms promoting the formation of the O2maximum zone in terms of primary productivity, (2) discuss the implication for the local O2BBL dynamics and carbon budget, (3) elaborate on factors that can ultimately influence O2depletion in the North Sea and other seasonally stratified shelf seas.
4.1 Thermocline mixing
The expansive North Sea thermocline (1–5×10⁵km2; Meyer et al., 2011) has been regarded as being in a state of marginal stability, where additional sources of shear could lead to increased thermocline mixing (e.g., van Haren et al., 1999). Itsweire et al. (1989) showed that layers of strong shear are likely to be found where strong stratification occurs.
Figure 5. BBL dissolved oxygen time series and turbulence con- tour. (a) Near-seafloor BBL O2concentration changes over the ob- servational period from the POZ lander. Red line indicates the es- timated apparent linear O2 loss. (b, top) Turbulence contour plot of all MSS90 casts together with the temperature layers. Thin and thick dashed lines represent the transition layer to the interior layer interface and the interior layer to the BBL interface, respectively.
Grey spots indicate data missing due to uncompleted profiles (casts 16–23), unsuccessful profiles (cast 36), or flagged as bad based on spikes, collisions and suspected contamination due to ship activity.
The vertical black lines indicate the transition (time gaps) between consecutive profile ensembles. (b, bottom) Background information on bottom current and hydrostatic pressure during the casts. Both velocity and pressure data were collected by the deployed POZ lan- der. Note that as a result of the time gaps between the consecutive MSS90 casts (see Fig. 3a) the timescale is not linear.
Generally, in the absence of varying topography and sloping boundaries, the major sources of shear in the thermocline are considered to be internal tides and near-inertial oscillations (see Rippeth, 2005). Sharples et al. (2007) demonstrated that internal tidally driven thermocline mixing enhanced diapyc- nal nutrient fluxes, the overall productivity in the thermocline and the associated carbon export to the BBL.
The occurrence of near-inertial oscillations in shelf seas during the stratified season has been reported in several stud- ies from the North Sea (van Haren et al., 1999; Knight et al., 2002) and in other shelf seas (e.g., Rippeth et al., 2002;
MacKinnon and Gregg, 2005). During the presence of baro- clinic inertial waves in the water column, periods of en- hanced shear have been observed in the western Irish Sea (Rippeth et al., 2009), the Celtic Sea (Palmer et al., 2008) and the northern North Sea (Burchard and Rippeth, 2009). These
take the form of shear spikes, which occur approximately ev- ery inertial period and in bursts lasting several days.
While we mainly attributed the observed enhanced turbu- lent mixing to the occurrence of a near-inertial wave, the site’s physical setting has further implications for mixing processes in the thermocline. In the Northern Hemisphere, sites with anti-cyclonic tides, such as Tommeliten, are of- ten characterized by an increased vertical extension of the BBL and higher BBL dissipation rates than comparable cy- clonic sites (see Simpson and Tinker, 2009). As a result of this enhanced BBL thickness, we observed sporadically ele- vated thermocline turbulence resulting from tidal-driven bot- tom turbulence propagating vertically towards the thermo- cline (Fig. 5b). A study by Burchard and Rippeth (2009) also reported that short-lived thermocline shear spikes can arise due to the alignment of the surface wind stress, bulk shear and bed stress vectors in the presence of baroclinic near- inertial motions and barotropic tidal currents. These mech- anisms are stronger with anti-cyclonic tides. Although all the features required for shear spike generation were present dur- ing the observational period, the two-layer mechanism de- scribed by these authors would require a more complex water column structure to be applicable to the Tommeliten site.
The site’s water column structure clearly showed the oc- currence of a 10 m thick transition layer (Fig. 2a). This layer represents the region of the water column where mixing turns from elevated in the SBL to strongly reduced in the interior layer (Ferrari and Boccaletti, 2004). The transition layer is therefore an obligate pathway for solute and heat exchange between the SBL and the interior layer (Ferrari and Boc- caletti, 2004; Rhein et al., 2010) and has been reported to be a region of enhanced shear and near-inertial wave activ- ity (Dohan and Davis, 2011). Although the presented data did not allow quantification of the O2exchange across the transition layer, such contribution might be considerable and thus highly relevant for the cycling of O2and CO2in the up- per water column, which in turn could have direct biological implications.
4.2 BBL O2dynamics
Ultimately, observed O2depletion in the BBL of the central North Sea depends on the supply of organic matter, the rate of carbon mineralization and the flux of O2to the bottom water either from horizontal advection or turbulent vertical trans- port. Our study investigated the significance of turbulent ver- tical O2fluxes to the BBL, which has been previously over- looked in shelf sea carbon balances. Studies focusing on O2 replenishment in the BBL through the thermocline are lim- ited to freshwater systems (e.g., Bouffard et al., 2013; Krel- ing et al., 2014). In a large, stratified water body such as Lake Erie, O2transport from the thermocline to the hypolimnion was found to be substantial, with a magnitude comparable to
∼18 % of the hypolimnetic O2utilization rate over the whole stratification period (Bouffard et al., 2013).
Figure 6. Main O2fluxes in this study. The ranges shown for the interior layer O2fluxes refer to the associated uncertainty and inter- mittency levels. The sediment O2uptake rates (SUR) are based on eddy correlation (EC) measurements (McGinnis et al., 2014), while central North Sea apparent BBL O2loss is based on Greenwood et al. (2010) and this study. Representative O2profiles are based on the AMT sensor on the MSS profiler (solid line) and ship CTD (dotted line). Note that while the O2profiles showed differences in abso- lute concentration within the thermocline, the actual O2gradients within the thermocline-BBL oxycline are comparable.
Horizontal O2gradients and associated horizontal advec- tive O2fluxes were not quantified in this study. Our data sug- gest, however, that such fluxes would not significantly con- tribute to the O2balance at the Tommeliten site. BBL O2con- centration time series (Fig. 5a) did not show any variability at the tidal and/or inertial frequencies, implying that horizon- tal O2 gradients were small. Additionally, mean currents in the BBL were small (∼2 cm s−1)compared to the tidal am- plitudes. This, in conjunction with weak horizontal O2gradi- ents, suggests that horizontal advective O2fluxes during our observational period are negligible compared to the turbulent O2flux from the thermocline.
Based on the above, we can argue that the O2 dynamics during the stratified period are more complicated than previ- ously regarded. To maintain an excess of O2in the thermo- cline, primary producers require adequate nutrient entrain- ment from the bottom water to fuel potential new produc- tion. The resulting increase in (new) productivity and sub- sequent export to the bottom water could boost the carbon turnover estimates substantially. Using a 1 : 1 O2utilization to carbon remineralization (see Canfield, 1993), Greenwood et al. (2010) inferred the average BBL carbon remineraliza- tion rate at the nearby North Dogger to be 15 mmol m−2d−1,
or 180 mg C m−2d−1. Similar results for a typical north- west European shelf sea were obtained via modeling by Sharples (2008), who reported rates ranging from ∼35 to
∼200 mg m−2d−1 for neap and spring tide, respectively.
Their study, however, did not include the daily tidal variation, and thus rates could be much higher on shorter timescales.
With the absence of targeted long-term studies focusing on O2and carbon dynamics in the thermocline and BBL, we can only speculate on the long-term fate of the BBL O2and its re- plenishment from the thermocline by vertical O2fluxes (Fθ).
It seems possible that the overall net BBL water column O2
respiration,R, is higher than previously thought, suggesting a much higher carbon turnover than inferred from the appar- ent O2loss rate. Based on Eq. (6), the BBL carbon reminer- alization (and export to the BBL) would be on the order of nearly 850 mg C m−2d−1, a factor of nearly 5 higher than reported by Greenwood et al. (2010). However, the same tur- bulent transport that supports the O2export from the DCM to the BBL also supports BBL nutrient import to the DCM (Fig. 6). The higher import of nutrients to the DCM likely promotes additional primary production and a subsequent in- crease in organic matter (OM) export to the BBL. In such a scenario, the O2flux to the BBL presented in this “snapshot”
study will be associated with additional OM to the BBL, and therefore lead to a temporary increased remineralization that offsets the increased Fθ. While the overall effect is an in- crease in carbon turnover, this process would not result in any observable change in the decreasing O2trend (apparent O2loss rate).
4.3 Causes and controls on BBL O2depletion
According to Boers (2005), for BBL O2to decrease through- out the stratified season, there must be suitable physical con- ditions, biomass production, nutrient input and continued benthic O2uptake. SUR, and thus the sediment nutrient re- lease and organic carbon mineralization have been shown to be strongly tidally driven (McGinnis et al., 2014). There- fore, we briefly discuss the potential tidal impact driving the overall carbon cycling and suggest factors that may promote the development of lower BBL O2concentrations during the stratification period.
Tidal forcing on diapycnal constituent fluxes and primary production have been explored by e.g., Sharples et al. (2007, 2008). The authors showed that spring–neap tide drives nu- trient fluxes between the BBL and the DCM at the thermo- cline and the carbon export. Based on our velocity measure- ments and estimated O2 fluxes, we can expect similar pat- terns corresponding to semidiurnal tidal fluctuations. Blauw et al. (2012) investigated fluctuating phytoplankton concen- trations in relation to tidal drivers and found that, in the southern North Sea, chlorophyll fluctuations correlated with the typical tidal current speed periods, the semidiurnal tidal cycle, in addition to the day–night and spring–neap periods.
During most of the year, chlorophyll and suspended partic-
ulate matter fluctuated in phase with tidal current speed and indicated alternating periods of sinking and vertical mixing of algae and suspended matter with tidal cycles. Thus, these results suggest that in addition to the spring–neap tidal cy- cles, we can expect a semidiurnal tidal-driven export of car- bon and O2from the DCM to the BBL, and entrainment of nutrients that strongly vary based on a timescale related to the semi-diurnal tidal cycle.
The flux of O2from the DCM production zone downward to the BBL could set the lower limit of the BBL O2concen- tration, and thus the O2 depletion level, during the stratifi- cation period. If there is little isolation between the zone of production and the zone of mineralization, then the net O2
production and O2utilization would nearly balance. In such case, the apparent O2loss in the BBL would either be negli- gible or very small, depending whether the SUR, which is largely particulate organic matter driven, will be balanced by the ventilation from the thermocline. However, histori- cally decreasing BBL O2 concentrations within the North Sea (Queste et al., 2013) point to an increasing disconnect between the primary O2production zone and the mineraliza- tion zone. Greenwood et al. (2010) state that stratification is an important factor which determines susceptibility to O2de- pletion, especially in their nearby study site Oyster Grounds.
Surveys on the North Sea have shown that the regions with the lowest BBL O2concentrations are generally character- ized by the strongest stratification (see Queste et al., 2013), with the lowest values (∼100 µmol kg−1)reported to occur during particularly calm and warm weather (see Boers, 2005;
Weston et al., 2008). Strong gradients in the thermocline as- sociated with warmer temperature are suggested to limit the O2 flux to the BBL (Weston et al., 2008). This points to potential future O2depletion resulting from increasing tem- peratures leading to both stronger stratification and a longer stratification season (Lowe et al., 2009). However, it could be argued that if O2fluxes between the DCM and BBL were suppressed, then the upward nutrient fluxes would be simi- larly suppressed, thus inhibiting primary production and re- ducing the potential for O2deficits.
4.4 Biological perspective
The occurrence of stronger stratification and subsequently re- duced turbulent mixing could alter algal populations (Hick- man et al., 2009), potentially favoring migrating/swimming phytoplankton. Examples of these migrating phytoplankton species, armored dinoflagellates, are extensively found in the DCM of the central and northern North Sea during the summer months; their abundance was found to be largely determined by the local hydrodynamic conditions (Reid et al., 1990). In calm conditions, which are typically associated with stronger stratification, there are often blooms of migrat- ing dinoflagellates which have access to the large nutrient pool in the deeper water and can out-compete non-migrating species for both light and nutrients. Stronger turbulent mix-
ing, in contrast, has been suggested to interfere with their swimming abilities (see Jephson et al., 2012, and references therein).
Due to the limited observational period of this study and our measurement approach, we were not able to observe al- gal migration. However, based on the above literature obser- vations of algae in the central North Sea, we propose that algal migration could be an overlooked mechanism that con- tributes to diminishing bottom water O2levels. By promoting an upward shift of the DCM and moving the associated O2 production higher in the thermocline where turbulence levels are reduced, while still maintaining comparable production rates, even a few meters’ upward shift would substantially re- duce turbulent O2fluxes to the BBL, while maintaining sim- ilar rates of carbon export (settling armored dinoflagellates).
Studies on climate change impacts on the North Sea have suggested that O2 loss in the bottom waters would mainly result from a strengthening of the stratification and O2solu- bility reduction with increasingly warmer waters (e.g., Meire et al., 2013). In those scenarios, the intricate interplay be- tween local tidally driven processes, water column structure, biogeochemical cycling and active phytoplankton migration have not been considered nor quantified. The proposed mech- anism could contribute to the observed decreasing O2 lev- els in the North Sea water column; however, further detailed studies are obviously necessary to test and quantify this ef- fect, and the results described in this study, at the seasonal level.
The Supplement related to this article is available online at doi:10.5194/bg-13-1609-2016-supplement.
Acknowledgements. We are thankful to the captain and crew members of the R/V Celtic Explorer for their outstanding col- laboration and support during the survey, Uwe Koy and Rudolf Link for their logistic support, and Jens Schafstall, Tim Fischer and Markus Faulhaber for their help in data collection and processing. We are grateful for the technical development and support in deployment of the benthic chamber by Ralf Schwarz, Sergiy Cherednichenko and the ROV Kiel 6000 team. Financial support was provided by the Sonderforschungsbereich (SFB) 754 “Climate–Biogeochemisty in the tropical Ocean”, SFB 574
“Volatiles and Fluids in Subduction Zones” and by the Excellence Cluster “Future Ocean” (project 2009/1 CP 0915, LR), supported by the Deutsche Forschungsgemeinschaft (DFG). Additional founding was provided by the National Environmental Research Council (NERC, project NE/J011681/1). The cruise was financed by Wintershall within the Fluid and Gas Seepage in the Southern German North Sea (SDNS) project.
The article processing charges for this open-access publication were covered by a Research
Centre of the Helmholtz Association.
Edited by: B. Currie
References
Batchelor, G. K.: The theory of homogeneous turbulence, Cam- bridge University Press, Cambridge, 1953.
Best, M. A., Wither, A. W., and Coates, S.: Dissolved oxy- gen as a physico-chemical supporting element in the Wa- ter Framework Directive, Mar. Pollut. Bull., 55, 53–64, doi:10.1016/j.marpolbul.2006.08.037, 2007.
Blauw, A. N., Beninca, E., Laane, R. W. P. M., Green- wood, N., and Huisman, J.: Dancing with the tides: fluctu- ations of coastal phytoplankton orchestrated by different os- cillatory modes of the tidal cycle, Plos One, 7, e49319, doi:10.1371/journal.pone.0049319, 2012.
Boers, M.: Effects of a deep sand extraction pit, Final report of the PUTMOR measurements at the Lowered Dump Site, Rijkswater- staat, the Netherlands, RIKZ/2005.001, 87, 2005.
Bouffard, D., Ackerman, J. D., and Boegman, L.: Factors affect- ing the development and dynamics of hypoxia in a large shallow stratified lake: hourly to seasonal patterns, Water Resour. Res., 49, 2380–2394, doi:10.1002/wrcr.20241, 2013.
Brandt, P., Bange, H. W., Banyte, D., Dengler, M., Didwischus, S.-H., Fischer, T., Greatbatch, R. J., Hahn, J., Kanzow, T., Karstensen, J., Körtzinger, A., Krahmann, G., Schmidtko, S., Stramma, L., Tanhua, T., and Visbeck, M.: On the role of circula- tion and mixing in the ventilation of oxygen minimum zones with a focus on the eastern tropical North Atlantic, Biogeosciences, 12, 489–512, doi:10.5194/bg-12-489-2015, 2015.
Burchard, H. and Rippeth, T. P.: Generation of bulk shear spikes in shallow stratified tidal seas, J. Phys. Oceanogr., 39, 969–985, doi:10.1175/2008JPO4074.1, 2009.
Canfield, D. E.: Organic matter oxidation in marine sediments, in:
Interactions of C, N, P and S biogeochemical cycles and global change, edited by: Wollast, R., Mackenzie, F. T., and Chou, L., Springer, Berlin, 333–363, 1993.
Chan, F., Barth, J. A., Lubchenco, J., Kirincich, A., Weeks, H., Pe- terson, W. T., and Menge, B. A.: Emergence of anoxia in the Cal- ifornia current large marine ecosystem, Science, 319, 920–920, doi:10.1126/Science.1149016, 2008.
Crawford, W. R. and Pena, M. A.: Declining oxygen on the British Columbia continental shelf, Atmos. Ocean., 51, 88–103, doi:10.1080/07055900.2012.753028, 2013.
Diaz, R. J.: Overview of hypoxia around the world, J. Environ.
Qual., 30, 275–281, doi:10.2134/jeq2001.302275x, 2001.
Diaz, R. J. and Rosenberg, R. : Spreading dead zones and consequences for marine ecosystems, Science, 321, 926–929, doi:10.1126/Science.1156401, 2008.
Dohan, K. and Davis, R. E.: Mixing in the transition layer during two storm events, J. Phys. Oceanogr., 41, 42–66, doi:10.1175/2010jpo4253.1, 2011.
Efron, B.: 1977 Rietz lecture – bootstrap methods – another look at the jackknife, Ann. Stat., 7, 1–26, 1979.
Ferrari, R. and Boccaletti, G.: Eddy-mixed layer interactions in the ocean, Oceanography, 17, 12–21, doi:10.5670/oceanog.2004.26, 2004.
Ferrari, R. and Polzin, K. L.: Finescale structure of the T-S relation in the eastern North Atlantic, J. Phys. Oceanogr., 35, 1437–1454, doi:10.1175/JPO2763.1, 2005.
Fischer, T., Banyte, D., Brandt, P., Dengler, M., Krahmann, G., Tan- hua, T., and Visbeck, M.: Diapycnal oxygen supply to the trop- ical North Atlantic oxygen minimum zone, Biogeosciences, 10, 5079–5093, doi:10.5194/bg-10-5079-2013, 2013.
Fofonoff, N. P.: Physical properties of seawater: A new salinity scale and equation of state for seawater, J. Geophys. Res., 90, 3332–3342, doi:10.1029/Jc090ic02p03332, 1985.
Glud, R. N.: Oxygen dynamics of marine sediments, Mar. Biol.
Res., 4, 243–289, doi:10.1080/17451000801888726, 2008.
Grantham, B. A., Chan, F., Nielsen, K. J., Fox, D. S., Barth, J.
A., Huyer, A., Lubchenco, J., and Menge, B. A.: Upwelling- driven nearshore hypoxia signals ecosystem and oceano- graphic changes in the northeast Pacific, Nature, 429, 749–754, doi:10.1038/Nature02605, 2004.
Greenwood, N., Parker, E. R., Fernand, L., Sivyer, D. B., Weston, K., Painting, S. J., Kröger, S., Forster, R. M., Lees, H. E., Mills, D. K., and Laane, R. W. P. M.: Detection of low bottom water oxygen concentrations in the North Sea; implications for mon- itoring and assessment of ecosystem health, Biogeosciences, 7, 1357–1373, doi:10.5194/bg-7-1357-2010, 2010.
Hickman, A. E., Holligan, P. M., Moore, C. M., Sharples, J., Krivtsov, V., and Palmer, M. R.: Distribution and chromatic adap- tation of phytoplankton within a shelf sea thermocline, Limnol.
Oceanogr., 54, 525–536, doi:10.4319/lo.2009.54.2.0525, 2009.
Hovland, M. and Judd, A.: Seabed pockmarks and seepage: Impact on geology, biology and the marine environment, Graham and Trotman, London, 1988.
Itsweire, E. C., Osborn, T. R., and Stanton, T. P.: Horizontal distri- bution and characteristics of shear layers in the seasonal ther- mocline, J. Phys. Oceanogr., 19, 302–320, doi:10.1175/1520- 0485(1989)019<0301:HDACOS>2.0.CO;2, 1989.
Ivey, G. N. and Imberger, J.: On the nature of turbu- lence in a stratified fluid, Part I: The energetics of mix- ing, J. Phys. Oceanogr., 21, 650–658, doi:10.1175/1520- 0485(1991)021<0650:OTNOTI>2.0.CO;2, 1991.
Jephson, T., Carlsson, P., and Fagerberg, T.: Dominant impact of water exchange and disruption of stratification on dinoflagel- late vertical distribution, Estuar. Coast. Shelf S., 112, 198–206, doi:10.1016/j.ecss.2012.07.020, 2012.
Jørgensen, B. B. and Revsbech, N. P.: Diffusive boundary layers and the oxygen uptake of sediments and detritus, Limnol. Oceanogr., 30, 111–122, doi:10.4319/lo.1985.30.1.0111, 1985.
Kemp, W. M., Testa, J. M., Conley, D. J., Gilbert, D., and Hagy, J. D.: Temporal responses of coastal hypoxia to nutrient loading and physical controls, Biogeosciences, 6, 2985–3008, doi:10.5194/bg-6-2985-2009, 2009.
Knight, P. J., Howarth, M. J., and Rippeth, T. P.: Inertial cur- rents in the northern North Sea, J. Sea Res., 47, 269–284, doi:10.1016/S1385-1101(02)00122-3, 2002.
Kreling, J., Bravidor, J., McGinnis, D. F., Koschorreck, M., and Lorke, A.: Physical controls of oxygen fluxes at pelagic and benthic oxyclines in a lake, Limnol. Oceanogr., 59, 1637–1650, doi:10.4319/lo.2014.59.5.1637, 2014.
Lorke, A., Umlauf, L., and Mohrholz, V.: Stratification and mix- ing on sloping boundaries, Geophys. Res. Lett., 35, L14610, doi:10.1029/2008GL034607, 2008.
Lowe, J. A., Howard, T. P., Pardaens, A., Tinker, J., Holt, J., Wake- lin, S., Milne, G., Leake, J., Wolf, J., Horsburgh, K., Reeder, T., Jenkins, G., Ridley, J., Dye, S., and Bradley, S.: UK Climate Projections science report: Marine and coastal projections, Met Office Hadley Centre, available at: http://ukclimateprojections.
metoffice.gov.uk/22530 (last access: 11 March 2016), 2009.
MacKinnon, J. A. and Gregg, M. C.: Near-inertial waves on the New England shelf: The role of evolving stratification, turbulent dissipation, and bottom drag, J. Phys. Oceanogr., 35, 2408–2424, doi:10.1175/JPO2822.1, 2005.
McGinnis, D. F., Sommer, S., Lorke, A., Glud, R. N., and Linke, P.: Quantifying tidally driven benthic oxygen ex- change across permeable sediments: An aquatic eddy cor- relation study, J. Geophys. Res.-Oceans, 119, 6918–6932, doi:10.1002/2014JC010303, 2014.
Meire, L., Soetaert, K. E. R., and Meysman, F. J. R.: Impact of global change on coastal oxygen dynamics and risk of hypoxia, Biogeosciences, 10, 2633–2653, doi:10.5194/bg-10-2633-2013, 2013.
Meyer, E. M. I., Pohlmann, T., and Wiesse, R.: Thermodynamic variability and change in the North Sea (1948–2007) derived from a multidecadal hindcast, J. Marine Syst., 86, 35–44, doi:10.1016/j.jmarsys.2011.02.001, 2011.
Neubacher, E. C., Parker, R. E., and Trimmer, M.: Short- term hypoxia alters the balance of the nitrogen cycle in coastal sediments, Limnol. Oceanogr., 56, 651–665, doi:10.4319/lo.2011.56.2.0651, 2011.
North Sea Task Force: North Sea Quality Status Report, Report No.:
1 872349 05 6, London: Oslo and Paris Commissions, 1993.
Osborn, T. R.: Estimates of the local rate of vertical diffusion from dissipation measurements, J. Phys. Oceanogr., 10, 83–89, doi:10.1175/1520-0485(1980)010<0083:EOTLRO>2.0.CO;2, 1980.
OSPAR (Oslo-Paris convention for the protection of the ma- rine environment of the North-East Atlantic): EcoQO Hand- book – Handbook for the application of ecological quality objectives in the North Sea, Report No.: 978-1-905859-46-7, 2nd Edn., OSPAR Biodiversity Series 2009/307, available at:
http://www.ospar.org/v_publications/browse.asp (last access: 11 March 2016), 2009.
OSPAR (Oslo-Paris convention for the protection of the marine environment of the North-East Atlantic): Quality Status Re- port 2010, Report No: 978-1-906840-44-0, OSPAR Commission, London, available at: http://qsr2010.ospar.org/en/index.html (last access: 11 March 2016), 2010.
Otto, L., Zimmerman, J. T. F., Furnes, G. K., Mork, M., Saetre, R., and Becker, G.: Review of the physical oceanography of the North Sea, Neth. J. Sea Res., 26, 161–238, doi:10.1016/0077- 7579(90)90090-4, 1990.
Palmer, M. R., Rippeth, T. P., and Simpson, J. H.: An investigation of internal mixing in a seasonally stratified shelf sea, J. Geophys.
Res., 113, C12005, doi:10.1029/2007JC004531, 2008.
Pfannkuche, O. and Linke, P.: GEOMAR landers as long-term deep- sea observatories, Sea Technol., 44, 50–55, 2003.
Pingree, R. D., Holligan, P. M., and Mardell, G. T.: The effect of vertical stability on phytoplankton distributions in the summer on the Northwest European Shelf, Deep-Sea Res., 25, 1011–1028, doi:10.1016/0146-6291(78)90584-2, 1978.
Prandke, H. and Stips, A.: Test measurements with an operational microstructure-turbulence profiler: Detection limit of dissipation rates, Aquat. Sci., 60, 191–209, doi:10.1007/s000270050036, 1998.
Queste, B. Y., Fernand, L., Jickells, T. D., and Heywood, K.
J.: Spatial extent and historical context of North Sea oxy- gen depletion in August 2010, Biogeochemistry, 113, 53–68, doi:10.1007/s10533-012-9729-9, 2013.
Radach, G. and Lenhart, H. J.: Nutrient dynamics in the North Sea: Fluxes and budgets in the water column derived from ERSEM, Neth. J. Sea Res., 33, 301–335, doi:10.1016/0077- 7579(95)90051-9, 1995
Reid, P. C., Lancelot, C., Gieskes, W. W. C., Hagmeier, E., and Weichart, G.: Phytoplankton of the North Sea and its dynamics – a review, Neth. J. Sea Res., 26, 295–331, doi:10.1016/0077- 7579(90)90094-W, 1990.
Rhein, M., Dengler, M., Sültenfuß, J., Hummels, R., Hüttl-Kabus, S., and Bourles, B.: Upwelling and associated heat flux in the equatorial Atlantic inferred from helium isotope disequilibrium, J. Geophys. Res., 115, C08021, doi:10.1029/2009JC005772, 2010.
Rippeth, T. P., Simpson, J. H., Player, R., and Garcia, M. C.: Current oscillations in the diurnal-inertial band on the Catalonian Shelf in spring, Cont. Shelf Res., 22, 247–265, doi:10.1016/S0278- 4343(01)00056-5, 2002.
Rippeth, T. P.: Mixing in seasonally stratified shelf seas: A shifting paradigm, Philos. T. R. Soc. A, 363, 2837–2854, doi:10.1098/rsta.2005.1662, 2005.
Rippeth, T. P., Wiles, P., Palmer, M. R., Sharples, J., and Tweddle, J.:
The diapcynal nutrient flux and shear-induced diapcynal mixing in the seasonally stratified western Irish Sea, Cont. Shelf Res., 29, 1580–1587, doi:10.1016/j.csr.2009.04.009, 2009.
Schafstall, J., Dengler, M., Brandt, P., and Bange, H.: Tidal- induced mixing and diapycnal nutrient fluxes in the Maurita- nian upwelling region, J. Geophys. Res.-Oceans, 115, C10014, doi:10.1029/2009jc005940, 2010.
Schneider von Deimling, J., Greinert, J., Chapman, N. R., Rabbel, W., and Linke, P.: Acoustic imaging of natural gas bub- ble ebullition in the North Sea: Sensing the temporal, spatial and activity variability, Limnol. Oceanogr.-Meth., 8, 155–171, doi:10.4319/lom.2010.8.155, 2010.
Sharples, J., Moore, C. M., Rippeth, T. P., Holligan, P. M., Hydes, D.
J., Fisher, N. R., and Simpson, J. H.: Phytoplankton distribution and survival in the thermocline, Limnol. Oceanogr., 46, 486–496, doi:10.4319/lo.2001.46.3.0486, 2001.
Sharples, J., Tweddle, J. F., Green, J. A. M., Palmer, M. R., Kim, Y. N., Hickman, A. E. Holligan, P. M., Moore, C. M., Rip- peth, T. P., Simpson, J. H., and Krivtsov, V.: Spring-neap mod- ulation of internal tide mixing and vertical nitrate fluxes at a shelf edge in summer, Limnol. Oceanogr., 52, 1735–1747, doi:10.4319/lo.2007.52.5.1735, 2007.
Sharples, J.: Potential impacts of the spring-neap tidal cycle on shelf sea primary production, J. Plankton Res., 30, 183–197, doi:10.1093/plankt/fbm088, 2008.
Shih, L. H., Koseff, J. R., Ivey, G. N., and Ferziger, J. H.: Parameter- ization of turbulent fluxes and scales using homogeneous sheared stably stratified turbulence simulations, J. Fluid Mech., 525, 193–
214, doi:10.1017/S0022112004002587, 2005.
Simpson, J. H. and Tinker, J. P.: A test of the influence of tidal stream polarity on the structure of turbulent dissipation, Cont.
Shelf Res., 29, 320–332, doi:10.1016/j.csr.2007.05.013, 2009.
Smyth, W. D., Moum, J. N., and Caldwell, D. R.: The ef- ficiency of mixing in turbulent patches: inferences from direct simulations and microstructure observations, J.
Phys. Oceanogr., 31, 1969–1992, doi:10.1175/1520- 0485(2001)031<1969:TEOMIT>2.0.CO;2, 2001.
St. Laurent, L. and Schmitt, R. W.: The contribution of salt fin- gers to vertical mixing in the North Atlantic Tracer Release Ex- periment, J. Phys. Oceanogr., 29, 1404–1424, doi:10.1175/1520- 0485(1999)029<1404:TCOSFT>2.0.CO;2, 1999.
Thomas, H., Bozec, Y., de Baar, H. J. W., Elkalay, K., Frankig- noulle, M., Schiettecatte, L.-S., Kattner, G., and Borges, A. V.:
The carbon budget of the North Sea, Biogeosciences, 2, 87–96, doi:10.5194/bg-2-87-2005, 2005.
van Haren, H., Mass, L., Zimmerman, J. T. R., Ridderinkhof, H., and Malschaert, H.: Strong inertial currents and marginal internal wave stability in the central North Sea, Geophys. Res. Lett., 26, 2993–2996, doi:10.1029/1999GL002352, 1999.
Vaquer-Sunyer, R. and Duarte, C. M.: Thresholds of hypoxia for marine biodiversity, P. Natl. Acad. Sci. USA., 105, 15452–
15457, doi:10.1073/pnas.0803833105, 2008.
Wanninkhof, R.: Relationship between wind speed and gas ex- change over the ocean, J. Geophys. Res.-Oceans, 97, 7373–7382, doi:10.1029/92jc00188, 1992.
Weston, K., Fernand, L., Mills, D. K., Delahunty, R., and Brown, J.: Primary production in the deep chlorophyll maxi- mum of the central North Sea, J. Plankton Res., 27, 909–922, doi:10.1093/plankt/fbi064, 2005.
Weston, K., Greenwood, N., Fernand, L., Pearce, D. J., and Sivyer, D. B.: Environmental controls on phytoplankton community composition in the Thames plume, U.K., J. Sea Res., 60, 246–
254, doi:10.1016/j.seares.2008.09.003, 2008.
Winkler, L.: Die Bestimmung des in Wasser Gelösten Sauerstoffes, Ber. Dtsch. Chem. Ges., 21, 2843–2855, 1888.