ATLAS-CONF-2017-028 09April2017
ATLAS Note
ATLAS-CONF-2017-028
Search for Dark Matter Produced in Association with a Higgs Boson Decaying to b b ¯ at p
s = 13 TeV with the ATLAS Detector
The ATLAS Collaboration 3rd April 2017
Several extensions of the Standard Model predict associated production of Dark Matter
particles with a Higgs boson. Such processes are searched for in final states with missing
transverse momentum and a Higgs boson decaying to a b b ¯ pair with the ATLAS detector
using 36.1 fb
1of pp collisions at a center-of-mass energy of 13 TeV at the LHC. The ob-
served data are in agreement with the Standard Model and limits are placed on the associated
production of Dark Matter particles and a Higgs boson for a simplified Dark Matter model
and without extra model assumptions.
One of the central open questions in physics today is the particle nature of Dark Matter (DM) that com- prises the majority of matter in the Universe [1]. A compelling candidate for DM is a stable electrically- neutral particle whose non-gravitational interactions with Standard Model (SM) particles are weak.
This could extend the SM at the scale of electroweak symmetry breaking [2] and accommodate the ob- served DM relic density [3, 4]. Many models predict detectable production rates of such DM particles at the Large Hadron Collider (LHC) [5].
Most collider-based searches for DM rely on the signature of missing transverse momentum
1E
Tmissfrom DM particles recoiling against one SM particle X radiated o↵ the initial state, denoted as the “X + E
Tmiss” signature. Experiments at the LHC have searched for this X + E
Tmisssignature, where X is a light quark or gluon [6–8], a b- or t-quark [9–11], a photon [12–16], or a W or Z boson [17–20]. The discovery of the Higgs boson h [21, 22] opens a new opportunity to search for DM particles through the h + E
Tmisssignature [23–25]. Because h radiation o↵ the initial state is Yukawa-suppressed, the h + E
Tmissprocess represents a direct probe of the interaction involving DM particles.
This document presents a search for DM in association with a SM-like Higgs boson decaying to a pair of b-quarks, h ! b b, with a branching ratio ¯ BR = 58%, using 36.1 fb
1of pp collisions at p s = 13 TeV recorded with the ATLAS detector [26] in Run 2 of the LHC in 2015 and 2016. This search substantially extends the sensitivity relative to ATLAS results at 8 TeV [27, 28] and 13 TeV [29–31], in the h ! b b ¯ and h ! channels. The improvement is achieved through a combination of increased integrated luminosity and refinements in the analysis techniques.
A Type-II two-Higgs-doublet model (2HDM) with an additional U(1)
Z0gauge symmetry yielding an additional massive Z
0boson provides a h + E
Tmisssignature [25] used for the optimization of the search and its interpretation. This model results in five physical Higgs bosons: a light scalar h identified with the SM Higgs boson in the alignment limit [32], a heavy scalar H, a pseudoscalar A, and two charged scalars H
±. The DM signal in this Z
0-2HDM model is produced through a Z
0mediator coupling to h and A, which subsequently decays to a DM particle-antiparticle pair, A ! ¯, with a large BR. The parameters of the model are the ratio of the vacuum expectation values of the two Higgs fields coupling to the up-type and down-type quarks tan , the Z
0gauge coupling g
Z0, and the masses m
Z0, m
A, and m . The results are also interpreted as exclusion limits on the production cross-section of events with large missing transverse momentum and a SM-like Higgs boson without extra model assumptions.
Monte Carlo (MC) event generators are used to simulate the DM signal and all SM background processes, except the multijet background, which is determined from data.
DM signal samples for the pp ! Z
0! Ah ! ¯ b b ¯ process are generated at tree level with M ad - G raph _aMC@NLO 2.2.3 [5, 33] interfaced to P ythia 8.186 [34], using the NNPDF3.0 parton distribu- tion function (PDF) set [35]. Samples are generated in the (m
Z0, m
A) plane for 0.2 TeV < m
Z0< 3 TeV and 0.2 TeV < m
A< 0.8 TeV with m = 100 GeV, tan = 1.0, g
Z0= 0.8, and assuming BR(A ! ¯) = 100% [5].
Backgrounds from top-quark pair-production and single top-quark production are generated at next-to- leading order (NLO) with P owheg - box [36–40] using CT10 PDFs [41], where the parton shower is simu- lated with P ythia 6.428 [42]. The t t ¯ samples are normalized using calculations at next-to-next-to-leading
1ATLAS uses a right-handed coordinate system with its origin at the nominal interaction point (IP) in the center of the detector and thez-axis along the beam pipe. The x-axis points from the IP to the center of the LHC ring, and they-axis points upward. Cylindrical coordinates (r, ) are used in the transverse plane, being the azimuthal angle around thez-axis. The pseudorapidity is defined in terms of the polar angle✓as⌘= ln tan(✓/2). The distance between two objects in⌘- space is
R=p
( ⌘)2+( )2. Transverse momentum is defined bypT=psin✓.
order (NNLO) in QCD and next-to-next-to-leading logarithmic corrections for soft-gluon radiation [43].
The single top-quark processes are normalized to NLO calculations in Refs. [44–48]. Background pro- cesses involving a vector boson V = W , Z decaying leptonically in association with jets, V + jets, are simulated with S herpa 2.2.1 [49] considering mass e↵ects for b- and c-quarks and using NNPDF3.0 PDFs. The perturbative calculations for V + jets are performed at NLO for up to two partons and at lead- ing order for up to four partons [50, 51], and matched to the parton shower [52] using a ME+PS@NLO prescription [53]. The normalizations are determined in NNLO QCD [54]. Diboson processes (VV ) are simulated at NLO with S herpa 2.1.1 and CT10 PDFs. Backgrounds from associated Vh production are generated with P ythia 8.186 using NNPDF3.0 PDFs for qq ! Vh, and P owheg interfaced to P ythia 8.186 using CT10 PDFs for gg ! Vh.
All MC event samples are processed through a detailed simulation of the ATLAS detector [55] based on G eant 4 [56]. The e↵ects of additional pp collisions occurring in the same and neighboring bunch crossings (pile-up) are simulated by overlaying additional pp interactions generated with P ythia 8.186 and the MSTW2008LO PDF set [57] onto each hard-scatter MC event, where the distribution of the number of such interactions in simulation is adjusted to that observed in data.
Events are selected through an E
Tmisstrigger based on calorimeter information [58]. Its threshold increased as the luminosity rose, from 70 GeV at the beginning to a maximum of 110 GeV in the last two thirds of Run 2. Events are required to have at least one pp collision vertex reconstructed from at least two inner detector (ID) tracks with p
trackT> 0 . 4 GeV. The primary vertex (PV) for each event is the vertex with the highest P ( p
trackT)
2.
Reconstruction of muons (µ) incorporates tracks or track segments found in the muon spectrometer and ID tracks. Identified muons must satisfy the loose quality criteria [59] and have | ⌘ | < 2 . 7. Electrons (e) are reconstructed by matching an ID track to a cluster of energy in the calorimeter. Electron identification uses a likelihood-based method [60]; e are required to satisfy the loose operating point and have | ⌘ | < 2.47.
Muon and electron candidates must have p
T> 7 GeV and are required to be isolated by limiting the sum of p
Tfor tracks within a cone in R around the lepton direction, as in Ref. [29].
Jets reconstructed from three-dimensional clusters of calorimeter cells with the anti-k
talgorithm [61]
are used to identify the h ! b b ¯ decay. For small to moderate h momenta, its decay products can be resolved using small-R jets ( j) with a radius parameter R = 0.4. The decay products of high momenta h are collimated (“merged”) and reconstructed using a single large-R jet (J) with R = 1. Small-R jets with
| ⌘ | < 2 . 5 must satisfy p
T> 20 GeV and are called “central”, while those with 2 . 5 < | ⌘ | < 4 . 5 must have p
T> 30 GeV and are called “forward”. Small-R jets are corrected for contributions from pile-up [62], and central small-R jets with 20 GeV < p
T< 60 GeV and | ⌘ | < 2.4 are additionally required to be identified as originating from the PV using associated tracks [63]. Small-R jets within R = 0 . 2 from an electron candidate are vetoed. Large-R jets are trimmed [64, 65] to reduce the e↵ects of pile-up and the underlying event. Furthermore, large-R jets must fulfill p
T> 200 GeV and | ⌘ | < 2.0. To improve the resolution and minimize uncertainties, the mass of large-R jets is determined by the resolution-weighted mean of the mass measured using only calorimeter information and the track-assisted mass [66]. The latter is obtained by weighting the mass determined using ID tracks alone by the ratio of jet p
Tmeasured in the calorimeter and in the ID.
Multivariate algorithms are used to identify jets containing b-hadrons (b-tagging) that are expected in
h ! b b ¯ decays [65, 67]. These algorithms are directly applied to small-R jets, while for large-R jets they
are applied to track jets matched to large-R jets. Track jets are reconstructed from ID tracks matched to
the PV using the anti-k algorithm with R 0.2, and must fulfill p 10 GeV, and 2.5.
The E ~
Tmissobservable is calculated as the negative of the vector sum of the transverse momenta of the calibrated physics objects (e, µ , jets) in the event. The transverse momenta not associated with any physics objects are accounted for using ID tracks [68, 69]. Non-collision backgrounds are reduced using the ~ p
missTobservable, the negative of the vector sum of the transverse momenta of tracks associated with the PV and within | ⌘ | < 2 . 5.
The signal is characterized by high E
missT, no isolated leptons, and an invariant mass of the h candid- ate m
h,recoconsistent with the observed Higgs boson mass of 125 GeV [70]. In the signal region (SR) described below, the dominant backgrounds from Z( ⌫⌫ ) + jets, W + jets, and t t ¯ production contribute 30 60%, 10 25%, and 15 50% respectively to the total background, depending on E
missTand the b-tag multiplicity. The models for V + jets and t¯ t are constrained using two dedicated control regions (CR): the single-muon control region (1 µ -CR) is designed to constrain the t t ¯ and W + jets backgrounds, while the two-lepton control region (2`-CR) constrains the Z+ jets background contribution.
The SR requires E
missT> 150 GeV, and no isolated e or µ . The multijet background contributes due to mis- measured jet momenta. To suppress this background, additional selections are required: min h ⇣
E ~
Tmiss, ~ p
Tjet⌘i
>
⇡/9 for the three small-R jets leading in p
T, ⇣ E ~
missT, ~ p
Tmiss⌘
< ⇡/2, and p
missT> 30 GeV for events with fewer than two central b-tagged small-R jets.
In the resolved regime, defined by E
missT< 500 GeV, the h candidate is reconstructed from two b-tagged central small-R jets leading in p
T, or from the b-tagged central small-R jet and the highest-p
Tnon-b- tagged central small-R jet if only one b-tag is present in the event. At least one of the jets comprising the h candidate must satisfy p
T> 45 GeV. A separation in between the h candidate and E ~
missTof more than 2⇡/3 is required. To improve the trigger efficiency modeling, events are retained only if the scalar sum H
Tof the p
Tof the two (three) leading jets fulfills H
T,2 jets> 120 GeV (H
T,3 jets> 150 GeV) if two (more than two) central jets are present. Further optimization of the event selection described below provides an additional background reduction by up to 60% relative to Ref. [29], for a small signal loss.
Events with ⌧-lepton candidates, identified either through a boosted decision tree-based algorithm [71] or as small-R jets containing one to four tracks within the jet core and ⇣
E ~
missT, ~ p
Tjet⌘
< ⇡/ 8, are rejected to reduce the t t ¯ background, which can enter the SR if at least one top quark decays as t ! Wb ! ⌧⌫b.
This background is further reduced by removing events with more than two b-tagged central jets. Since most of the hadronic activity in a signal event is expected from the h ! b b ¯ decay, the scalar sum of the p
Tof the two jets forming the Higgs candidate and the remaining leading p
Tjet must be larger than 0.63 ⇥ H
T,all jets. Finally, R ⇣
~ p
jet 1, ~ p
jet 2⌘
< 1.8 is required for the two jets forming the h candidate. If one of those jets contains a muon, the resolution in m
h,recois improved by adding the four-momentum of the µ closest to the jet in R to the four-momentum of the jet, after removing the energy deposit of the µ in the calorimeter [65, 72].
In the merged regime, defined by E
missT> 500 GeV, the large-R jet leading in p
Trepresents the h candidate.
Further selection optimizations reduce backgrounds by up to 30% relative to Ref. [29], for a small signal loss: events containing ⌧-lepton candidates with R ⇣
~ p
⌧, ~ p
large-
Rjet⌘
> 1 are vetoed as described above;
no b-tagged central small-R jets with R ⇣
~ p
small-
Rjet, ~ p
large-
Rjet⌘
> 1 are allowed in the event; and the scalar sum in p
Tof the central small-R jets with R ⇣
~ p
small-
Rjet, ~ p
large-
Rjet⌘
> 1 is required to be smaller than 0.57 times their sum added to the large-R jet p
T. The resolution in m
h,recois improved using muons associated with the large-R jet [65].
The event selection in the 1µ-CR is identical to the SR, except that exactly one isolated µ candidate with
p
µT> 27 GeV is required, and that ~ p
Tµis added to E ~
Tmissto mimic the behavior of such events contaminating
the SR when the muon is not detected.
Events in the 2`-CR are collected using a single-e or single-µ trigger, and selected by requiring one pair of isolated e or µ, one of which must have p
`T> 27 GeV. Events with a Z-boson candidate are retained, identified as having 83 GeV < m
ee< 99 GeV or 71 GeV < m
µµ< 106 GeV with an opposite-charge requirement in the µµ case. In addition, a measure of the E
missTsignificance given by the ratio of the E
Tmissto the square root of the scalar sum of p
Tof all leptons and jets in the event must be less than 3 . 5 GeV
1/2. This requirement separates Z(``)+jets processes from t t ¯ production, as E
Tmisscomes from finite detector resolution for the former and mainly from neutrinos for the latter. In the 2`-CR, the E ~
missTis set to the
~ p
Tof the dilepton system in order to mimic the Z ! ⌫⌫ decays in the SR. The dilepton system is then ignored in the subsequent analysis. All other event selections are identical between the 2`-CR and the SR.
Subdominant backgrounds, including diboson, Vh, and single top-quark production, contribute less than 10% of the total background in the SR and their normalizations are constrained by theoretical predic- tions. Multijet production contributes less than 5% of the total background in the resolved region and is negligible for E
missT> 350 GeV. Its distribution of m
h,recois determined from data in a dedicated multijet-enriched sideband, which is defined through inverting the min h ⇣
E ~
Tmiss, ~ p
Tjet⌘i
requirement.
Dominant sources of experimental systematic uncertainty arise from the finite number of MC events, the calibration of the b-tagging efficiency and integrated luminosity, as well as the scale and resolution of the energy and the mass of jets. The dominant sources of theoretical systematic uncertainty originate from the modeling of the signal and background processes like t¯ t, V+jets, Vh, diboson, and multijet production.
The few relevant changes in the estimation of systematic uncertainties relative to Ref. [29] encompass:
the improved calibrations of the b-tagging efficiency using t t ¯ events [65, 67] as well as of the jet energy and mass scales using various in situ methods [66, 73]; the reduced uncertainty from the novel jet-mass observable [65, 66]; and the uncertainty of 3.4% on the integrated luminosity of data collected in 2016.
Uncertainties associated with the ⌧ vetos are found to be negligible.
Dominant sources of uncertainty are quantified, after the fit to data discussed in the following, for three representative Z
0-2HDM-scenarios with low, medium, and high E
missTin Table 1. This search is statistic- ally limited in most regions of the considered Z
0-2HDM parameter space, except at low E
missT.
A statistical fitting approach [74, 75] to the m
h,recoobservable is used to search for a potential signal contribution. A binned likelihood function that takes into account the Poisson distribution of bin contents and systematic uncertainties on the expected bin contents is constructed. Systematic uncertainties are included in the likelihood function as nuisance parameters with Gaussian or log-normal constraints and profiled [72].
To account for changes in the background composition and to benefit from a higher signal sensitivity with increasing E
missTand b-tag multiplicity, the data are split into categories which are fit simultaneously. Eight categories are defined for the SR and the two CRs: four ranges in E
Tmiss/GeV as [150, 200), [200, 350), [350, 500), and [500, 1 ), which are each split into two sub-regions with one and two b-tags. In the 1µ-CR, the sign of the electric charge of the µ is used in the combined fit to separate t t ¯ from V + jets since the former provides an equal number of µ
+and µ , while an excess of µ
+is expected for the latter process.
Only the total event yield is considered in the 2`-CR due to limited data statistics. The normalizations of
t t, ¯ W + HF, and Z + HF processes are free parameters in the fit, where HF represents jets containing b- and
c-quarks. In the SR, the normalization of Z +jets is increased by about 50% by the fit, while t t ¯ is reduced
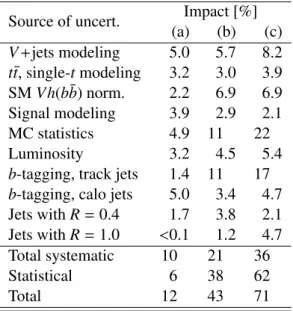
Table 1: Dominant sources of uncertainty for three representative scenarios: (a) with (mZ0,mA)=(0.6 TeV,0.3 TeV) described by low ETmiss, (b) with (mZ0,mA) = (1.4 TeV,0.6 TeV) characterized by medium EmissT , and (c) with (mZ0,mA) = (2.6 TeV,0.3 TeV) featuring highETmiss. The e↵ect is expressed as the fractional uncertainty on the signal yield, assuming total cross-sections of (a) 425 fb, (b) 4.74 fb, and (c) 1.91 fb. Total is the quadrature sum of statistical and total systematic uncertainties.
Source of uncert. Impact [%]
(a) (b) (c) V +jets modeling 5.0 5.7 8.2 t t, single-t ¯ modeling 3.2 3.0 3.9 SM Vh(b b) norm. ¯ 2.2 6.9 6.9 Signal modeling 3.9 2.9 2.1
MC statistics 4.9 11 22
Luminosity 3.2 4.5 5.4
b-tagging, track jets 1.4 11 17 b-tagging, calo jets 5.0 3.4 4.7 Jets with R = 0.4 1.7 3.8 2.1 Jets with R = 1 . 0 < 0.1 1.2 4.7 Total systematic 10 21 36
Statistical 6 38 62
Total 12 43 71
by up to 30% at high E
missT. The normalizations of all other backgrounds modeled using simulations are constrained to theory predictions within uncertainties, as detailed in Ref. [29].
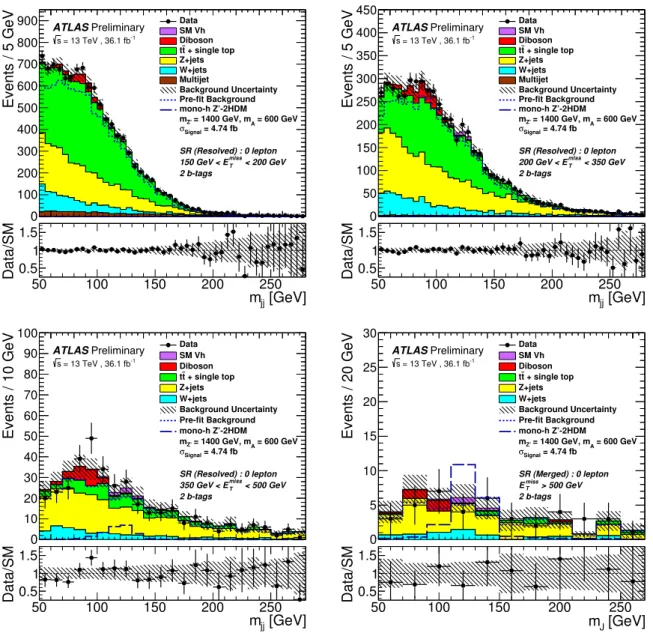
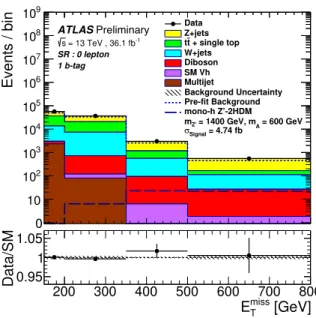
The distributions of m
h,recofor SR events with two b-tags providing the highest signal sensitivity are shown in the four E
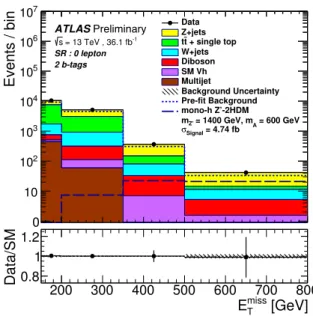
missTregions in Fig. 1. Similarly, the distribution of E
missTfor the same events is shown in Fig. 2. No significant deviation from SM predictions is observed.
The results are interpreted as exclusion limits at 95% confidence level on the production cross-section of h + DM events
h+DM⇥ BR(h ! b b) with the CL ¯
sformalism [76] using a profile likelihood ratio [77] as a test statistic. Within the Z
0-2HDM model, the exclusion contours in the (m
Z0, m
A) space are presented in Fig. 3. The Z
0-2HDM model is excluded for m
Z0up to 2.6 TeV and m
Aup to 0.6 TeV, which represents a substantial improvement on previous results [27, 29]. Furthermore, upper limits are set on the visible production cross-section
vis,h+DMof h + DM events per E
missTbin at detector level. Here,
vis,h+DM⌘
h+DM
⇥ BR(h ! b b) ¯ ⇥ A ⇥ " , where A represents the kinematic acceptance and " accounts for the experimental efficiency. The A ⇥ " term quantifies the probability for an event to be reconstructed in the same E
missTbin as generated and to pass all SR selections except the requirements on m
h,recoand b- tag multiplicity. The results are consistent with SM predictions, as shown in Table 2. To minimize the dependence on the E
Tmissdistribution of a potential h+DM signal, the standard fit approach is modified to analyze one E
Tmissregion at a time in the SR. The Z
0-2HDM model is used to evaluate the dependence of the
vis,h+DMlimits and of A ⇥ " on the event kinematics within a given E
Tmissbin, assuming a generic back-to-back topology of the Higgs boson and E ~
missT. A wide range of (m
Z0, m
A) parameters which yield a sizeable contribution in a given E
missTbin is considered. Variations in the expected limits within 25%
(70%) and in A ⇥ " within 50% (25%) are found in the resolved (merged) regime. The least stringent
limit and the lowest A ⇥ " value in a given E
missTbin are quoted after rounding. The limits in the merged
regime weaken with increasing p
Tof the Higgs boson, and are valid up to about 1500 GeV.
Events / 5 GeV
0 100 200 300 400 500 600 700 800
900 Data
SM Vh Diboson
+ single top t t Z+jets W+jets Multijet
Background Uncertainty Pre-fit Background mono-h Z’-2HDM
= 600 GeV = 1400 GeV, mA
mZ’
= 4.74 fb
Signal
σ ATLAS Preliminary
= 13 TeV , 36.1 fb-1
s
SR (Resolved) : 0 lepton < 200 GeV
miss
150 GeV < ET
2 b-tags
0
[GeV]
mjj
50 100 150 200 250
Data/SM 0.5
1 1.5 0
Events / 5 GeV
0 50 100 150 200 250 300 350 400 450
Data SM Vh Diboson
+ single top t t Z+jets W+jets Multijet
Background Uncertainty Pre-fit Background mono-h Z’-2HDM
= 600 GeV = 1400 GeV, mA
mZ’
= 4.74 fb
Signal
σ ATLAS Preliminary
= 13 TeV , 36.1 fb-1
s
SR (Resolved) : 0 lepton < 350 GeV
miss
200 GeV < ET
2 b-tags
0
[GeV]
mjj
50 100 150 200 250
Data/SM0.5
1 1.5
0
Events / 10 GeV
0 10 20 30 40 50 60 70 80 90 100
Data SM Vh Diboson
+ single top t t Z+jets W+jets
Background Uncertainty Pre-fit Background mono-h Z’-2HDM
= 600 GeV = 1400 GeV, mA
mZ’
= 4.74 fb
Signal
σ ATLAS Preliminary
= 13 TeV , 36.1 fb-1
s
SR (Resolved) : 0 lepton < 500 GeV
miss
350 GeV < ET
2 b-tags
0
[GeV]
mjj
50 100 150 200 250
Data/SM 0.5
1 1.5 0
Events / 20 GeV
0 5 10 15 20 25 30
Data SM Vh Diboson
+ single top t t Z+jets W+jets
Background Uncertainty Pre-fit Background mono-h Z’-2HDM
= 600 GeV = 1400 GeV, mA
mZ’
= 4.74 fb
Signal
σ ATLAS Preliminary
= 13 TeV , 36.1 fb-1
s
SR (Merged) : 0 lepton > 500 GeV
miss
ET
2 b-tags
0
[GeV]
mJ
50 100 150 200 250
Data/SM0.5
1 1.5
0
Figure 1: Distributions of the invariant mass of the Higgs boson candidatesmh,reco=mj j,mJwith twob-tags in the SR for the fourEmissT categories which are used as inputs to the fit. The upper panels show a comparison of data to the SM expectation before (dashed lines) and after the fit with no signal included (solid histograms). The bottom panels display the ratio of data to SM expectations after the fit, with its systematic uncertainty considering correlations between individual contributions indicated by the shaded band. The expected signal from a representativeZ0-2HDM model with (mZ0,mA) =(1.4 TeV,0.6 TeV), assuming a production cross-section of 4.74 fb, is also shown (long- dashed line).
Events / bin
1 10 102
103
104
105
106
107
Data Z+jets
+ single top t t W+jets Diboson SM Vh Multijet
Background Uncertainty Pre-fit Background mono-h Z’-2HDM
= 600 GeV = 1400 GeV, mA
mZ’
= 4.74 fb
Signal
σ ATLAS Preliminary
= 13 TeV , 36.1 fb-1
s SR : 0 lepton 2 b-tags
0
[GeV]
miss
ET
200 300 400 500 600 700 800
Data/SM0.8
1 1.2
0
Figure 2: Distribution ofETmissin the SR with twob-tags. The upper panel shows a comparison of data to the SM expectation before (dashed lines) and after the fit with no signal included (solid histograms). The bottom panel displays the ratio of data to SM expectations after the fit, with its systematic uncertainty considering correlations between individual contributions indicated by the shaded band. The expected signal from a representativeZ0-2HDM model with (mZ0,mA) =(1.4 TeV,0.6 TeV), assuming a production cross-section of 4.74 fb, is also shown (long- dashed line). The rightmost bin includes overflows.
[GeV]
mZ'
500 1000 1500 2000 2500
[GeV]Am
300 400 500 600 700 800 900 1000
h
- m
Z'
= mA
Kin ematic
limit: m
Observed limit 1σ Expected limit ±
= 13 TeV, 3.2 fb-1
s
= 8 TeV, 20.3 fb-1
s ATLAS Preliminary
= 13 TeV, 36.1 fb-1
s
Mono-h(bb), All limits at 95 % CL Z'-2HDM simplified model
= 100 GeV = 0.8, mχ
= 1, gZ
β tan
Figure 3: CLs exclusion contours at 95% confidence level for the Z0-2HDM scenario in the (mZ0,mA) plane for tan =1,gZ0=0.8, andm =100 GeV. The observed limits (solid line) are consistent with the expectation under the SM-only hypothesis (dashed line) within uncertainties (filled band). Also shown are the observed limits from previous ATLAS results atps=8 TeV (long-dashed line) [27] and at ps=13 TeV (dash-dotted line) [29].
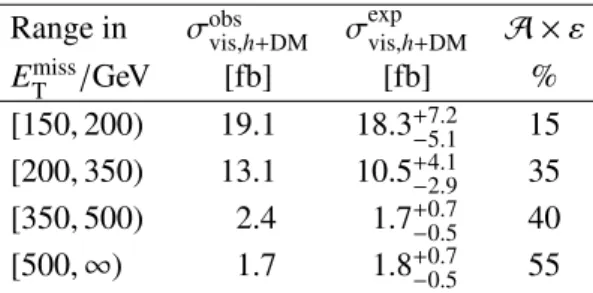
Table 2: Upper limits at 95% confidence level on the visible cross-section vis,h+DMofh+DM events. The observed
obsvis,h+DMis consistent with the expectation expvis,h+DM within uncertainties. Also shown are theA⇥" values to reconstruct and select an event in the sameEmissT bin as generated.
Range in
obsvis,h+DM expvis,h+DMA ⇥ "
E
Tmiss/ GeV [fb] [fb] % [150 , 200) 19.1 18 . 3
+7.25.115 [200, 350) 13.1 10.5
+4.12.935 [350, 500) 2.4 1.7
+0.70.540 [500 , 1 ) 1.7 1 . 8
+0.70.555
In summary, a search for DM produced in association with a Higgs boson in final states with E
Tmissand a b b ¯ pair from the h ! b b ¯ decay was conducted using 36.1 fb
1of pp collisions at p s = 13 TeV collected by the ATLAS detector at the LHC. The results are in agreement with SM predictions, and a substantial fraction of parameter space of a representative Z
0-2HDM model is excluded, significantly improving upon previous results. Stringent limits are placed on the visible cross-section of non-SM events with a Higgs boson decaying as h ! b b ¯ and large E
Tmisswithout extra model assumptions.
We thank CERN for the very successful operation of the LHC, as well as the support sta↵ from our institutions without whom ATLAS could not be operated e ffi ciently.
We acknowledge the support of ANPCyT, Argentina; YerPhI, Armenia; ARC, Australia; BMWFW and FWF, Austria; ANAS, Azerbaijan; SSTC, Belarus; CNPq and FAPESP, Brazil; NSERC, NRC and CFI, Canada; CERN; CONICYT, Chile; CAS, MOST and NSFC, China; COLCIENCIAS, Colombia; MSMT CR, MPO CR and VSC CR, Czech Republic; DNRF and DNSRC, Denmark; IN2P3-CNRS, CEA- DSM/IRFU, France; GNSF, Georgia; BMBF, HGF, and MPG, Germany; GSRT, Greece; RGC, Hong Kong SAR, China; ISF, I-CORE and Benoziyo Center, Israel; INFN, Italy; MEXT and JSPS, Japan;
CNRST, Morocco; FOM and NWO, Netherlands; RCN, Norway; MNiSW and NCN, Poland; FCT, Por- tugal; MNE/IFA, Romania; MES of Russia and NRC KI, Russian Federation; JINR; MESTD, Serbia;
MSSR, Slovakia; ARRS and MIZŠ, Slovenia; DST/NRF, South Africa; MINECO, Spain; SRC and Wallenberg Foundation, Sweden; SERI, SNSF and Cantons of Bern and Geneva, Switzerland; MOST, Taiwan; TAEK, Turkey; STFC, United Kingdom; DOE and NSF, United States of America. In addition, individual groups and members have received support from BCKDF, the Canada Council, CANARIE, CRC, Compute Canada, FQRNT, and the Ontario Innovation Trust, Canada; EPLANET, ERC, ERDF, FP7, Horizon 2020 and Marie Skłodowska-Curie Actions, European Union; Investissements d’Avenir Labex and Idex, ANR, Région Auvergne and Fondation Partager le Savoir, France; DFG and AvH Found- ation, Germany; Herakleitos, Thales and Aristeia programmes co-financed by EU-ESF and the Greek NSRF; BSF, GIF and Minerva, Israel; BRF, Norway; CERCA Programme Generalitat de Catalunya, Generalitat Valenciana, Spain; the Royal Society and Leverhulme Trust, United Kingdom.
The crucial computing support from all WLCG partners is acknowledged gratefully, in particular from
CERN, the ATLAS Tier-1 facilities at TRIUMF (Canada), NDGF (Denmark, Norway, Sweden), CC-
IN2P3 (France), KIT/GridKA (Germany), INFN-CNAF (Italy), NL-T1 (Netherlands), PIC (Spain), ASGC
(Taiwan), RAL (UK) and BNL (USA), the Tier-2 facilities worldwide and large non-WLCG resource pro-
viders. Major contributors of computing resources are listed in Ref. [78].
Appendix
q
¯
q Z0 h
A
¯
Figure 4: Diagram for production of DM particles in association with a Higgs boson in a simplified model where aZ0decays to a Higgs bosonhand a pseudoscalarA.
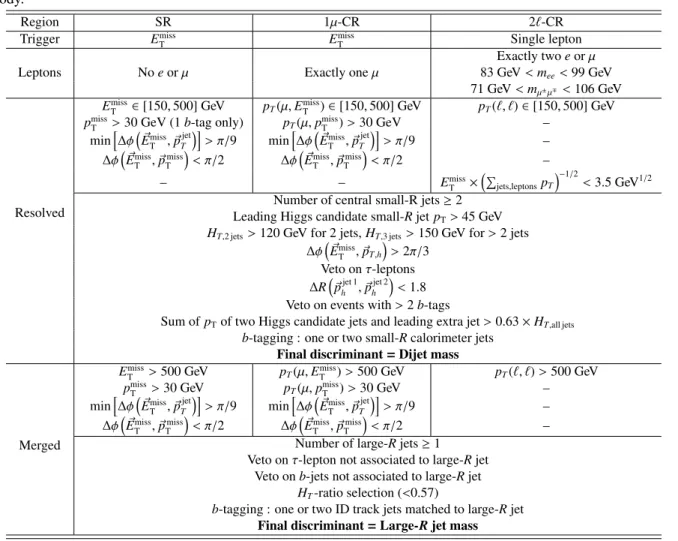
Table 3: A summary of the main analysis selection criteria. The notationpT(A,B) used here is defined as the vector sum of the pT for the objectsAandB. For detailed descriptions of the selection criteria, please refer to the text body.
Region SR 1µ-CR 2`-CR
Trigger ETmiss EmissT Single lepton
Exactly twoeorµ
Leptons Noeorµ Exactly oneµ 83 GeV<mee<99 GeV
71 GeV<mµ±µ⌥<106 GeV
Resolved
EmissT 2[150,500] GeV pT(µ,EmissT )2[150,500] GeV pT(`,`)2[150,500] GeV pmissT >30 GeV (1b-tag only) pT(µ,pmissT )>30 GeV –
minh ⇣E~missT ,~pTjet⌘i
>⇡/9 minh ⇣E~Tmiss,~pTjet⌘i
>⇡/9 –
⇣E~Tmiss,~pTmiss⌘
<⇡/2 ⇣
E~missT ,~pTmiss⌘
<⇡/2 –
– – ETmiss⇥⇣P
jets,leptonspT
⌘ 1/2
<3.5 GeV1/2 Number of central small-R jets 2
Leading Higgs candidate small-RjetpT>45 GeV HT,2 jets>120 GeV for 2 jets,⇣ HT,3 jets>150 GeV for>2 jets
E~missT ,~pT,h⌘
>2⇡/3 Veto on⌧-leptons R⇣
~phjet 1,~phjet 2⌘
<1.8 Veto on events with>2b-tags
Sum ofpTof two Higgs candidate jets and leading extra jet>0.63⇥HT,all jets
b-tagging : one or two small-Rcalorimeter jets Final discriminant=Dijet mass
Merged
ETmiss>500 GeV pT(µ,EmissT )>500 GeV pT(`,`)>500 GeV pmissT >30 GeV pT(µ,pmissT )>30 GeV – minh ⇣
E~missT ,~pTjet⌘i
>⇡/9 minh ⇣
E~Tmiss,~pTjet⌘i
>⇡/9 –
⇣E~Tmiss,~pTmiss⌘
<⇡/2 ⇣E~missT ,~pTmiss⌘
<⇡/2 –
Number of large-Rjets 1 Veto on⌧-lepton not associated to large-Rjet
Veto onb-jets not associated to large-Rjet HT-ratio selection (<0.57)
b-tagging : one or two ID track jets matched to large-Rjet Final discriminant=Large-Rjet mass
Events / bin
1 10 102
103
104
105
106
107
108
109
Data Z+jets
+ single top t t W+jets Diboson SM Vh Multijet
Background Uncertainty Pre-fit Background mono-h Z’-2HDM
= 600 GeV = 1400 GeV, mA
mZ’
= 4.74 fb
Signal
σ ATLAS Preliminary
= 13 TeV , 36.1 fb-1
s SR : 0 lepton 1 b-tag
0
[GeV]
miss
ET
200 300 400 500 600 700 800
Data/SM0.95
1 1.05
0
Figure 5: Distribution ofEmissT in the SR with oneb-tag. The upper panel shows a comparison of data to the SM expectation before (dashed lines) and after the fit with no signal included (solid histograms). The bottom panel displays the ratio of data to SM expectations after the fit, with its systematic uncertainty considering correlations between individual contributions indicated by the shaded band. The expected signal from a representativeZ0-2HDM model with (mZ0,mA) =(1.4 TeV,0.6 TeV), assuming a production cross-section of 4.74 fb, is also shown (long- dashed line). The rightmost bin includes overflows.
[GeV]
200 300 400 500 600 700 800
Fraction of Total Background
0 0.1 0.2 0.3 0.4 0.5 0.6 0.7 0.8
µ-
t t
µ-
W+jets µ+
t t
µ+
W+jets
ATLAS Simulation Preliminary
= 13 TeV s
1 Lepton, 1 b-tags CR vs. W+jets t
t
Charge Separation µ
miss
ET
200 300 400 500 600 700 800
Fraction of Total Background
0 0.1 0.2 0.3 0.4 0.5 0.6 0.7 0.8
µ-
t t
µ-
W+jets µ+
t t
µ+
W+jets
ATLAS Simulation Preliminary
= 13 TeV s
1 Lepton, 2 b-tags CR vs. W+jets
t t
Charge Separation µ
[GeV]
miss
ET
Figure 6: Fraction of thet¯tandW+jets processes to the total sum of backgrounds as a function ofETmissfor events with one and twob-tags in the 1µ-CR. While the former is symmetric in the muon charge, the latter shows an asymmetry which allows to separate the two processes. The rightmost bin includes overflows.