Evolutionary and functional studies of p47 GTPases involved in cell autonomous
immunity
Inaugural-Dissertation zur
Erlangung des Doktorgrades
der Mathematisch-Naturwissenschaftlichen Fakultät der Universität zu Köln
vorgelegt von Cemalettin Bekpen
aus Bolu, Turkei
Köln 2005
Berichterstatter: Prof. Dr. Jonathan C. Howard Prof. Dr. Diethard Tautz
Tag der mündlichen Prüfung: 14.02.2006
Dedicated to My Mother and True Love
OLD MAN
Old man is walking.
Has a dream in his pocket which he eats when he is hungry.
Old man is thinking Thinks to force impossibility Which he couldn’t do when he is child.
Old man is looking Has a view in his mind Which no body can see the same.
Old man is smiling
Smiles because he has just frozen the time Which is not more than his age.
Cologne
21-11-03
TABLE OF CONTENTS
I.INTRODUCTION ...1
I.1.Host-Pathogen Coevolution ...1
I.2.Immunity and Immunity Related Genes...5
I.3.Interferon Inducible GTPases ...9
I.4.Dynamin Family of GTPases...10
I.5.The Family of p47 GTPases ...14
I.6.The Aim of This Study...18
II.MATERIALS AND METHODS ...19
II.1.CHEMICALS, REAGENTS AND ACCESSORIES ...19
II.1.1.Enzymes/Proteins ...19
II.1.2.Reagent Kits ...19
II.1.3.Vectors ...19
II.1.4.Materials for Protein Isolation...20
II.1.5.Media...20
II.1.6.Antibiotics ...21
II.1.7.Bacterial Strains ...21
II.1.8.Eukaryotic Cell Lines...21
II.1.9.Antibodies ...21
II.1.10.Secondary Antibodies and Antisera ...22
II.2.MOLECULAR BIOLOGY ...22
II.2.1.Culture of Eukaryotic Cells...22
II.2.2.Preparation of IRGM(a) Specific Polyclonal Antisera (α4181) ...22
II.2.3.Western Blot Analysis...23
II.2.4.Immunofluorescence ...23
II.2.5.Oligonucleotides...24
II.2.6.Preperation of mRNA and cDNA synthesis...26
II.2.7.RT-PCR on Cells and Tissues...26
II.2.8.5’and 3’ RACE (Rapid amplification of cDNA ends) PCR...26
II.2.9.Site Directed Mutagenesis...27
II.2.10.Real-Time-PCR on Cells...27
II.2.11.Quantification by UV Spectroscopy ...28
II.2.12.Checking the Presence of DNA on Agarose Gel Electrophoresis ...28
II.2.13.Preparation of Competent Cells I ...28
II.2.14.Preparation of Competent Cells II...29
II.2.15.E. coli Transformation...29
II.2.16.Prufication of IRGM(a) Protein, N-Terminally Fused to GST Protein...29
II.2.17.Prufication of IRGM(a) Protein, N-Terminally Fused to MBP Protein...31
II.3.EVOLUTIONARY AND PHYLOGENETICS ANALYSIS ...34
II.3.1.Use of Database Resources ...34
II.3.2.Phylogeny and Alignment Protocols...34
II.3.3.Identification of Transcription Factor Binding Sites...35
III.I.RESULTS I. ...36
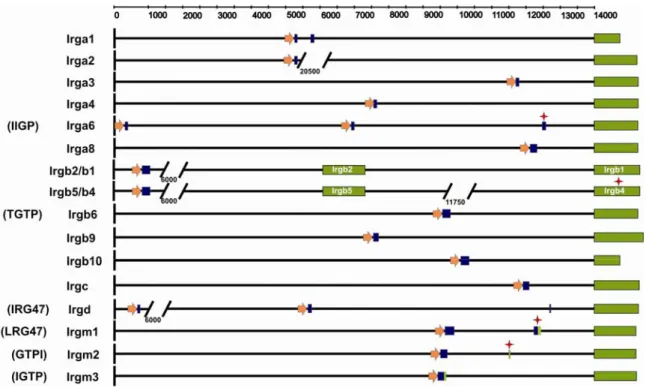
III.I.1.Genomic organization of the p47 (IRG) GTPase genes of the C57BL/6 mouse. ...36
III.I.2.The structure of p47 GTPase genes and their splicing patterns. ...42
III.I.3.The coding sequences of the p47 GTPases...45
III.I.4.Identification of interferon response elements and characterization of the putative promoter of mouse p47 GTPase genes. ...46
III.I.6.The p47 GTPases in other rodents ...52
III.I.7.The p47 GTPase genes of the human genome. ...53
III.I.8.The p47 GTPase genes of the dog genome...55
III.I.9.The p47 GTPase family in other vertebrates...56
III.I.10.The p47 GTPase genes in invertabrates...57
III.I.11.IRG homologues with divergent nucleotide-binding regions: the quasi- GTPases ...58
III.I.12.Positive selection in the family of the p47 GTPases...62
III.II.RESULTS II ...64
III.II.1.The human GMS fragment (IRGM)...64
III.II.2.Purification and analysis of recombinant IRGM(a) protein...65
III.II.3.Immunofluorescence analysis of IRGM(a)-ctag1 and IRGM(b)...68
III.II.4.Westernblot analysis of IRGM protein...70
IV.DISCUSSION...71
IV.1.p47 GTPases are completely absent from the human lineage ...72
IV.2.Evolution of p47 GTPases...78
IV.3.Oligomeric structures in p47 GTPases family ...81
IV.4.Origin of p47 GTPases...83
V.APPENDIX ...84
V.1.Appendix Table 1. List of all IRG gene family members and related genes ...84
V.2.Appendix Table 2. Splicing acceptors and donors for IRG proteins in mouse ...90
V.3.Appendix Table 3. Detailed analysis of Triple formation in Rat...91
V.4.Appendix Table 4. Accession numbers of p47 GTPases or p47 GTPases like sequences in vertebrates ...93
V.5.Appendix Figure 1. Multiple alignment of individual rat proteins (Irgb10,Irgm2, Irgm3) with rat tandem AY321344. ...94
V.6.Appendix Figure 2. Multiple alignment of Czech II mouse p47 GTPases. ...96
V.7.Appendix Figure 3. Multiple alignment of rat and mouse p47 GTP ...97
V.8.Appendix Figure 4. Multiple alignment of dog p47 GTPases. ...100
V.9.Appendix Figure 5. Multiple alignment of C. elegans and classical mouse p47 GTPases. ...101
VI.REFERENCES ...102
VII.SUMMARY ...114
VIII.ZUSAMMENFASSUNG...115
IX.ACKNOWLEDGEMENT ...116
X.ERKLÄRUNG...118
XI.LEBENSLAUF ...119
ABBREVATIONS
IFN-γ Interferon-γ IFN-α/β Interferon-α/β
IFNGR FN-γ receptor
IFNAR IFN-α receptor
iNOS Inducible nitric oxide synthetase
NRAMP1 Natural resistance associated membrane protein 1
PKR Protein kinase R
IDO Indolamine 2,3-dioxygenase
2'-5'-OAS 2'-5'-oligoadenylate synthetase
Phox phogosome oxidase
GAP GTPase activating protein GBP guanylate binding protein GEF guanine nucleotide exchange factor
GED GTPase effector domain
ATP adenosine triphosphate
GDP guanosine diphosphate
GMP guanosine monophosphate
GTP guanosine triphosphate
BSA bovine serum albumine
FCS fetal calf serum
rpm rounds per minute
RT room temperature
OD optical density
ON over night
ORF open reading frame
PBS phosphate buffered saline PCR polymerase chain reaction
PFA paraformaldehyde
PH pleckstrin homology domain
EG Effector genes
SDS sodium dodecylsulfate
SDS-PAGE SDS polyacrylamide gel electrophoresis
U unit
UV ultraviolet
WT wild type
IF immunofluorescence
N-terminal amino-terminal
C-terminal carboxy-terminal
I.INTRODUCTION
Life on earth began about 3.5 billion years ago from a single replicating unit (Schopf, 1993). From the Precambrian period until now life is represented by more than 1.5 million described species and the actual number of species is expected to be more than 10 million (Wilson, 2000). From Larmarck and Darwin on, nearly all of the leading evolutionary biologists believed that main source of this complex diversity of life is evolutionary change.
As summarized by Dobzhansky: “nothing makes sense in biology except in the light of evolution,” Evolution in biology is defined as change in diversity and adaptation in populations of organisms (Mayr, 1978) (Dobzhansky, 1973). However, how the evolutionary changes have been maintained since the beginning of life is a hard question that may never be answered completely (Lewontin, 2002). Natural selection, the primary causal influence of phenotypic evolutionary changes, is the basis of adaptation (Dobzhansky, 1982), (Mayr, 2001), (Lewontin, 1978). Thus, organismal diversity is directly dependent on adaptation of organisms to different conditions occurring throughout the course of evolution.
Adaptive capability of organisms underlies the genetic composition of population as well as environmental interactions and varies from species to species (Dobzhansky, 1982), (Lewontin, 1978). The degree of adaptation is especially important in the co-evolutionary process where two organisms have direct and dynamic interactions with each other, as in host- pathogen interaction. In host pathogen interaction, two independent organisms with their specific adaptation capacity become adaptively interrelated and they start evolving under the selective conditions imposed by each on the other. As a result, both organisms pose continuous positive or negative selection force on each other. Perhaps this is one of the most effective processes at speciation, since fluctuation of two organisms in a population must be continuous from the beginning of their interaction (Haldane, 1949; Rausher, 2001b).
I.1.Host-Pathogen Coevolution
Host pathogen coevolution is the parasitic exploitation of one organism by another.
This kind of coevolution requires direct interaction of two species with each other as in a never ending battle.
It was Haldane (Haldane, 1949) who first stated that host-pathogen interactions
generate diversity both within and between species which not only keeps the species variable,
but also leads to speciation. When the pathogen attempts to exploit resources of the host, it
gets a tremendous selective pressure, and conversely defense against the pathogen drives
selective pressure on pathogen (Rausher, 2001b; Summers et al., 2003). This antagonistic, and direct relationship brings high fitness costs for both the pathogen and the host (Tian et al., 2003) (Rigby et al., 2002). To avoid this high cost for survival both organisms (pathogen and host) prefer to undergo coadaptation. It is expected that host and pathogen coadapt to each other in two different ways. The first way follows from directional selection leading to an arms races and the second way from heterozygote advantage or negative frequency dependent selection, leading to population diversity and transmission problems for the pathogen (Rausher, 2001a; Summers et al., 2003).
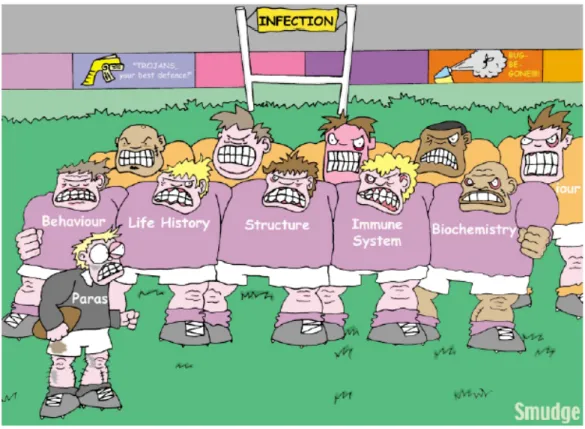
Arms races can be any type of adaptation in order to avoid or eliminate the pathogen, grouped under organisms undergoing external coevolution such as increase in fitness, change in structure, behavior, a robust immune system and internal coevolution such as recognition, destruction of pathogen at the cellular level (Fig 1). The escalating arms races generally lead to low level of polymorphism, whereas the negative frequency dependent selection gives higher level of polymorphism since it is working in a statistical way at the populational level.
Figure 1. Host-parasite interactions (Rigby et al., 2002),
Parasites infect a host by penetrating thorough the external defenses five different ways (indicated by the purple rugby shirts on the front line players). The internal defenses system represented by cell autonomous immunity;
recognition system and effector system (see below) must be defeated (represented by the yellow rugby shirts on the back line) fight with the parasites before the onset of an infection. On the other hand, adaptive evolution by arms race can either be at the level of the above described external or internal defense systems. Cartoon by Neil Smith.
As it is already stated by Haldane “it is much easier for a mouse to get a set of genes which enabled it to resist Bacillus typhimurium than a set which enabled it to resist cat”
(Haldane, 1949). Organismal internal coevolution, also named as molecular coevolution, is
the first step in the process of coadaptation. It is very different from the organismal external coevolution, which usually entails high fitness costs. During host pathogen interaction the host tries to reduce the attacks from the pathogen by building a proper defense system, which increases the organism’s fitness. This leads to generation of organismal diversity as seen in the large differences in resistance between different breeds of mice to a variety of pathogens (Haldane, 1949).
Molecular coevolution (internal defense system) derived by arms races can be explained in two different ways: the first being gene to gene type of molecular coevolution mainly established by early studies on plant-pathogen interaction especially crop plants (Flor, 1971; Summers et al., 2003). In this type of interaction, there are multiple loci in both host and pathogen. For each locus in the host, there is a corresponding locus in pathogens. This type of interaction is usually related with low level of polymorphism. The second type is called as matching allele type molecular coevolution, mainly dependent on higher rate of polymorphism (Frank, 1994). Antagonistic host pathogen interactions are maintained by corresponding loci on each side. In both host and pathogen, there are multiple resistance alleles and virulence alleles respectively. If the pathogen allele matches with resistance allele in the host, then resistance to pathogen is induced. When the pathogens interact with the host, they have to be first recognized and then eliminated.
In a classical battle between two enemies, there are two crucial steps, information, and destruction of the enemy. In order to eliminate your enemy, you have to have better information (self-nonself discrimination) and available army to destroy your enemy. Thus, there must be two steps for direct or indirect antagonistic interaction suggesting that two steps for adaptation. As a result, arms races are performed in two steps; firstly, information exchange between two species (pathogen and host indicated by number 1 in figure 2 ) and second, is function of host effectors which induce the elimination of the pathogen (indicated by number 2 in figure 2) (Trowsdale and Parham, 2004) (Rausher, 2001a; Rausher, 2001b).
Pathogens evolve to defend themselves by various mechanisms such as specialized
mechanisms forming a high rate of diversification, by mimicking the host system, escaping
the host recognition system (antigenic drift) and interfering with the host defense
mechanisms. Host learns to get the information from the pathogen to distinguish self from
nonself by using combination of highly variable recognition systems which leads to
elimination of the pathogen by generating powerful and alternative destruction system
thorough subsequent signaling pathways (Fig 2) (Berriman et al., 2005; Borst, 2002; Rausher,
2001b; Trowsdale and Parham, 2004) (Charles A. Janeway 2005; Galan and Bliska, 1996).
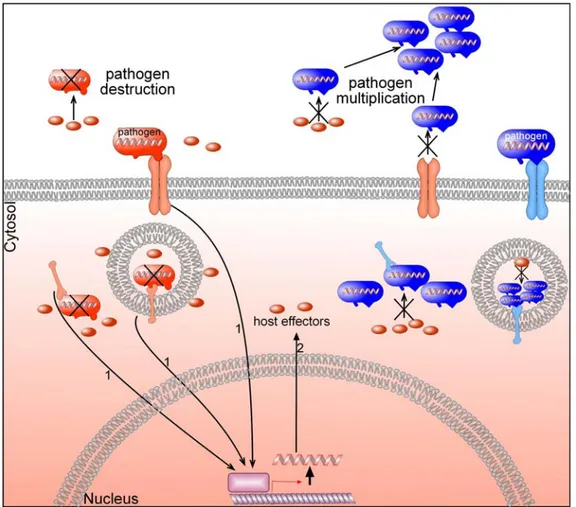
Figure 2. Simplified scheme of the host-pathogen coadaptation at the molecular level.
Arrows marked by number 1 indicates the recognition system and number 2 indicates the host effectors upregulated by recognition system (1). Pathogens are first recognized and the genes or gene families are induced by subsequent signaling pathways. Pathogen which is not recognized or destroyed by the host can multiply (blue). Whereas pathogen which is recognized or destroyed by the host cannot survive (red). By antagonistic direct interactions, host-pathogen coadaptation may occur as indicated in red colors for both pathogen and the host.
A striking example of arms races between a virus and host immunity is the murine cytomegalovirus; In susceptible mice, to turn off host NK cells, murine cytomegalovirus expresses a substitute class I molecule, m157, that binds to inhibitory receptor Ly49i, whereas resistant mice encodes an activating receptor, Ly49h, providing a counter strategy. These two receptors are highly homologous to each other suggesting that they have common evolutionary origin and evolved in response to selective pressure imposed by the pathogen (Vivier and Biron, 2002).
It is likely that the possession of a good destruction or invasion system for host and
pathogen creates a high fitness cost under certain conditions. Otherwise one side would go to
fixation, as is the case for fitness cost for having proper defense against pathogen (Rigby et
al., 2002), (Burdon and Thrall, 2003). For example, plasma membrane protein in A. thaliana,
RPM1, is responsible for recognition of P. syringae (pathogen for plants). Susceptible
inviduals lack the entire coding region of RPM1 and both susceptibility and resistance alleles
frequently occur together within natural populations. Tian et al., generated independent transgenic lines carrying RPM1 and showed that all the transgenic plants have fitness loss such as 9% reduction in total seed production (Tian et al., 2003). Similarly, Mx1 is resistance factor against variety of viruses in mouse such as influenza A and B (see below). The mouse carrying Mx1
-allele is susceptible to influenza virus. The standard laboratory mouse strains all carry the Mx1
-allele except A2G and SL/NiA mice. However, wild mice possess the Mx
+and Mx
-alleles at roughly equal frequencies (Staeheli et al., 1988), (Haller et al., 1987), (Jin et al., 1998a). This suggests that Mx1 gene like RPM1 might create high fitness cost. However, there is no direct evidence for the fitness cost specific to Mx1 gene in mice.
The battle between host and pathogen is mainly carried out by molecular interactions.
These interactions reflect the co-evolutionary balance that the host and pathogen must reach in order to secure their survival. Such interactions are usually maintained by the proteins which are encoded on single genes or gene family in one or multiple locus in both. The genes underlying the host defense includes the substantial proportion of the genome. It is estimated that in Arabidopsis, 14 % of the 21000 genes are directly related to pathogen resistance, and in mice 50 loci distributed over 17 chromosomes are known to be involve in resistance against retroviruses alone. It is reported that at least 1000 genes are upregulated upon interferon stimulation in mouse (Bevan et al., 1998),(Bishop et al., 2000), (O'Brien, 1988), (Boehm et al., 1997).
The fate of a gene sequence or gene family through evolutionary time is determined by a combination of processes. Random genomic events, mutation, recombination, duplication, transposition and loss under the selective processes whether neutral or natural, determine the trajectory of the sequence and its derivatives through the generations. Since neither the genomic processes, nor the selective fate of their derivatives are replicated in multiple evolving lineages, the representation of an ancient gene in modern descendent groups of organisms can be surprisingly various. This is extreme in immunity related genes whose products contribute to host pathogen resistance
I.2.Immunity and Immunity Related Genes
Immunity is the state of protection from infections and tumors. The recognition of the
pathogen by the immune system results in the induction of defense mechanisms leading to the
destruction of the infectious agents. The defense mechanism is highly dependent on the
infectious agent, usually fast evolving, because of the short generation time and high adaptive
capacity. Therefore, immunity related genes are frequently rapidly evolving, resulting in formation of different mechanisms and complex systems to fight against infectious agents.
Organisms especially the higher eukaryotes have generated two distinct types of immune systems. The effector immune mechanism, clearly first recognized by Janeway (Janeway, 1989) we call today as innate immunity. Recent studies reveal that some forms of innate immunity are present almost in all types of eukaryotes (Medzhitov and Janeway, 2000) (Hoffmann et al., 1999) (Janeway, 1989). Vertebrates have an additional highly sophisticated immune mechanism, generating adaptive immunity (Pancer et al., 2004), (Flajnik and Du Pasquier, 2004). In adaptive immunity, specified cell clones devoted to defense have an ability to recognize different subtypes of pathogens. Although, it is not possible to separate these two immune systems completely, the most striking difference between adaptive and innate immunity is in the generation of recognition systems. In the innate immune system recognition is mediated by germ line encoded receptors (e.g. TLR (Medzhitov and Janeway, 1999) (Kimbrell and Beutler, 2001), NOD (Ogura et al., 2001), Scavenger Receptors (Pearson, 1996)). This means that the specificity of receptors is genetically predetermined.
These receptors can recognize patterns that are general to pathogens such as lipopolysaccaride (LPS)/Pathogen associated molecular patterns (PAMPs). Therefore, pathogen recognition receptors (PRR) are essential players in innate immunity. However, the recognition systems of adaptive immunity are generated during the development of T and B cell populations by somatic recombination. This process leads to the generation of very large and extremely diverse cell populations, which varies from individual to individual (Kimbrell and Beutler, 2001), (Flajnik and Du Pasquier, 2004).
To emphasize the distinction between these two mechanisms, I would like to pose a
question: “What were the evolutionary pressure that selected for the development of these two
sets of receptors and the two distinct recognition mechanisms they employ?” (Janeway, 1989)
The answer lies with the terms for coadaptation of host and pathogen. If your enemy has a
high capacity to change its strategy (for example, to escape host immune response, the
African trypanosomes regularly changes their coat (antigenic variation) (Borst, 2002)
(Berriman et al., 2005) (Charles A. Janeway Jr., 2005)), you need to have such system to be
ready for the new approach followed by your enemy. Host must have enough genetic
variation so that the species can change as fast as the pathogen. As a rule for adaptation “if the
genetic variation is inadequate, the species will become extinct (Lewontin, 1978).” It is
impossible to code for such a wide variety of receptors genetically. Additonally, as mentioned
earlier, the genes encoding receptors for adaptive immunity are assembled during the
development of T and B cells. The enormous amount of the varaible regions of these receptors could potentially recognize many very different molecules or proteins (antigen) which are usually specific to the pathogens. The adaptive immune response very specific when compared to innate immunity which is known as non-specifically acting immune mechanism.
Therefore, to generate wide variety of receptor repertoire by somatic recombination must be a big advantage for the host to fight against pathogens, which usually have high evolving capacity.
A recent study shows that the adaptive system arose at two time points during the course of evolution (Beutler, 2005), (Pancer et al., 2004). Immunoglobulins (IGs) are the effector molecules of adaptive immune system. They occur either as membrane-bound cell surface receptors or as free antibodies. T cell (TCR) and B cell (BCR) receptors are generated using the IGs during the development of lymphocytes. However, receptor components of innate immunity are composed of leucine rich repeats (LRRs) which are germline encoded. It was shown by Pancer et al., that like the IGs, LRRs are used to generate variable receptors by somatic recombination in lamprey fish. This clearly shows that receptor components for innate immunity can be also used for adaptive immunity and it suggests that during the host pathogen coevolutionary process lamprey fish used another evolutionary trajectory to generate its adaptive immunity to get high level information.
Innate immunity is present in all higher eukaryotes (Medzhitov and Janeway, 2000).
Clearly, invertebrates and plants can survive without any adaptive immune mechanism
(Hoffmann et al., 1999) and hence, innate immunity might be the most important immune
system acting against pathogens in a wide range than adaptive immunity. One of the very well
known families of innate immune receptors, which exist in vertebrates and invertebrates, are
Toll like receptors (TLR). The Toll receptor was first discovered in a screen for dorso-ventral
patterning in Drosophila (Anderson and Nusslein-Volhard, 1984). It took more than ten years
to find out that in the adult fly the toll receptors have immune function especially to fungal
infections (Lemaitre et al., 1996). Subsequently mammalian homolog, TLR was shown to be
involved in immunity (Medzhitov et al., 1997). The analyses of genetic and physical mapping
of LPS locus in C3H/HeJ and C57BL/10ScCr mice led to the discovery of TLR4 (Poltorak et
al., 1998). Moreover, mice with a targeted deletion for the TLR4 gene were unresponsive to
LPS (Hoshino et al., 1999) and it was shown that TLR2 and TLR4 play differential roles in
the recognition of gram positive and gram-negative bacteria (Takeuchi et al., 1999). All
members of the Toll family are single membrane-spanning proteins and their extracellular
domains are composed of leucine rich repeats (LRR) which recognizes pathogen associated
molecular patterns (PAMPs) such as LPS, flagellin. So far, 23 members of the Toll family have been described both in vertebrates and invertebrates (Roach et al., 2005).
The plant recognition systems use similar receptors. The plant recognition receptors are classified as nucleotide binding receptors and leucine rich repeats (NBS-LRRs) which show significant similarity to NOD receptors in mammals (Ausubel, 2005). For example, FLS2 corresponds functionally to TLR5 in mammals which is flagellin receptors but FLS2 and TLR5 recognize different epitopes in flagellin protein. Similarly, RPM1, RPP5 (receptor proteins from Arabidopsis) are known to take part in immunity and have LRR containing domains (Staskawicz et al., 2001). However, the innate immune system in plants is more specialized than mammalia. As in the case of rice Xa21 gene, a transmembrane protein containing extracellular LRRs recognize species specific secreted molecule from Xanthomonas oryzae rather than broadly conserved PAMPs (Ausubel, 2005) (Fritig et al., 1998) (Kimbrell and Beutler, 2001) (Kayihan et al., 2005). Innate immune system is the first system encounter for the pathogen (within first second to hours of entry) and is considered to be responsible for the induction of adaptive immunity (Medzhitov and Janeway, 1999) which takes several days longer.
Cell autonomous immunity, an effector mechanism in innate immunity is a newly introduced term, describing the ability of individual cells (including non-immune cells) to destroy intracellular pathogens in a cell autonomous manner. In the first instance, the pathogens are recognized by the PRRs. Recognition mobilizes specific destruction systems by the activation of several signaling pathways within cells. A variety of molecules protect cells in different ways. The mechanisms for cell autonomous regulation has been described for PKR (Tanaka and Samuel, 1994), 2’-5’ Oligoadenylate synthesize (Mashimo et al., 2003), Mx (Schwemmle et al., 1995), IDO (Pfefferkorn, 1984), iNOS (MacMicking et al., 1995), LRG47 (Collazo et al., 2001), gp91-phox (Nathan et al., 1983) which act intracellularly.
These genes will hence be referred to as effector genes (EGs) see fig 2 and 3.
These sets of EGs are either inducible by direct signaling events within the cell or by cytokines which activate signaling events in almost any type of cells in the host resulting in induction of EGs.
Cytokines are proteins secreted by cells upon infection or tissue damage. Interferons
are a class of cytokines responsible for managing host defense against pathogens by activating
cells upon infection (Fig 3). They can be classified into three kinds, type I IFNs (ifn-α,β,ω,τ),
type II IFNs (ifn-γ) and recently identified type III IFNs (ifn-λ) (Stark et al., 1998), (Kotenko
et al., 2003), (Boehm et al., 1997), (David, 2002). While IFN γ is mainly secreted by natural
killer and activated T cells (Th1 and Tc1), the interferon receptors are expressed in nearly all types of cells. Differential screens and expression analysis indicate (Boehm et al., 1997) that thereby regulating more than 800 genes constituting a specific and complex defense protecting cells (Boehm et al., 1997) (Dar et al., 2005) .
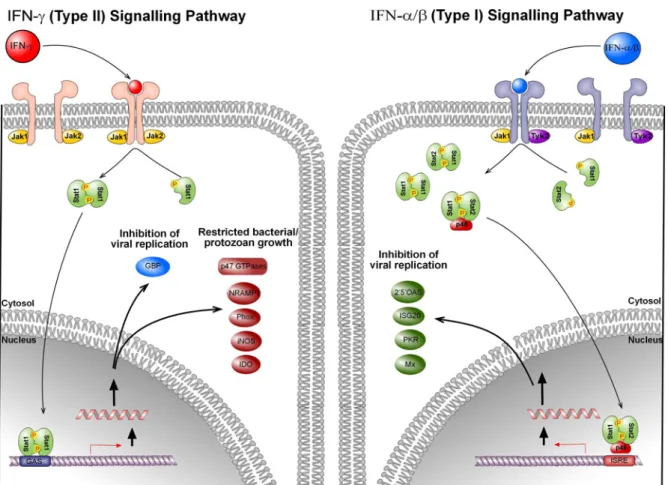
Figure 3. Simplified scheme for the type I and type II interferon signal transduction pathways.
Cytokines bind to their respective receptors and trigger the signalling pathways via phosphorylation of Stat1, Stat2 by Jak1, Jak2, and Tyk2. Activated Stat1 and Stat 2 homodimerize (Type II signaling) or hetoridimerize (Type I signaling) and interact with p48 (IRF9) to form ISGF3 complex. Activation of subsequent genes occurs via binding of Stat1 homodimer or the ISGF3 complex to GAS and ISRE sequences, respectively. IFNs induce set of genes or gene families, that are involved in inhibiting intra- and/or extracellular propagation of virus, bacteria and protozoa. Modified after (Taylor, 2004) and (Stark et al., 1998).
I.3.Interferon Inducible GTPases
Among the plethora of interferon-inducible genes, the importance of the GTPases will be
emphasized because of their abundance as well as their functions. These include the Mx
family of GTPases (Lindenmann et al., 1963), Guanylate binding protein (GBP) family
(Cheng et al., 1985), very large inducible GTPase (VLIG) (Klamp et al., 2003) and the p47
GTPase family (Boehm et al., 1998). These GTPases have similar biochemical characteristics
and functions to the dynamin family of GTPases. These proteins are characterized by their
ability to oligomerize and can display oligomerization-dependent stimulation of GTP
hydrolysis (Warnock et al., 1996). Thus, here they will be grouped as dynamin like GTPases (Praefcke and McMahon, 2004). Though, their phylogenetic relationship is not resolved.
I.4.Dynamin Family of GTPases
Dynamins are GTPases with a molecular weight of about 100 kDa having an N-terminal GTP binding domain, a middle coiled coil domain, a pleckstrin homology (PH) domain involved in binding to phosphoinositides, a GTPase effector domain (GED) which is important for oligomerization, and a C-terminal proline rich domain (PRD) that interacts with SH3 domain containing proteins (Praefcke and McMahon, 2004), (Vestal, 2005), (Song and Schmid, 2003).
Dynamin and dynamin-like GTPases are involved in many processes in the cell. Dynamin1 plays a major role in the endocytic pathway by the scission of clathrin-coated vesicles from the plasma membrane. They are generally classified as large GTPases since they differ in size and function from the small GTPases like the Ras superfamily (p21 ras, an oncogene, which is very well characterized with respect to its GTPase properties and function). However, the mechanism of action of dynamin has not been resolved. Dynamin functions either as mechanochemical enzyme or regulatory enzyme or both; dynamin behaves as mechanochemical enzyme using the energy of GTP hydrolysis to sever vesicles. It differs from the other regulatory GTPases such as ras which upon GTP binding, interacts with several effector molecules, thereby inducing and performing their respective functions in the cell. Dynamin uses the PH domain to bind to membranes, and through the SH3 domains, binds to several effector molecules essential for its endocytic function (Song and Schmid, 2003).
The members of the dynamin family are found in prokaryotes and eukaryotes. Its
function diversifies within the cell from cell division to vesicle scission. Drosophila dynamin
was the first dynamin to be described, recognized via a temperature sensitive mutant in a
locus called “shibire”. Since then many members of the family with similar characteristics
have been discovered.
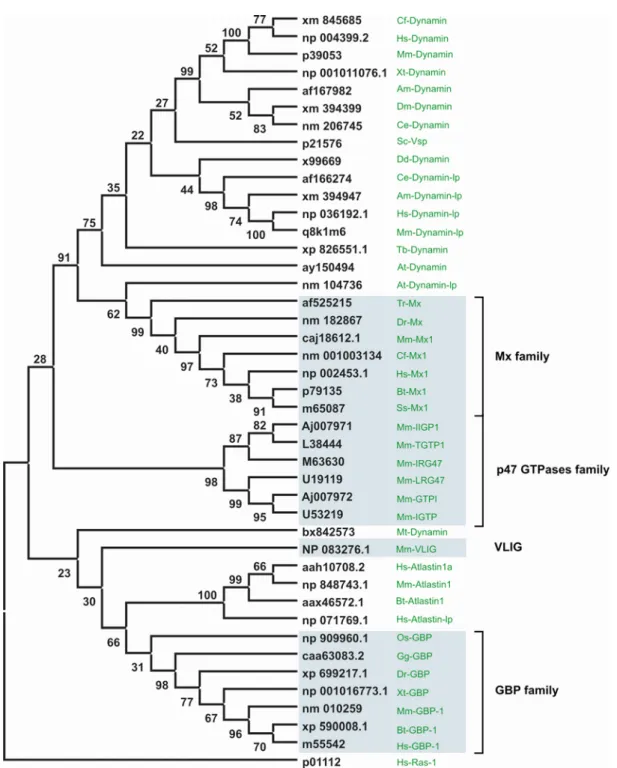
Figure 4. Phylogeny of dynamin and dynamin-like GTPases
Maximum Parsimony tree based on the G-domain of selected dynamin related proteins generated using clustal- X 1.83 (Matrix blosum) for multiple alignment, Mega3.1 for phylogenetic tree construction and bootstrap test.
G-domain is defined according to Hs-Ras-1. Bootstrap values were indicated in black on the branch point. Black and green colored labels indicate the accession numbers and name of the gene, respectively. The blue highlighted genes are found to be inducible by interferon. The species names are abbreviated as Hs (Homo sapiens), Mm (Mus musculus), Bt (Bos taurus), Cf (Canis familiaris), Ss (Sus scrofa), Gg (Gallus gallus), Dr (Danio rerio), Xt (Xenopus tropicalis), Ce (Caenorhabditis elegans), Am (Apis mellifera), Dm (Drosophila melonogaster), Mt (Mycobacterium tuberculosis), Tr (Takifugu rubripes), Dd (Dictyostelium discoideum), Sc (Saccharomyces cerevisiae), Tb (Trypanosoma brucei), Ec (Escherichia coli), At (Arabidopsis taliana), Os (Oryza sativa).
All P-loop GTPases are classified into two main groups: TRAFAC-(GTPase similar to
translation factors) and SIMIBI-(GTPase similar to signal recognition particle) according to
their relationship with translation and signal transduction respectively (Leipe et al., 2002).
The dynamin family belongs to the TRAFAC family of P-Loop GTPases according to the Leipe classification (Leipe et al., 2002). They also showed that the dynamin like subfamily of P-loop GTPases is represented early in the eukaryotic branch. The branch reaches to the LUCA (Last Universal Common Ancestor of the extant life forms) suggesting that they emerged at the beginning of eukaryotic evolution. Based on the similarity in the mechanism of action (see below), the origin of the dynamins can be linked to the septin family of proteins, important for cell division (Field et al., 1996), (van der Bliek, 1999). Septins are necessary for cytokinesis in budding yeast and drosophila. They have an N-terminal GTP binding domain and C-terminal domain which show similar functions to the dynamins (Field et al., 1996).
The dynamin and dynamin like GTPases are also found in plants and invertebrates fig 4 (Praefcke and McMahon, 2004). At least four members of this family are massively inducible by interferons: The guanylate binding protein (GBP), Mx, VLIG and the p47 (IRG) family of GTPases (light blue highlighted in phylogeny Fig 4.). Since the inducible dynamin-like GTPases are major players in cell autonomous immunity, there is no reason to believe that these proteins should not be present in invertebrates and one expects that these genes act in the same way they act in mammals. In fact, we know that members of the GBP family are present in invertebrates, and some of the representatives of Mx GTPases have also been found in plants (Hong et al., 2003) (Dombrowski and Raikhel, 1995). Interestingly, for the p47 GTPases, no homologs have been found in invertebrates and plants (see discussion). It is most likely that genes evolved with the mechanism of immune response, under different selection pressures (coevolution) leading to their disappearance from some of the main branches of the eukaryotes.
GBPs are induced by type I and type II interferons. The first GBP members cloned were HuGBP-1 and HuGBP-2 (Cheng et al., 1991). This family now comprises five members described in human and mouse. GBP-1 has a mass of about 67-kDa and has a unique property of binding to GMP, in addition to GTP and GDP (Cheng et al., 1985). hGBP1 has the canonical GTP binding motifs important for coordinating the binding of guanine nucleotides except for G4 motif, which is different from other GTPases (Praefcke et al., 1999).
Biochemically, it has an ability to oligomerize upon binding to GTP (dimer), GDP-AlFx (tetramer) and shows at least eight fold increase in GTP hydrolysis upon multimerization (Prakash et al., 2000) (Praefcke et al., 1999). Recent analysis showed that hGBP-1 can target specifically to Golgi membrane in its GDP-AlFx bound form (Modiano et al., 2005).
Although GBPs are massively induced by interferons, their function as resistance factors has
not been established. However, it has been reported that hGBP-1 shows an inhibitory effect (40-60%) on EMCV and VSV replication in cultured HeLa cells (Anderson et al., 1999).
However, 35 out of 46 different mouse strains showed inability to express murine GBP-1 upon induction by type I or type II interferon, and no viral susceptibility was observed between the expressing and non-expressing strains. Since the GBP family contains 5 members, no viral susceptibility can be linked to redundant function of the individual GBP proteins (Staeheli et al., 1984) (Vestal, 2005). Additionally, it is reported that hGBP-1 has growth inhibitory effect on endothelial cells and alter the adhesive invasive properties of the cells (Guenzi et al., 2001).
The Mx family of resistance GTPases, especially human MxA, has been shown to be involved in resistance against a wide variety of viruses such as bunyaviruses, orthomyxoviruses, paramyxoviruses, rhabdoviruses, togaviruses, picornaviruses and hepatitis B virus (Gordien et al., 2001; Haller and Kochs, 2002; Janzen et al., 2000; Kochs and Haller, 1999). Mx proteins are mainly induced by type I interferon. The mouse Mx1 gene encodes interferon inducible nuclear protein. As mentioned above, only two lab mouse strains (A2G and SL/NiA) carry the Mx1
+allele and are resistance to the influenza virus. Whereas all the other laboratory mouse strains carry Mx1
-allele and susceptible to influenza virus (Staeheli et al., 1988) (Jin et al., 1998a). In contrast to laboratory strains, it was shown by Haller et al., that wild mice carry the both alleles at equal frequencies (Haller et al., 1987). This suggests that Mx proteins are under the control of balancing selection which can possibly be explained by general fitness cost for resistance genes (Rigby et al., 2002). Like GBP-1, Mx proteins also contain an N-terminal GTP binding domain, middle domain and C-terminal domain which has GED activity. It has low affinity to GTP when compared to ras like GTPases and high rate of GTP hydrolysis following general characteristics of dynamin-like GTPases (Haller and Kochs, 2002; Schumacher and Staeheli, 1998). It has also been shown that human Mx1 and MxA protein can form higher oligomeric structures (Melen et al., 1992) (Kochs et al., 2002a).
However, for the antiviral activity of MxA, formation of large oligomeric structures is not
necessary (Janzen et al., 2000). Recent studies show that MxA specifically recognizes and
sequesters the LaCrosse viral (LACV) N protein into large perinuclear complexes and
oligomeric MxA/N complexes are formed in close association with COP-I-positive vesicular-
tubular membranes (Kochs et al., 2002b),(Reichelt et al., 2004).
I.5.The Family of p47 GTPases
The p47 GTPases are a family of GTPases which is massively induced by interferon gamma (Boehm et al., 1998). The proteins have an N-terminal region, GTP binding domain and highly variable C-terminal region, which might be important for intracellular localization and oligomerization (see discussion). The GTP binding domain of the p47 GTPases has all three classical GTP binding motifs (Fig 5). Apart from G domain, p47 GTPases have no homology to other GTPases. Both N and C-terminal region have characteristic features which distinguish this family from other P-loop GTPases (Fig 4, 5 and see below). IRG 47, isolated as a cDNA from B cells, was the first member to be described (Gilly and Wall, 1992). So far, six of the members have been studied in some detail (Boehm et al., 1998) (Taylor, 2004). At least four of them have been analyzed functionally by targeted gene knockout experiments (Table 1) (Taylor et al., 2000) (Collazo et al., 2001) (Parvanova, 2005) (Taylor, 2004).
Targeted gene knock-out experiments revealed that the p47 GTPases family is indeed involved in resistance against wide variety of pathogens in a non-redundant way (see Table 1) (Taylor, 2004). The phenotype of the knock out mice for LRG47 and IGTP were very striking, showing early death upon infection by Toxoplasma gondii (within first 10 days p.i.) suggesting that these p47 resistance proteins may be the strongest resistance system in mouse.
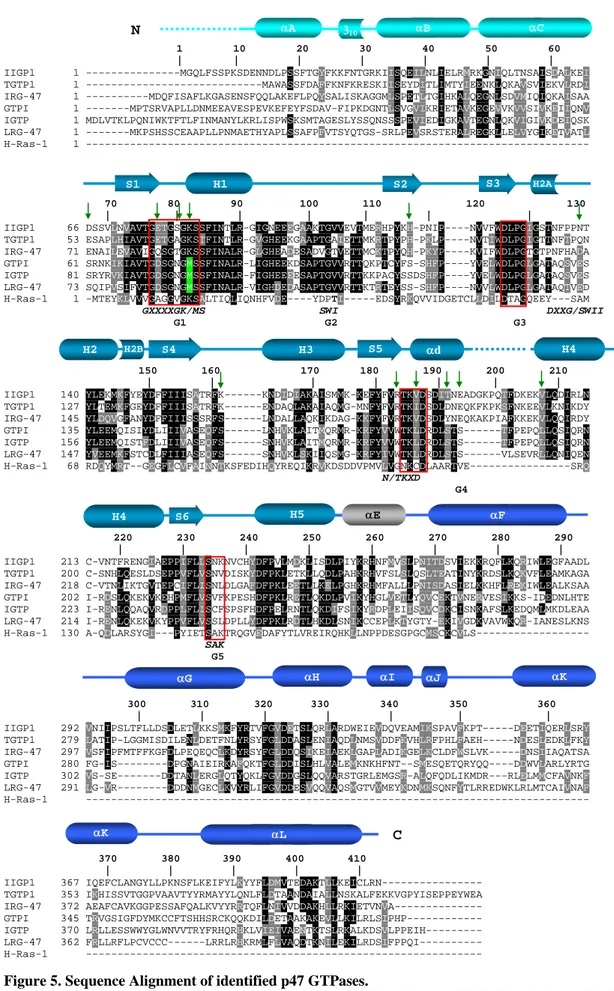
They can be grouped into two structural subfamilies, named GMS and GKS, based on a remarkable substitution in the G1 motif (Fig 4 and 5). The GMS proteins LRG47, IGTP and GTPI (GMS subfamily) carry methionine instead of lysine in their G1 motif. This substitution is a unique feature of the p47 GTPases family. All the P-Loop GTPases have the canonical lysine important for the coordination of the phosphates in the nucleotide. The GMS subgroup of p47 GTPases also contains 12 additional specific amino acid substitutions in their G- domain relative to the members of the GKS subfamily; IIGP1, TGTP1, IRG47 (Fig 5).
Biochemical analysis of recombinant IIGP1 shows low affinity to GTP, slow rate of GTP
hydrolysis, co-operative GTP hydrolysis with ability to form oligomers in a GTP dependent
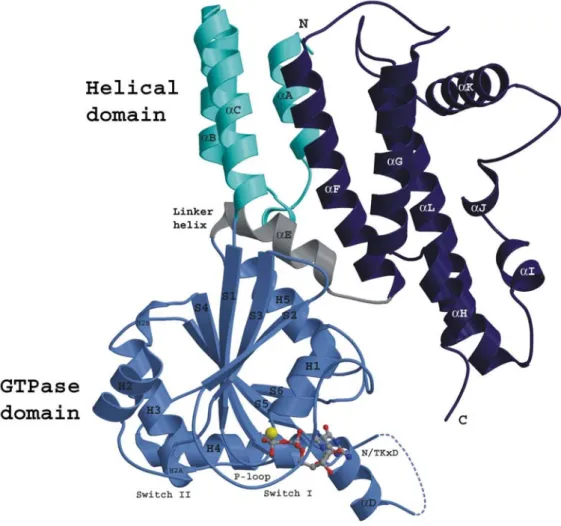
manner (Uthaiah et al., 2003). The crystal structure of IIGP1 (Fig 6) (Ghosh et al., 2004)
shows three N-terminal α-helices followed by a G-domain, which is structurally similar to
GTPase domain of Ras. The G-domain is linked to the C-terminal domain by a short linker
helix (αE) and the C-terminus contains seven α helices. Based on homology within the family
and analysis by secondary structure prediction programs, we can clearly say that IIGP1 is
likely to be structurally representative of all p47 GTPases. Granted, the similarity in the
biochemical characteristics, and sequence analysis, the p47 GTPase family can be grouped
into the dynamin like GTPases. The p47 GTPases are emerging as important cell autonomous
resistance molecules. LRG-47 deficient mice (LRG-47
-/-) have increased susceptibility to M.
tuberculosis. Moreover, Macropahges isolated from LRG-47
-/-mice showed arrested
maturation of phagosomes containing M. tuberculosis (MacMicking et al., 2003). Recently,
Martens et al., reported that astrocytes isolated from IIGP1 deficient mice have increased
susceptiblity to T. gondii (Martens S, 2005). In the resting level, LRG-47 localizes to the
Golgi apparatus and is recruited to the plasma membrane upon phagocytosis whereas IIGP1 is
an endoplasmic reticulum associated protein in fibroblast, hepatocyte and macrophages
(Martens et al., 2004). Recent analysis showed that upon infection by T. gondii TGTP, IIGP1,
IRG47, GTPI and IGTP are accumulated on the parasitophous vacuole (Martens S, 2005).
1 10 20 30 40 50 60 | | | | | | | IIGP1 1 ---MGQLFSSPKSDENNDLPSSFTGYFKKFNTGRKIISQEILNLIELRMRKGNIQLTNSAISDALKEI TGTP1 1 ---MAWASSFDAFFKNFKRESKIISEYDITLIMTYIEENKLQKAVSVIEKVLRDI IRG-47 1 ---MDQFISAFLKGASENSFQQLAKEFLPQYSALISKAGGMLSPETLTGIHKALQEGNLSDVMIQIQKAISAA GTPI 1 ---MPTSRVAPLLDNMEEAVESPEVKEFEYFSDAV-FIPKDGNTLSVGVIKRIETAVKEGEVVKVVSIVKEIIQNV IGTP 1 MDLVTKLPQNIWKTFTLFINMANYLKRLISPWSKSMTAGESLYSSQNSSSPEVIEDIGKAVTEGNLQKVIGIVKDEIQSK LRG-47 1 ---MKPSHSSCEAAPLLPNMAETHYAPLSSAFPFVTSYQTGS-SRLPEVSRSTERALREGKLLELVYGIKETVATL H-Ras-1 1 ---
70 80 90 100 110 120 130 | | | | | | | IIGP1 66 DSSVLNVAVTGETGSGKSSFINTLR-GIGNEEEGAAKTGVVEVTMERHPYKH-PNIP----NVVFWDLPGIGSTNFPPNT TGTP1 53 ESAPLHIAVTGETGAGKSTFINTLR-GVGHEEKGAAPTGAIETTMKRTPYPH-PKLP----NVTIWDLPGIGTTNFTPQN IRG-47 71 ENAILEVAVIGQSGTGKSSFINALR-GLGHEADESADVGTVETTMCKTPYQH-PKYP----KVIFWDLPGTGTPNFHADA GTPI 61 SRNKIKIAVTGDSGNGMSSFINALR-LIGHEEKDSAPTGVVRTTQKPTCYFS-SHFP----YVELWDLPGLGATAQSVES IGTP 81 SRYRVKIAVTGDSGNGMSSFINALR-FIGHEEEESAPTGVVRTTKKPACYSSDSHFP----YVELWDLPGLGATAQSVES LRG-47 73 SQIPVSIFVTGDSGNGMSSFINALR-VIGHDEDASAPTGVVRTTKTRTEYSS-SHFP----NVVLWDLPGLGATAQTVED H-Ras-1 1 -MTEYKLVVVGAGGVGKSALTIQLIQNHFVDE----YDPTI---EDSYRKQVVIDGETCLLDILDTAGQEEY---SAM GXXXXGK/MS SWI DXXG/SWII G1 G2 G3
150 160 170 180 190 200 210 | | | | | | |
IIGP1 140 YLEKMKFYEYDFFIIISATRFK---KNDIDIAKAISMMK-KEFYFVRTKVDSDITNEADGKPQTFDKEKVLQDIRLN TGTP1 127 YLTEMKFGEYDFFIIISATRFK---ENDAQLAKAIAQMG-MNFYFVRTKIDSDLDNEQKFKPKSFNKEEVLKNIKDY IRG-47 145 YLDQVGFANYDFFIIISSSRFS---LNDALLAQKIKDAG-KKFYFVRTKVDSDLYNEQKAKPIAFKKEKVLQQIRDY GTPI 135 YLEEMQISIYDLIIIVASEQFS---LNHVKLAITMQRMR-KRFYVVWTKLDRDLSTS---TFPEPQLLQSIQRN IGTP 156 YLEEMQISTFDLIIIVASEQFS---SNHVKLAITMQRMR-KRFYVVWTKLDRDLSTS---TFPEPQLLQSIQRN LRG-47 147 YVEEMKFSTCDLFIIIASEQFS---SNHVKLSKIIQSMG-KRFYIVWTKLDRDLSTS---VLSEVRLLQNIQEN H-Ras-1 68 RDQYMRT--GEGFLCVFAINNTKSFEDIHQYREQIKRVKDSDDVPMVLVGNKCDLAARTVE---SRQ
N/TKXD G4
220 230 240 250 260 270 280 290 | | | | | | | | IIGP1 213 C-VNTFRENGIAEPPIFLLSNKNVCHYDFPVLMDKLISDLPIYKRHNFMVSLPNITDSVIEKKRQFLKQRIWLEGFAADL TGTP1 200 C-SNHLQESLDSEPPVFLVSNVDISKYDFPKLETKLLQDLPAHKRHVFSLSLQSLTEATINYKRDSLKQKVFLEAMKAGA IRG-47 218 C-VTNLIKTGVTEPCIFLISNLDLGAFDFPKLEETLLKELPGHKRHMFALLLPNISDASIELKKHFLREKIWLEALKSAA GTPI 202 I-RDSLQKEKVKEHPMFLVSVFKPESHDFPKLRETLQKDLPVIKYHGLVETLYQVCEKTVNERVESIKKS-IDEDNLHTE IGTP 223 I-RENLQQAQVRDPPLFLISCFSPSFHDFPELRNTLQKDIFSIKYRDPLEIISQVCDKCISNKAFSLKEDQMLMKDLEAA LRG-47 214 I-RENLQKEKVKYPPVFLVSSLDPLLYDFPKLRDTLHKDLSNIKCCEPLKTYGTY-EKIVGDKVAVWKQR-IANESLKNS H-Ras-1 130 A-QDLARSYGI---PYIETSAKTRQGVEDAFYTLVREIRQHKLLNPPDESGPGCMSCKCVLS--- SAK
G5
300 310 320 330 340 350 360 | | | | | | | IIGP1 292 VNIIPSLTFLLDSDLETLKKSMKFYRTVFGVDETSLQRLARDWEIEVDQVEAMIKSPAVFKPT---DEETIQERLSRY TGTP1 279 LATIP-LGGMISDILENLDETFNLYRSYFGLDDASLENIAQDLNMSVDDFKVHLRFPHLFAEH---NDESLEDKLFKY IRG-47 297 VSFIPFMTFFKGFDLPEQEQCLKDYRSYFGLDDQSIKEIAEKLGAPLADIKGELKCLDFWSLVK---DNSIIAQATSA GTPI 280 FG-IS---DPGNAIEIRKAFQKTFGLDDISLHLVALEMKNKHFNT--SMESQETQRYQQ----DDWVLARLYRTG IGTP 302 VS-SE---DDTANLERGLQTYQKLFGVDDGSLQQVARSTGRLEMGSR-ALQFQDLIKMDR---RLELMMCFAVNKF LRG-47 291 LG-VR---DDDNMGECLKVYRLIFGVDDESVQQVAQSMGTVVMEYKDNMKSQNFYTLRREDWKLRLMTCAIVNAF H-Ras-1 ---
370 380 390 400 410
| | | | | IIGP1 367 IQEFCLANGYLLPKNSFLKEIFYLKYYFLDMVTEDAKTLLKEICLRN--- TGTP1 353 IKHISSVTGGPVAAVTYYRMAYYLQNLFLDTAANDAIALLNSKALFEKKVGPYISEPPEYWEA IRG-47 372 AEAFCAVKGGPESSAFQALKVYYRRTQFLNIVVDDAKHLLRKIETVNVA--- GTPI 345 TRVGSIGFDYMKCCFTSHHSRCKQQKDILDETAAKAKEVLLKILRLSIPHP--- IGTP 370 LRLLESSWWYGLWNVVTRYFRHQRHKLVIEIVAENTKTSLRKALKDSVLPPEIH--- LRG-47 362 FRLLRFLPCVCCC---LRRLRHKRMLFLVAQDTKNILEKILRDSIFPPQI--- H-Ras-1 ---
Figure 5. Sequence Alignment of identified p47 GTPases.
Sequences of 6 mouse p47 GTPases IIGP1 (AJ007971), TGTP1 (L38444), IRG47 (M63630), LRG47 (U19119), GTPI (AJ007972), IGTP (U53219) H-Ras-1 (P01112) showing close homology extending to the C-terminus, aligned on the known secondary structures of IIGP1 (Ghosh et al., 2004). The unusual methionine residues in the G1 motif of GMS proteins are highlighted in green and GMS specific a.a. substitutions are indicated with green arrow. Canonical GTPases motifs are indicated in red boxes.
N αA 310 αB αC
S1 H1 S2 S3 H2A
H3 S5 H4
S4 αd
H2 H2B
H5 αE αF
S6
αH αI αJ αK
αG
αL C
αK H4
Table 1. Summary of phenotype observed to different intracellular pathogens in mice lacking p47 GTPases.
S and R indicate susceptible and resistance respectively. N.D.: not determined. * The susceptibility effect was only observed in cultured cell lines (astrocytes) (Martens S, 2005) and (Parvanova, 2005). Modified after (Taylor, 2004)
Figure 6. Crystal structure of IIGP1 in GDP bound form shown by ribbon presentation (Ghosh et al., 2004)
IIGP1 contains three domains, The N-terminal domain (cyan), G-domain (light blue) and C-terminal domain.
The GTPase domain shows very similar features to the G-domain of H-Ras-1.
I.6.The Aim of This Study
Host-pathogen interactions generate powerful evolutionary forces. Therefore, genes or gene families related with immunity are known to be fast evolving. Involvement of interferon inducible large GTPases in immunity has been described. p47 GTPases, described above, is one of the interferon inducible large GTPases family thought to be involved in providing cell autonomous immunity in mouse. Detailed analysis of six of the family members revealed that p47 GTPases are indeed one of the most important resistance mechanisms of the mouse against variety of vacuolar pathogens. Having such resistance mechanism must be a big advantage for an organism. However, there are no reports of p47 GTPases in man. Hence, the importance of p47 GTPases as a resistance mechanism in mouse is a critical theme to be analyzed. The analysis of six p47 GTPases working in a non-redundant way as a family led us to analyze the evolution of p47 GTPases. Elucidation of the functional relationship between the species especially for mouse seemed imperative.
Detailed analysis of the whole p47 GTPases family was carried out both
phylogenetically and experimentally. The conclusions reached were unexpected, to be
presented and discussed in detail in the following sections.
II.MATERIALS AND METHODS
II.1.CHEMICALS, REAGENTS AND ACCESSORIES
All chemicals were purchased from Aldrich (Steinheim), Amersham-Pharmacia (Freiburg), Applichem (Darmstadt), Baker (Deventer, Netherlands), Boehringer Mannheim (Mannheim), Fluka (Neu-Ulm), GERBU (Gaiberg), Merck (Darmstadt), Pharma-Waldhof (Düsseldorf), Qiagen (Hilden), Riedel de Haen (Seelze), Roth
(Karlsruhe), Serva (Heidelberg), Sigma-Aldrich (Deisenhofen). DNA size standards from Gibco-BRL (Eggenstein), electrophoresis chambers from FMC Bioproducts (Rockland Maine US), developing and fixing solutions for Western Blot detection from Amersham Pharmacia (Freiburg), Luminol from Sigma Aldrich (Deisenhofen), Coumaric acid from Fluka (Neu- Ulm). Deionised and sterile water (Seral
TM) was used for all the buffers and solutions, Ultra pure water from Milli-Q-Synthesis (Millipore).
II.1.1.Enzymes/Proteins
Restriction Enzymes and T4 DNA polymerase from New England Biolabs (Bad Schwalbach)
“Complete Mini” protease inhibitor cocktail from Boehringer (Ingelheim).
Pyrococcus furiosus (Pfu) DNA polymerase from Promega (Mannheim) Shrimp Alkaline Phosphatase (SAP) from Amersham
Thrombin from Serva, (Heidelberg) RNase A from Sigma
1Kb ladder for Agarose gels from Gibco
Rainbow –Molecular weight marker-Precision protein standards
TM( Biorad) Page Ruler Protein Marker from Fermentas
Wide Range Protein Marker from Sigma
II.1.2.Reagent Kits
Plasmid Mini and Midi kit from Qiagen Sequencing Kit from ABI PRISM
Total RNA and mRNA isolation kit from Qiagen
II.1.3.Vectors
PGW1H from British Biotech (Oxford, England)
pGEX-4T-2 from Amersham Pharmacia (Freiburg) pMALp2E from New England Biolabs (Bad Schwalbach) pBlueScript II KS+ from stratagene
pGEMTeasy from Promega pET28b+ from Novagen
pRSET (A,B,C) from invitrogen
II.1.4.Materials for Protein Isolation Ni-NTA Superflow from Qiagen
Amylose Resin from New England Biolabs GST beads from Amersham
II.1.5.Media
Luria Bertini (LB) Medium
10 g Bacto Tryptone, 5 g Yeast Extract, 10 g Nacl, Distilled water to 1Litre LB Plate Medium
10 g Bacto Tryptone, 5 g Yeast Extract, 10 g Nacl, 15 g Bacto Agar, Distilled water to 1Litre Terrific Broth (TB) Medium
12 g Bacto Tryptone, 24 g Yeast Extract, 0.17 mM KH
2PO
4,0.072 mM K
2HPO
4,4 ml Glycerol, Distilled water 1 Litre
IMDM (Iscove’s Modified Dulbecco’s Medium) from Gibco
10% FCS, 2 mM 1-Glutamine, 1 mM Sodium pyruvate, 100 U/ml Penicillin,100 µg/ml
Streptomycin, 1x non-essential amino acids. Media mainly used for the growth of L929, T2 IRF9-/-, MEF and Hela cells.
DMEM (Dulbeco’s Modified Eagle Medium) from Gibco.
10% FCS, 2 mM 1-Glutamine, 1 mM Sodium pyruvate, 100 U/ml Penicillin,100 µg/ml
Streptomycin, 1x non-essential amino acids. Media mainly used for the growth of Hek293, HepG2, MCF-7, SW480, and Primary Foreskin Fibroblast (HS27) cells.
RPMI 1640 + L-Glutamine from Gibco.
10% FCS, 100 U/ml Penicillin,100 µg/ml Streptomycin, 1x non-essential amino acids.
Media mainly used for the growth of Thp1, primary foreskin fibroblast (HS27), and IRF 8 -/-
(50uM 2ME, 6ng/ml GM-CSF, 6ng/ml M-CSF additionally required) cells.
II.1.6.Antibiotics
Ampicillin from Roth was prepared as a stock solution of 100 mg/ml in water, used as final concentration of 100 μg/ml and stored at 4°C. Kanamycin from Sigma stock solution was prepared as 30 mg/ml in water, used as final concentration of 30 μg/ml and stored at -20°C.
Chloromphenicol from Sigma was prepared as 30 mg/ml in EtOH, used as final concentration of 30 μg/ml and stored at -20°C. Penicillin/Streptomycin from Gibco
II.1.7.Bacterial Strains
E. coli XL1-Blue: recA1, end A1, gyrA96, thi-1, hsdR17, supE44, relA1, lac, [F’, pro AB, lacI
qZ∆M15, Tn10 (Tet
r)]
E. coli DH5α: 80dlacZ ∆Μ15, recA1, endA1, gyrA96, thi-1, hsdR17 (r
B-m
B+), supE44, relA1, deoR, ∆(lacZYA-argF)U169
E. coli BL-21: E. coli B, F
-, omp T, hsd S (r
B-m
B-), gal, dcm
E. coli NB42: (Cicchetti et al., 1999) kindly provided by Ralf Max Leonhardt
II.1.8.Eukaryotic Cell Lines Hela (Human cervix Carcinoma) MEFs (Mouse embryonic fibroblasts) L929 (Mouse fibroblast cell line) Thp1 (Human monocytic Leukumia) GS293 (Human embryonic kidney) HepG2 (Human primary liver cancer) MCF7 (Human breast adenocarcinoma) T2 (Lymphoblastoma cell line)
Hs27 (primary foreskin fibroblast)
IRF8 -/- (CL2 cells (Macrophage like cell lines)) IRF3 -/- (MEFs)
IRF9 -/- (MEFs)
MDCK II (Madin-Darby canine kidney cells)
II.1.9.Antibodies
Primary antibodies and antisera
α4181, human IRGM recombinant protein, Rabbit polyclonal antibody, dilution 1:5000 for IB
(Immunoblot), 1:500 for IF (immunoflourescence), generated in this study (see below)
Ctag-1 (Natasa Papic personal communication), peptide (KLGRLERPHRD), Rabit polyclonal antibody, dilution 1:5000 for IF and IB, from Eurogentec. αIGTP, mouse IGTP (283-423), mouse mono clonal antibody in a concentration 0,25 μg/ml, dilution 1:250 for IF from BD Transduction Laboratories. A19, mouse LRG47 (N-terminal), goat polyclonal, IF dilution 1- 100 from Santa Cruz.
II.1.10.Secondary Antibodies and Antisera For westernblot;
IgG anti-Mouse Horseradish peroxidase coupled from Goat (Pierce)
IgG anti-Rabbit Horseradish peroxidase coupled from Donkey (Amersham) For immunofluorescence;
Goat anti-mouse 1-2000 Alexa 488/546 from Molecular Probes, Donkey anti rabbit 1-2000 Alexa 488/546 from Molecular probes and DAPI (Sigma)
II.2.MOLECULAR BIOLOGY II.2.1.Culture of Eukaryotic Cells
Cell lines (see above) were grown in 75cm
2polystrene tissue culture flasks (Sarstedt) with 5%
CO
2at 37°C in a humidified incubater with suitable media appropriate for each cell line (see above). When the cells reached 80% confluency medium was removed and the cells were washed once in 1XPBS then detached from the plastic by trypsinisation (1X Trypsin). To prepare frozen stocks, cells were resuspened in freezing medium (FCS with 10 % di-methyle sulfoxide (DMSO)) in a final cell number (>10
6cells/ml) then cells were kept over night at - 20°C and next morning transferred to -80°C for longer storage cells transferred liquid nitrogen. Transient transfection was performed in Hela, MEFs, L929 and Hek293 cells. Cells were grown up to 80 % confluence in 60mm dishes and transfection with Fugene (FuGENE
TMRoche applied sciences) was performed according to manufacturer conditions; 6 μl of fugene mixed with 90 μl of serum free medium, appropriate amount of DNA was added (minimum 1μg of DNA) mixture incubated at room temperature for 15min- 45min and added to the cells in drop wise manner.
II.2.2.Preparation of IRGM(a) Specific Polyclonal Antisera (α4181)
A rabbit antiserum against IRGM(a) protein was prepared, The rabbit was immunized
subcutaneously with 200 µg purified recombinant MBP-IRGM(a) fusion protein (Figure 21)
which was diluted in up to 500 μl PBS in equal amount of complete Freund’s adjuvant (DifcoLab., Detroit, MI). 2
ndinjections with same protein were given subcutaneously after four weeks with 200 µg in same conditions. Two weeks later 2° bleed was collected and tested versus pre-immune serum by westernblot. 3
rdinjection was performed after 4 months in same conditions but the preparation of recombinant IRGM(a) protein was different; The MBP-IRGM(a) fusion protein was digested over night with thrombin (see above). The digested protein was subjected to Gel-filtration column. The IRGM(a) containing fractions were collected, concentrated with Vivaspin (Vivascience) centrifugal concentrator with 10000 MW cut off and redisolved with 500 μl of resuspension buffer (6M GnCl, 50mM Hepes, 4mM DTT, pH:7.5). Resuspended IRGM(a) recombinant protein was subjected to Gel- filtration coloumn. The fractions were collected and dialyzed against PBS in a volume ratio 1 to 500 over night. Dialyzed fractions were checked on the gel and stored at -80°C. 4
thinjection was performed after 4 months in the same conditions above. Amount of the protein were determined using the Bradford assay. Antisera from all the bleeds, the pre-bleed prior immunisation, first, second, third, and the fourth bleeds kept at room temperature for over night and next morning were obtained by centrifugation of the clotted blood at 3000g for 7 min at 4°C and stored at -20°C. Western blots were done on transfected and un-transfected cell lysates using different dilutions of the pre-bleed, and partially depleted 2
nd, 3
rdand 4
thbleed to check the specificity for pre-bleed control.
II.2.3.Western Blot Analysis
Proteins were run on SDS-PAGE gel and transferred to nitrocellulose membrane by electroblotting. Ponceau-S (0.1% Ponceau-S (w/v) (Sigma), in 5% acetic acid) staining was used to define the place of the proteins on nitrocellulose membrane. Membrane was blocked with 5% milk powder, 0.1% Tween 20, for 15 hours at 4°C. Antisera/antibody was diluted in PBS, 10%FCS, 0.1 Tween20, and protein bands visualized using the enhanced chemiluminescence (ECL) substrate.
II.2.4.Immunofluorescence
Appropriate cell lines (see above) grown on 22X22 mm coverslips in 6 well plates were
induced, left uninduced with interferon γ or transfected with GTPase constructs. After 24
hours medium was removed. The cells were washed with 2ml of PBS and fixed with 2 ml of
PBS/3%Paraformaldehyde for 20 min at RT. Cells were washed 3times with PBS and washed
with 2 ml PBS/0.1% Saponin incubated for 10min at RT. Wash buffer was removed and immediately cells were blocked by adding PBS/0.1 %saponin/3% BSA and incubated for 1hour at room temperature in 6 well plates. Coverslips were incubated with 100 μl of PBS/0.1
%Saponin/3% BSA which contains appropriate antibody dilution (see above) on parafilm in humid environment for 1 hour at RT temperature or over night at 4°C. Coverslips were put in to the 6 well plates and washed with 3X 5 ml of PBS/0.1% Saponin. Coverslips incubated with 100 μl of PBS/0.1 %Saponin/3% BSA which contains appropriate secondary antibody dilution (see above) or dapi (1:1000) on parafilm in humid environment for 30 min at RT temperature in dark conditions. Coverslips were put into the 6 well plates and washed with 3X 5 ml of PBS/0.1% Saponin. Finally, coverslips were put on to the slide with 20 μl of ProLong Gold antifade reagent (Molecular Probes). After over night incubation cells were observed with a Zeiss Axioplan II fluorescence microscope equipped with a cooled CCD camera (Quantix) using the Metamorph software (version 4.5r3, Universal Imaging Corp.)
II.2.5.Oligonucleotides
Oligonucleotides were designed using the programs, primer3 (http://frodo.wi.mit.edu/cgi- bin/primer3/primer3_www.cgi),Netprimer
(http://www.premierbiosoft.com/netprimer/netprlaunch/netprlaunch.html).
All oligonucleotides were from invitrogen, nucleotides were supplied as powder and resuspended to a final concentration 100pmol/μl then diluted 1 in 10 to 10pmol/μl as final concentration. For each reaction 1μl was used.
Gene Primers 5’ to 3’
GCCTCTAGCTGCTGGGACCTGTCTCAGGTCACATCTGAG
Irgc
GCGGGTGGCCGCCAGATCCTCGTCCACC GGAGATCCTATCAGTGGGGAGAGTGTGAGGG
IRGC (human)
CCTCTCTGAAGCCCGACGGCCG CTGTATCCGGAAATTCTTCCCAAAG
GBP-1 (human)
CTTCAATGGCCTCTCTCTCACTGTC ATGACAACTTTGGTATCGTGGAAGG GAAATGAGCTTGACAAAGTGGTCGT
GAPDH (human)
ATATTTCTGGGCCTTGTGGAATTCAC
AAAGTTCTACTTTGTCCGAACCAAGATAGATCAAGAT
Irgb1-3-8
CTCTTCCTTATTAAGGAGAGACTTGGCATCACTTG GGTACATACAACCACTGAGAGAACACCATACACTTACA
Irgb2-5-9
ATGGTATGGTAGCCCATGCTCTTGGCA
TCTACTTTGTCAGAACCAAGATAGACAGCGACTTAGA
Irgb6
GCCATGCGATAGTAAGTGACTGCAGCG TCATTATTGTCTCTGCTGGACGCATTAAACAT
Irgb7
TTAGAGACTAAGAAGACTGGAGGCTCCTGGTG
Irgb8
CGCTTATCTAGACCAAGTGGGATTTGCCAList of Primers
CAACCACTATGTTAAGGAACTGTGTGCGCC CGGAATCAAGGAGACTGTGGCAACATTG
Irgm1
TCCTGGGCAACTAAGAAAAGCATGCGTT GATCTCGGATCCGGGTAACGCGAT
Irgm2
TAACAGAACTTCCTTGGCTTTGGCAGCAG CTGGAGGCAGCTGTCAGCTCCGAG
Irgm3
GTCCTTTAGAGCTTTCCTCAGGGAGGTCTTG TGCTGCCTTGACAGACATTGAGAAAGCC
Irgb10
GCTGCGTTAGCATTCTGCAGATTCTTTACAC TTCCCTTGTCAATGTGGCTGTCACTGG
Irga1
AGAAAGGTCAGTGAAGGTATGATAGTAGCACACCAG CACAGGTGGACTCTGACTTAAGAAATGAAGAGGATT
Irga2
ACTTTCTAAGAAGAAGCTCAGTAGCCCATCTGC AGCTATGCTTGAAAAGGGGGGACTTTCAG
Irga3
TATGGGCAAAATGAGTTTGAGCCGCTT
GCTGAAGTTGGAGTAATAGAGACAACTATGAAGAGAACTTCT
Irga4
TGTGTCAAGGATATGAAGTTGTAAATAATAGATTGCAGG CTGACACTAGGAGATGTTCAGCAAGCAAATAATG
Irga5
AAGGAAAAGAAGTGGTAAGTAAAAGGCTTTCTCCATATA ATCAGTGATGCATTAAAAGAAATCGATAGTAGTGTGC
Irga6
GTCAGAGAAGGGATGATATTCACTAGGTCAGCAG CACAATTTTATGCTTTCTCTGCCTGGCATT
Irga7
TCAGCAAATGAGGGGACTTCATTATTTCTTTTACTT GAGTTATGCCTGAAGAAGGGGGACATTCA
Irga8
TGAGTTTGAGCTATTTTTTTGAATATGCCTCTTTAAGG GCTGGCAAGTCCTCCCTCATCAAC
IRGC
GAGAGGTTGGACACGAGGAAGATGC TCCTTTCTCAGGAGGCCATCACTTC
IRGB2
GCCAGTTGTGCATCATTGATTGTGA GAAAAGGCATTGGGAGATGGGAAGT
IRGM5
AACCTTTTCCCCTGTCTTTGGATGG GAGAGAGCATCCAGTGTCCCATTGA
IRGM6
GATGGGTTCGAAAACCCTCTCCTTC ACCCAGTCCCTTCACACTCCATCAC
IRGM4
TAGCAAGTGGGAATCTGGGTGGTTC CAGGACACCAGTTAACATCACTATG
IRGMs1-r1 (human)
GATTTTCCAGGACATTTTCTCTGAT
IRGM-rGMS (human)
ATATTTCTGGGCCTTGTGGAATTCAC
GAGAAAGCCTCAGCAGATGGGAACTTG
IRGM(b-e)
f10-r60
GCACTGGCTAGCTAGCTGTTGAATATCCTGAGGACTCTGGCAATGGGATGAACACCTTCATCAGTGCCCTTCG
IRGMmn
CGAAGGGCACTGATGAAGGTGTTCATCCCATTGCCACAGTCC
IRGM5’(HindIII)
CCCCCAAGCTTATGAATGTTGAGAAAGCCTCAGCAGIRGMctag1(EcoR1)
CCCCCGAATTCTTAGTCACGATGCGGCCGCTCGAGTCGACCTAGTTTG TATTCACATACCCGCTCCTTCTGGIRGMhistag(EcoR1)
CCCCCGAATTCTTAATGATGATGATGATGATGGTATTCACATACCCGC TCCTTCTGGIRGM(b)3’
(HindIII)
GCGCAAGCTTCTAGCTGTTGAATATCCTGAGCAGATTTAC
5’ Anc
GGCCACGCGTCGACTAGTACGGGIIGGGIIGGGIIEst Stop
CCCCCAAGCTTCAGGATCCTTTCAGCAAGCAAGAGGIRGMr1 (human)
GATTTTCCAGGACATTTTCTCTGAT5’(1-2)
CCCCCGGATCCATGAATGTTGAGAAAGCCTCAGCAP
GGCCACGCGTCGACTAGTAC(T)17AUAP
GGCCACGCGTCGACTAGTACUAP
(CUG)4GGCCACGCGTCGACTAGTACGTCTACATGTTCCAGTATGACTCCACTCACGG
GAPDH (mouse)
GTTGCTGTAGCCGTATTCATTGTCATACCAGG