Biochemical, Structural and Cellular Studies on IIGP1, a Member of the
p47 Family of GTPases
Inaugural-Dissertation zur
Erlangung des Doktorgrades
der Mathematisch-Naturwissenschaftlichen Fakultät der Universität zu Köln
vorgelegt von Revathy C Uthaiah
aus Bangalore
Köln 2002
The thesis work was supported by the Graduate programme "Genetics of cellular systems "
funded by the Deutsche Forschungsgemeinschaft, and also by the Land Nordrhein-Westfahlen.
This work was done in the Institute for Genetics, University of Köln under the supervision of Prof. Jonathan C. Howard. A part of the work was done in collaboration with the Max Planck Institute for Molecular Physiology, Dortmund, under the guidance of Dr. Christian Herrmann in the group of Prof. Alfred Wittinghofer. I am grateful to all these institutions.
Berichterstatter : Gutachter Prof. Jonathan C. Howard Gutachter Prof. Thomas Langer
Tag der mündlichen Prüfung : 14.02.03
To my family
Mirth and mockery,
Entwined in a flowing stream.
The meadow of knowledge, Of progress and destruction, Back and forth, a move For poise….
Anonymous
CONTENTS
I. INTRODUCTION… ... .1
I.1. Infection and Immunity... 1
I.2. Cytokines as Mediators of Innate and Adaptive Immunity ... 2
I.3. Interferon Dependent Cell Autonomous Resistance... 4
I.3.1. Interferon Inducible GTPases Contributing to Cell Autonomous Resistance ... 5
I.3.1.1. Mx GTPases... 6
I.3.1.2. p65 GTPase Family... 6
I.3.1.3. p47 GTPase Family... 7
I.4. GTPases, Functions and Features ... 9
I.4.1. Characteristic Features of the G Domain... 10
I.4.2. Deviation from the Switch GTPases... 11
I.5. Objective of this Work... 12
II. MATERIALS AND METHODS ... 15
II.1. Chemicals and other Accessories ... 15
II.2. Materials ... 15
II.3. Enzymes/Proteins ... 15
II.4. Reagent Kits ... 16
II.5. Vectors... ... 16
II.6. Oligonucleotides ... 16
II.7. Constructs ... 17
II.7.1. pGEX Constructs ... 17
II.7.2. pGW1H Constructs... 17
II.8. Media ... ... 18
II.9. Bacterial Strains... 19
II.10. Antibiotics ... 19
II.11. Cells . 20 II.12. Radioisoptopes... 19
II.13. Antibodies... 19
II.14. Detergents ... 19
II.15. Equipments ... 20
II.16. Protocols ... 20
II.16.1. Molecular Biology... 20
II.16.1.1. Agarose Electrophoresis ... 20
II.16.1.2. Polymerase Chain Reaction... 20
II.16.1.3. Restriction Enzyme Digestion ... 21
II.16.1.4. Purification of DNA Fragments... 21
II.16.1.5. Ligation... 21
II.16.1.6. Preparation of Competent Cells... 21
II.16.1.7. Transformation ... 22
II.16.1.8. Plasmid DNA Isolation... 22
II.16.1.9. Determination of the Concentration of DNA ... 23
II.16.1.10. Site Directed Mutagenesis ... 23
II.16.1.11. DNA Sequencing ... 23
II.16.2. Expression and Purification of Proteins ... 24
II.16.2.1. Growth and Harvest of Bacteria ... 24
II.16.2.2. Glutathione-Sepharose Affinity Chromatography... 24
II.16.2.3. Concentration of Proteins by Ammonium Sulphate Precipitation ... 24
II.16.2.4. Size-exclusion Chromatography... 25
II.16.2.5. Concentrating Proteins by Ultra-filtration ... 25
II.16.2.6. SDS Gel Electrophoresis ... 25
II.16.3. Biochemical and Biophysical Methods ... 26
II.16.3.1. Determination of Protein Concentration by Absorption Spectroscopy ... 26
II.16.3.2. Fluorescence Spectroscopy... 26
II.16.3.3. Stopped Flow Apparatus... 26
II.16.3.4. Isothermal Titration Calorimetry... 27
II.16.3.5. Reverse-Phase HPLC ... 27
II.16.4. Light Scattering ... 27
II.16.5. Crystallisation ... 28
II.16.6. Cell Biology ... 28
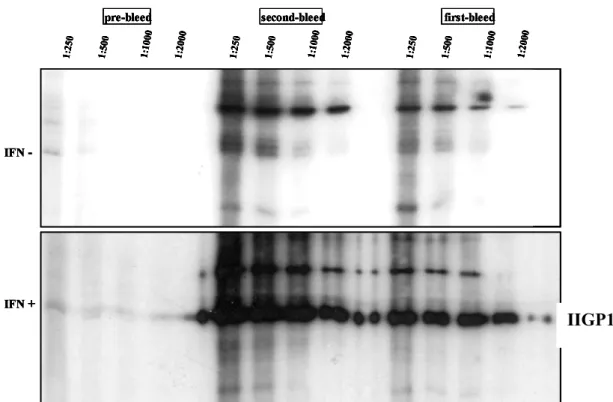
II.16.6.1. IIGP1 Specific Polyclonal Rabbit Antiserum... 28
II.16.6.2. Western Blot ... 30
II.16.6.3. Growth and Culture of Eukaryotic Cells ... 30
II.16.6.4. Immunofluorescence... 31
II.16.6.5. Cellular Fractionation ... 31
II.16.6.6. Immunoprecipitation ... 32
II.16.6.7. Analytical Gel Filtration ... 33
III. RESULTS I ... 34
III.A. Biochemical and Cellular Studies on IIGP1 ... 34
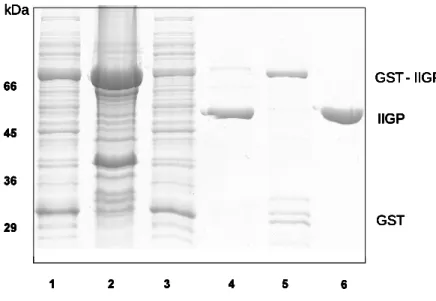
III.A.1. Recombinant IIGP1 Expression and Purification... 34
III.A.2. Biochemical Characterisation of IIGP1... 35
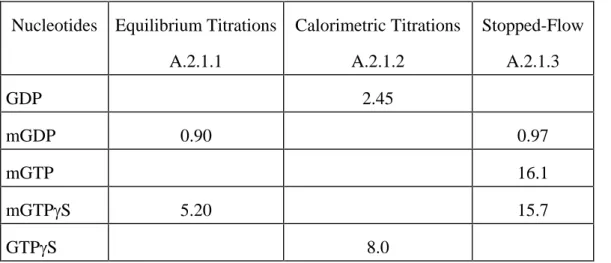
III.A.2.1. Nucleotide Binding Features ... 35
III.A.2.1.1. Equilibrium Titrations ... 35
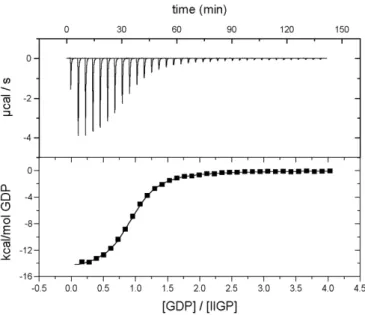
III.A.2.1.2. Isothermal Titration Calorimetry... 37
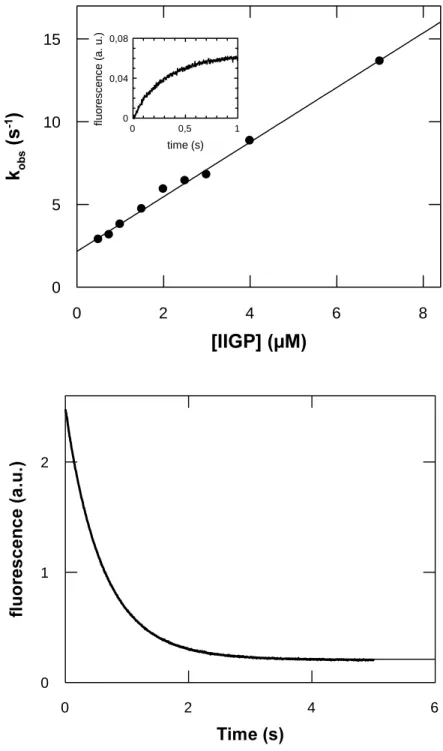
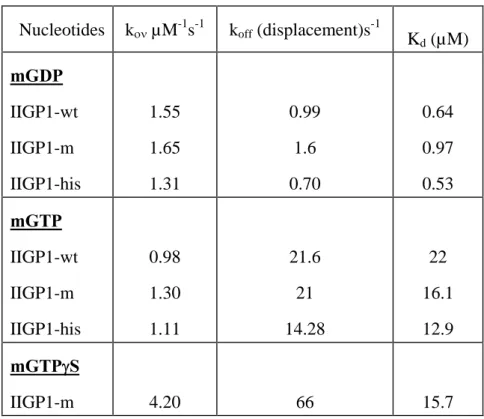
III.A.2.1.3. Dynamics of Nucleotide Binding ... 37
III.A.2.2. GTP Hydrolysis ... 40
III.A.2.3. Oligomerisation ... 42
III.A.2.3.1. Time and GppNHp Dependent Oligomerisation... 42
III.A.2.3.2. C-terminal end is Essential for the Formation of Higher Molecular Species... 43
III.A.2.3.3. Fluorescence Scattering Experiments... 43
III.B. Cellular studies on IIGP1... 45
III.B.1. Localisation Studies on IIGP1 ... 45
III.B.2. Distribution of IIGP1 in the Cell ... 47
III.B.3. Interaction Molecules ... 48
III.B.3.1. Size Exclusion Chromatography ... 48
III.B.3.2. Immunoprecipitation ... 50
III.B.3.2.1. Immunoprecipitatation of IIGP1 in MEFs with α 165 ... 50
III.B.3.2.2. Co-precipitation of IIGP1 and Partners with α 165 in MEFs... 50
III.B.3.2.3. α 165 can also Co-precipitate the Same Molecules in L929 cells... 51
III.B.3.2.4. Immunoprecipitation with the Monoclonal Antibodies... 54
III.B.4. Properties of Membrane Associated IIGP1 ... 55
III.B.4.1. Myristoylation is Important for Membrane Attachment ... 55
III.B.4.2. C-terminal Mutants... 56
III.B.4.3. Myristoylation Independent Association to the Membrane... 59
IV. RESULTS II... 61
IV.A. Structural and Mutational Analysis ... 61
IV.A.1. Crystal Structure of IIGP1... 61
IV.A.2. Features of IIGP1-GDP and the IIGP1-GppNHp Complex... 62
IV.B. Mutational Analysis ... 64
IV.B.1. Biochemical Features ... 67
IV.B.1.1. Analysis of the Binding Mutants... 67
IV.B.1.2. Analysis of the Interface Mutants... 68
IV.B.1.2.1. Analysis of the Nucleotide Binding Parameters of the Interface Mutants ... 68
IV.B.1.2.2. Studies on GTP Hydrolysis ... 68
IV.B.1.3. In vivo Characterisation of the IIGP1 Mutants... 70
IV.B.1.3.1. Cellular Localisation of the Binding and the Interface Mutants ... 70
IV.B.1.3.2. Cellular Distribution of the Binding and the Interface Mutants... 71
V. DISCUSSION ... 73
V.1. Nucleotide Binding Parameters of IIGP1 in Comparison to Several GTPases... 73
V.2. Significance of GTP Hydrolysis... 75
V.3. Relationship of IIGP1 to the Family of Dynamin Like Large GTPases ... 78
V.4. Nucleotide Dependent Self Assembly... 79
V.5. Association of IIGP1 with Membranes ... 83
V.6. Cellular Localisation ... 84
V.7. Functional Cues for IIGP1... 85
V.8. IIGP1 in the p47 Family of GTPases ... 85
V.8. Proposed Function ... 86
VI. REFERENCES... 87
VII.SUMMARY... 99
VIII. ZUSAMMENFASSUNG ... 101
IX. ACKNOWLEDGEMENT ... 103
X. ERKLÄRUNG ... 105
XI. PUBLICATIONS... 105
XII. LEBENSLAUF... 106
I. INTRODUCTION
I.1. Infection & Immunity
Host-Pathogen interactions demonstrate dynamism in evolutionary processes. Pathogens try to contact, colonize, infect, evade, and damage the host through many virulence factors such as adhesins, invasins, evasins, toxins (endotoxin/exotoxin). The host on the other hand, mobilises several defence mechanisms to arrest their dissemination, to prevent damage, and expel the invaders. Consequentially, the millions of years of reciprocity and antagonism have led both the systems to have highly evolved mechanisms of evasion and survival, the host with respect to its immune system, and the pathogen to subterfuge (Casadevall and Pirofski, 2001; Levy and Garcia- Sastre, 2001; Ganusov et al., 2002; Roy and Kirchner, 2000; van Baalen, 1998). Innate immunity is an ancient defence mechanism common to both plants and animals. It serves as the first line of defense against external attack, that includes the recognition of pathogen associated molecular patterns (PAMPs) by genome encoded pattern recognition receptors (PRRs) like the Toll like receptors (TLRs) conserved from Drosophila to mammals. Besides, the innate system primes the adaptive immune sytem, which is specific to vertebrates and has the ability to adapt and remember the infectious pathogen. The adaptive system together with the innate system provide optimal host defence (Janeway, Jr. and Medzhitov, 2002; Spriggs and Sher, 1999; Ploegh, 1998).
The immune system mounts a complicated response to infection by co-ordinating several types of
white blood cells. The cells that govern the innate system bear the recognition receptors, which are
germ-line encoded, in the macrophages, dendritic cells (DCs), mast cells, neutrophils, eosinophils,
and natural killer cells (NKs). They are activated during an inflammatory response (a localised
protective reaction of tissue to infection or injury to rapidly combat microbes) without recourse to
adaptive immunity. Nevertheless, the stimulation of the adaptive response becomes necessary when
the innate system is unable to deal with pathogen challenge. The innate system therefore, induces
the expression of co-stimulatory molecules on the surface of antigen presenting cells, induces the
secretion of appropriate cytokines and chemokines directing the lymphocytes to the appropriate
locations in the body. Since the recognition receptors of the antigen-specific adaptive system are
encoded in gene segments (T and B lymphocytes), there is a wide range of possible variability in
immune recognition. However, autoimmune disease and allergy are the main disadvantages of such
a permutation, but are normally held in check by several layers of inhibitory mechanisms of the
vertebrate immune system.
Therefore the two distinct immune mechanisms of innate and adaptive immunity work together to discern the pathogen, expel the pathogen, prevent self damage, and derive protection (Abbas and Janeway, Jr., 2000; Janeway, Jr. and Medzhitov, 2002).
I.2. Cytokines as Mediators of Innate and Adaptive Immunity
The stimulation of cytokine production is crucial for the development, differentiation and regulation of the immune response. The adaptive immune response involves humoral or circulating antibody (B cells) and cell mediated immunity (T cells) which identifies antigens (foreign proteins, polysaccharides, peptides etc.) either as part of a pathogen or as a partially degraded by-product.
The immune system defends the body by maintaining an elaborate and dynamic communication network of regulatory molecules, the cytokines. The multiple functions of cytokines include hematopoiesis, chemotaxis, angiogenesis, embryogenesis. They play a crucial role in regulating the extent and the duration of the immune response by stimulating or inhibiting the activation, proliferation, and /or differentiation of various cells and by regulating the secretion of antibodies or other cytokines (Hirano, 2002; Spriggs, 1999). The cytokines of immune origin mediate and regulate innate immunity through the activation of type 1 interferons, tumor necrosis factor alpha (TNF- D ), interleukins IL1, IL6, IL10, IL 12, IL 15 and chemokines. They also mediate specific immunity through the stimulation of IL-2, IL-4, IL-5, IL-13, IL-16, IL-17, interferon- J (IFN- J , transforming growth factor (TGF- E ) and lymphotoxin. The cellular response to cytokines involves complex modulation of the immune and inflammatory responses (O’Shea et al., 2002).
Among the heterogenous family of multifunctional cytokines, interferons were first recognised for
their ability to induce cellular resistance to viral infection. They function by integrating early innate
responses with later events mediated by the adaptive immune system. The IFNs are categorised into
two distinct groups based on their protein sequences, cellular sources and the use of distinct
receptors. Type I interferons include a number of IFN- D sub-types (ten different) and a single
species of IFN- E (humans and mice), IFN- Z (humans) and IFN- W (ruminants). They are produced
by all cells, and predominantly by a sub-population of immature dendritic cells (DCs) during
infections. Type II interferon contains a single member IFN- J , produced by a few specialised cells
like the activated natural killer cells (NKC), Th1 subset of the T cells, activated dendritic cells and
macrophages. The expression of IFN- J by Th1 cells is the essential bridge where the adaptive
immune response reinforces macrophage based innate immunity (Hirano, 2002; Levy, 2002; Liew,
2002; Spriggs, 1996; Spriggs,1999).
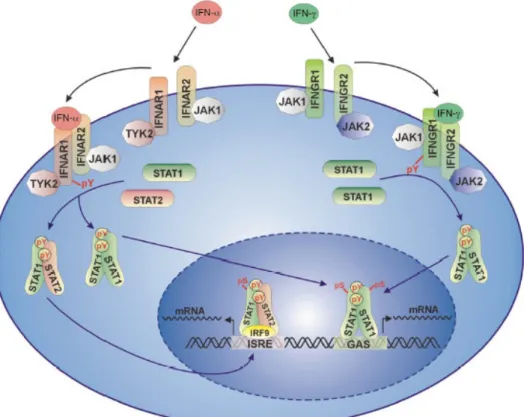
Figure 1.1 The Jak-STAT pathway of IFN DE and IFN- J (Decker et al., 2002).
The IFN- DE and the FN- J binding to their respective receptors activate the Jak-STAT pathway, followed by the translocation of the STAT homodimers, alone or with other transcription factors regulating the expression of a vast subset of genes.
Interferons bind to specific transmembrane receptors or receptor complexes on target cells, and
rapidly alter the pattern of gene expression as shown in figure 1.1. They exert biological activities
by binding to their specific receptors, the type 1 receptor (IFNAR), a heterodimer comprising of
IFNAR1 and IFNAR2 chains, and the IFN- J receptor (IFNGR) forming a heterotetrameric complex
with the two D and E chains. The receptor-ligand complex formation leads to the activation of
cytoplasmic proteins of the Janus kinase family, Jak1 and Tyk 2 for IFN- DE and Jak1 and Jak2 for
IFN- J . This allows the binding of the signal transducers and activators of transcription (STAT) to
the receptor phosphotyrosine residues created by the kinases on the receptor, followed by
phosphorylation, and homo- or heterodimerisation of the STATs. The STAT heterodimer is used by
the IFN DE pathway along with another DNA binding subunit IRF-9, forming a heterotrimeric
transcription factor complex (ISGF3). This complex is translocated to the nucleus and binds to
specific sites in the promoter regions, the interferon stimulated response element (ISRE) leading to
the expression of target genes essential for innate antiviral immunity. The STAT homodimers that
are activated by the IFN- DE or IFN- J pathway, termed IFN- J activating factor (GAF), recognise
the gamma interferon associated sequence (GAS) promoter sequence, thereby regulating a vast
subset of genes involved in innate and adaptive immunity (Boehm et al., 1997; Aaronson and Horvath, 2002; Levy and Darnell, Jr., 2002; Ikeda et al., 2002; Decker et al., 2002; Ihle, 1995; Ihle, 2001). The IFN- DE or IFN- J pathways activate an overlapping set of genes via the Jak-STAT pathway (Levy and Garcia-Sastre, 2001; Sato et al., 2001).
Although the cellular responses to IFN seems complex, with a regulation of several hundred genes, they can be described in terms of specific programmes conferring innate and adaptive resistance.
The resistance conferred against pathogens is mediated by interactions between cells such as NK cells, T helper cells, cytotoxic T lymphocytes and macrophages with infected cells. Thus cytotoxic T lymphocytes recognise peptides derived from viral proteins when presented on the surface of infected cells in association with class I molecules of the major histocompatibility complex (MHC).
This interaction leads to the lysis of the infected cell (Braciale et al.,1987, Cresswell et al., 1997).
Macrophages phagocytose apoptotic cells by recognising ligands not present on normal cells (Henson et al., 2001). In contrast to the immune response based on cell-cell interactions as mentioned above, a cell-autonomous pathogen resistance mechanism has also been described. Such a resistance mechanism activated by interferons leads to intracellular pathogen inactivation, and a detailed account of the proteins modulating this function is discussed below.
I.3. Interferon Dependent Cell Autonomous Resistance
In contrast to the indirect modulation of the immune response to pathogens by interferons, e.g the upregulation of antigen processing and display of viral epitopes at the surface of infected cells, interferons can directly protect cells by inducing intracellular resistance programmes. Such IFN induced cell autonomous resistance involves many different programmes, functioning in different ways, as for example 2’-5’Oligoadenylate synthetase (OAS), PKR, NO, Nup 96/ Nup 98, Mx proteins (see table 1.1).
The IFN inducible 2’-5’ Oligoadenylate synthetase (OAS) is activated by ds RNA generated during viral infection. Activated OAS catalyses the synthesis of 2’-5’ oligoadenylates, which binds to monomeric RNase L. This interaction results in the dimerisation and activation of RNase L, leading to the inhibition of protein expression by cleaving both the mRNA and rRNA in the cytoplasm, thereby arresting viral replication (Samuel, 2001). Protein kinase R is a ubiquitously expressed interferon inducible serine/threonine kinase. It is activated by dimerisation after binding to dsRNA.
The eukaryotic initiation factor 2 D (eIF2 D ), one of the substrates of PKR, upon phosphorylation
looses its activity resulting in the inhibition of protein synthesis. PKR has been demonstrated LQ
YLWUR to be important in the inhibition of encephalomyocarditis virus, HIV, and VSV replication
product NO are known to carry out nitrosylation of viral proteins (Bogdan, 2001). NO chemically modifies cysteine and tyrosine residues presumably disrupting protein function (by impairment of folding and/or disruption of disulphide bonds within the protein). Intracellular resistance has also been shown in the case of nup 96/nup 98 proteins which have increased levels of expression in response to IFN- J treatment. The vaccinia virus M protein binds to nucleoporin 96 (nup96) /nup98 and acheives mRNA export block. It has been suggested that the increased levels of these proteins saturate the inhibition caused by M protein by providing enough nup98 to mediate mRNA export (Enninga et al., 2002). Several other IFN inducible proteins which confer intracellular pathogen resistance are described in the reviews (Samuel, 2001; Guidotti and Chisari, 2001)
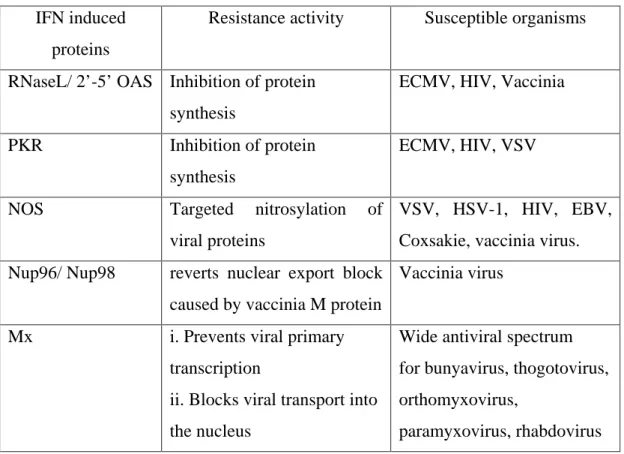
Table 1.1 Programmes of some of the IFN induced proteins conferring antiviral resistance (modified from Chesler and Reiss, 2002)
IFN induced proteins
Resistance activity Susceptible organisms
RNaseL/ 2’-5’ OAS Inhibition of protein synthesis
ECMV, HIV, Vaccinia
PKR Inhibition of protein synthesis
ECMV, HIV, VSV
NOS Targeted nitrosylation of
viral proteins
VSV, HSV-1, HIV, EBV, Coxsakie, vaccinia virus.
Nup96/ Nup98 reverts nuclear export block caused by vaccinia M protein
Vaccinia virus
Mx i. Prevents viral primary transcription
ii. Blocks viral transport into the nucleus
Wide antiviral spectrum for bunyavirus, thogotovirus, orthomyxovirus,
paramyxovirus, rhabdovirus
I.3.1. Interferon Inducible GTPases Contributing to Cell Autonomous Resistance
There has been growing evidence for intracellular resistance provided by families of
interferon inducible GTPases, three of those are described below. Mx GTPases are considered a
paradigm for this mechanism where resistance is conferred by destructively interfering with the
life-cycle of pathogens.
I.3.1.1 Mx GTPases
The Mx proteins are interferon inducible large GTPases localised either in the cytosol (human MxA and Murine Mx2) or in the nucleus (murine Mx1). They confer viral resistance by binding to specific viral components. The cytosolic MxA binds to the nucleocapsids of the Thogotovirus (THOV) thereby preventing viral transport to the nucleus. As a consequence, the primary transcription that takes place in the nucleus is inhibited (Kochs and Haller, 1999). The nuclear mouse Mx1 protein inhibits Influenza A virus (FLUAV) and THOV multiplication also at the level of primary transcription of the viral genome. It is suggested that the Mx1 targets and binds the PB2 subunit of the viral polymerase resulting in the inhibition of viral transcription (Pavlovic et al., 1993)
I.3.1.2. p65 GTPase Family/ GBPs
The p65 family/ GBPs are highly conserved in vertebrates, in chicken, rat, mouse and man
(Cheng et al., 1991; Strehlow et al., 1994; Asundi et al., 1994; Vestal et al., 1998, Wynn et al.,
1991; Han et al., 1998; Schwemmle et al., 1996). The family comprises four members in the Mouse
(mGBP1, mGBP2, mGBP3, mag-2, mGBP5) (Nguyen et al., 2002) and two in Humans (hGBP1,
hGBP2) (Neun et al., 1996) with a molecular mass of 65-71 kDa. They are induced by IFN DE and
strongly by IFN- J (Prochazka et al., 1985). mGBPs (1-5) are absolutely dependent on the primary
transcription factor IRF-1 (Boehm et al, 1998). They possess the canonical GTP binding motifs
GxxxxGKS and DxxG, but instead of the (N/T)KxD motif which is believed to confer guanine
specificity in other guanine nucleotide binding proteins (Cheng et al., 1991), they have a differently
structured segment in which arginine and aspartic acid interact with the base through interactions
till now unique to this GTPase family (Praefcke et al., 1999). They bind GTP, GDP and GMP with
similar affinity, and are able to hydrolyse GTP to GMP through a trapped GDP intermediate
(Cheng et al., 1991; Praefcke et al., 1999; Staeheli et al., 1984; Schwemmle et al., 1996). With the
exception of mGBP3 and mag2 (Wynn et al., 1991; Han et al., 1998), all GBPs have an
isoprenylation sequence at the C-terminus, which is functional LQ YLYR and LQ YLWUR , but the
significance of this modification is unknown since they are predominantly cytosolic (Nantais et al.,
1996). Moreover, it has been shown to be a mediator of inflammatory cytokines inhibiting
endothelial cell growth (Guenzi et al ., 2002). mGBP2 has also been claimed to have a role in IFN-
J induced murine fibroblast proliferation (Gorbacheva et al., 2002). hGBP1 is shown to be
upregulated in mammary tumors (Sun et al., 1999) and during erythroid differentiation (Han et al.,
1998). The only evidence for cell autonomous resistance in the p65 family comes from experiments
with hGBP1 where it shows antiviral activity against vesicular stomatitis virus (VSV) and Encephalomyocarditis virus (ECMV) (Anderson et al., 1999).
I.3.1.3. The p47 GTPase Family
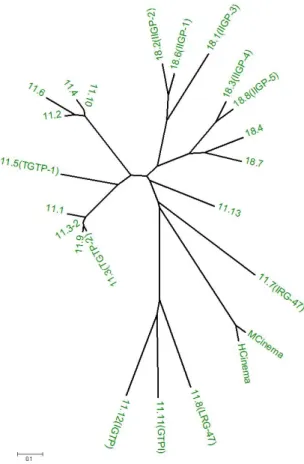
The p47 GTPases are encoded by 22 genes in the mouse, and represent a distinct sequence and structural family. They possess all the GTP binding motifs (Bourne et al., 1990; Bourne et al., 1991), all but one of the mouse p47 genes are distributed between two clusters on chromosome 11 and chromosome 18. The exception is mCINEMA, encoded on Chromosome 7. According to the remarkable substitution of a methionine for the ubiquitously conserved lysine in the GxxxxGKS (G1 motif) which correlates with further features, three of the p47 GTPases define, the GMS subfamily (Boehm et al., 1998). The second number is given based on the order of arrangement in the chromosome for each sub family. An unrooted phylogeny based on the amino acid sequence is shown in figure 1.2.
Figure 1.2. The phylogeny of the p47 GTPases (Bekpen.et al unpublished data)
Neighbour joining tree based on distance method :- Amino:Poisson correction [pairwise distances]. It is tested using
bootstrap test and shows high reliable branching pattern (The data not shown). Alignment of proteins was made by
using default option of ClustalW 1.8 BCM (Baylor College of Medicine). Program used for construction of the trees
MEGA2; Molecular 1991; Evolutionary Genetics Analysis (Kumar et al., 2001)
An extraordinary aspect of the phylogeny of the p47 GTPases is that this complex branching tree of multiple genes is (so far) present only in Murid rodents (Mouse, Rat, Hamster). In other mammalian groups (ungulates, carnivores, primates), only the single outlying p47 gene on mouse chromosome 7, mCINEMA, has a homologue, so far as is known, and this indeed a very close one (90,1% identity in humans).
The inducibility of all the p47 members has been documented to be dependent on IFN- J (Boehm et al., 1998), where LRG47, IRG47, TGTP/Mg21, IGTP show similar kinetics of induction (Sorace et al., 1995; Taylor et al., 1996). Some of them are stimulated more weakly by IFN DE and also by bacterial lipopolysaacharide (LPS). (Taylor et al., 1996), Lafuse et al., 1995, Sorace et al., 1995, Carlow et al., 1998, Zerrahn et al., 2002). IIGP induction by LPS has been shown to be dependent on LPS-mediated induction of type I interferon (Zerrhan et al., 2002, Lapaque et al., manuscript in preparation). LRG-47, IIGP, TGTP/Mg21 are also induced by graft versus host reaction (GVHR) in mice (Wakui et al., 2001), presumably by generalised release of interferons. p47 family members have generally very low constitutive levels of transcription (Boehm 1998). They are described to be early genes as they are transcribed independent of ongoing protein synthesis (TGTP/ Mg21, IGTP, LRG47 (Lafuse et al., 1995; Taylor et al., 1996). They are shown to be inducible by several cell types either immune or non-immune; IFN J stimulated primary mouse embryonic fibroblasts, mouse macrophage cell line ANA-1; IIGP, GTPI, LRG47, IRG47, TGTP, IRG47 (Boehm et al., 1998), TGTP/Mg21 was also expressed in L-cells, fibroblasts, NIH3T3 cells, B cells, mouse peritoneal macrophages, macrophage cell lines (J774, P388DI, RAW 264.5 macrophages), in purified CD4+
CD8+ T cells, and P815 mastocytoma (Carlow et al., 1998); and IGTP in immune cells such as
macrophages, T cells, B cells and non immune cells such as fibroblasts and hepatocytes (Taylor et
al., 1996), Lafuse et al., 1995), IRG 47 in Pre-B and B lymphocytic cell lines (Gilly and Wall,
1992), LRG47 in RAW 264.5 macrophages (Sorace et al., 1995). Infection seems to upregulate
IIGP as observed in /LVWHULDPRQRF\WRJHQHV infected bone marrow macrophages, endothelial cells,
activated T cells (Zerrahn et al., 2002), in /PRQRF\WRJHQHV infected mouse liver and also in
Scrapie infected brain tissue (Riemer et al., 2000). However, all the members are independent of the
TNF pathway as shown by normal induction following infection of TNFRp55
-/-mice with
/PRQRF\WRJHQHV ( Boehm et al., 1998). Expression of IGTP mRNA in several mouse tissues
revealed significant expression in the thymus and lower expression in the spleen, lung and small
intestine; and the expression in the brain, heart, kidney, liver, skeletal muscle, and testes was very
However, recent data from the lab show (Jia Zeng., unpublished results) IIGP1 and IGTP expression predominantly in the liver, and also in other tissues of wild type and IFN receptor deficient mice.
There is irresistible evidence for the antimicrobial activity of the p47 GTPase proteins, as shown by infection studies in mice with targeted gene disruptions. Mice deficient in LRG47, IGTP, and IRG47 are highly susceptible to 7R[RSODVPD JRQGLL ; LRG-47 deficient mice are additionally susceptible to / PRQRF\WRJHQHV (Collazo et al., 2001; Taylor et al., 2000). That at least a component of p47-mediated resistance is cell autonomous has been demonstrated for 7JRQGLL in astrocytes. Astrocytes lacking IGTP cannot mount gamma-interferon-dependent resistance to infection with 7JRQGLLLQYLWUR (Halonen et al., 2001). Furthermore, cells transfected with TGTP showed relative resistance to plaque formation by vesicular stomatitis virus (VSV) but not herpes simplex virus (HSV) (Carlow et al., 1998).
The strong interferon inducibility of the p47 GTPases suggests a defined adaptive function associated with disease resistance. How this relates to the biochemical nature of these proteins as GTPases is an unsolved puzzle. Generally, GTPases are proteins involved in regulating complex cellular processes through conformational changes associated with their nucleotide bound states, either GTP or GDP, defining affinities for several molecular interactions respectively, thereby modulating their function.
I.4. GTPases, Functions and Features
Many fundamental cellular processes are regulated by GTPases with a common principle of GTP binding and hydrolysis (Bourne, 1991). The principal action of GTPases has been studied in depth for p21 Ras in the control of cell growth and differentiation (Reuther, 2000), EF-Tu, EF-Ts for initiation, elongation and termination factors in protein synthesis (Rodnina., 2001), for G protein D chains in transmembrane signalling (Bourne, 1993 Hamm, 1997), for ARF GTPases in membrane trafficking (Donaldson, 1999) and for Ypt/Rab GTPases in vesicular targeting (Segev, 2000). Most of the GTPases have a conserved mechanism with a cycle of GTP and GDP bound forms, where the exchange of GDP to GTP turns on the switch and GTP hydrolysis turns it off, although there are a few exceptions.
The binding of GTP induces a change in the affinities for other macromolecules mediating key
cellular functions. The GTPases are therefore regulated both at the level of GTP hydrolysis and at
the level of exchange of GDP for GTP by several other proteins. For example, GTPase activating proteins (GAPs) accelerate the hydrolysis of GTP and thereby turning off the GTPase switch, while the guanine nucleotide exchange factors (GEFs) turn on the switch by increasing the rate of GDP dissociation (Bourne, 1991).
PHVVDJH 6LJQDO
*'3
*()
*$3
*73
*'3
3
L“off”
“on”
*73
PHVVDJH 6LJQDO
*'3
*()
*$3
*73
*'3
3
L“off”
“on”
*73
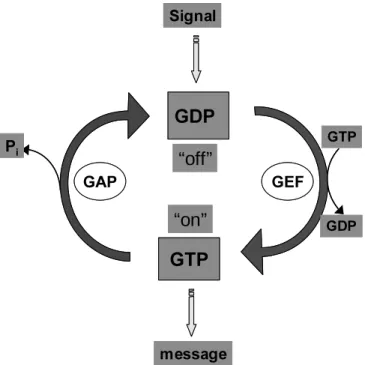
Figure 1.4. Simplified depiction of the GTPase cycle ( Bourne et al., 1991).
The switch GTPases cycling between OFF and ON states. Activation requires dissociation of protien bound GDP, is intrinsically a slow process that is accelerated by guanine nucleotide exchange factors (GEFs). The hydrolysis of GTP to GDP is intrinsically very slow and thus has to be accelerated by the GTPase activating proteins (GAPs).
The GTPase cycle in some small GTPases like Rho, and Rabs is also regulated by guanine nucleotide dissociation inhibitors (GDIs). GDI is specifically a protein inhibitor of the Rab and Rho GTPases which prevents GDP dissociation, and escorts the GTPase in the cytosol, until it reaches the membrane where it is activated (Wu et al., 1996). In addition, another regulatory molecule called the GDI displacement factor (GDF) is active on a subset of Rab proteins and is devoid of exchange activity (Olofsson, Novick).
I.4.1. Characteristic Features of the GTPase domain (G domain)
The G domain is highly conserved in all guanine nucleotide binding proteins. The conserved
G domain has a typical fold consisting of a mixed six-stranded E sheet and five helices. The
site. The most important contributions to nucleotide binding is made by the G1 motif, designated as the phosphate binding loop (p-loop) which interacts with the E and J phosphates, the N/TKxD sequence (G3 motif) contacts the nucleotide base. The specificity to guanine is derived by the Asp side chain from the G4 motif, DxxG, which forms a hydrogen bond with the base, and also a main chain interaction with the invariant Ala from the G5 motif (SAK). The nucleotide bound form stabilises two flexible regions termed the switch regions. switch I (forming the G2 motif) comprising the invariant threonine and the switch II (comprising the G4 motif) with the invariant glycine interacting with the J phosphate.
All the members of the heterotrimeric G proteins, several Ras related proteins like Ras, Rab, Ral, Rac, rho, Cdc42, Arf, Arl, Rab, Ran have the canonical GTP binding motifs as well as the conserved fold for the G domain. The G domains of the signal recognition particle SRP and its receptor SR show a divergent topology of the E sheet, in addition to extensions and insertions.
Tubulin and the bacterial homologue FtsZ deviate structurally from these proteins with respect to their G domain.
The switch regions are not only conserved in GTPases, but also within the family of ATP-binding motor proteins. Kinesin and myosin have switch regions which sense the presence of a J phosphate, the release of which is coupled to production of mechanical energy. The switch I region here contains a conserved serine and the switch II region comprises the same DxxG motif with an invariant glycine forming a main chain contact to the J phosphate.
I.4.2. Deviation from the Switch GTPases
The GTP bound form is critical for transducing downstream cellular functions among many GTP binding proteins. The large GTPase dynamin participates in clathrin mediated endocytic processes and endocytosis via caveolae. The fact that the large GTPase dynamin could sever clathrin coated vesicles from plasma membrane upon GTP hydrolysis started a debate on the functioning of dynamin. Whether dynamin is a mechanochemical enzyme using the energy of hydrolysis for its effector function or a switch GTPase using the time from GTP binding to GTP hydrolysis for signal transduction? The switch GTPases have a very high affinity for GTP, a very slow rate of GTP hydrolysis and do not release GDP easily. In contrast mechanoenzymes such as dynein, kinesin and myosin have a low affinity for ATP, a high rate of ATP hydrolysis and readily release ADP. Dynamin like most motor proteins is a large protein, around 100 kDa, has low affinity for nucleotides, high rate of GTP hydrolysis and readily releases the hydrolyzed nucleotide. In addition, like muscle myosins and flagellar dyneins, dynamins assemble into complex polymers.
Consistently, it has been shown that GTP binding alone is insufficient to support endocytosis, but
GTP hydrolysis which allows for a conformational change in the protein is necessary. The carboxy terminus of dynamin contains a proline rich domain (PRD) that extends to interact with SH3 domain containing proteins which implicates dynamin in signalling (Schmid et al., 1998). Up to now, dynamins have been shown to participate in both cell signalling and vesicle formation (sweitzer et al., 1998; zhang et al ., 2001) through “effector binding” and “constriction of the membrane” respectively.
The prime objective of the work is to understand the GTPase functions of the IFN inducible p47 GTPases, and how they exercise their resistance function.
I.5. Objective of this Work
IFNs promote protection of the host by activating the Jak-STAT pathway to mediate rapid transcriptional induction of several hundred genes. Deletion of any of the components of this system highlights their importance for the proper functioning of the immune system. Since, many genes are induced or repressed by IFNs, and the functional roles of only a few have been described, it seems plausible that there are many more mechanisms to be unravelled in order to understand the complex cellular response in full. For example although mice deficient for the three-major IFN mediated antiviral pathways, PKR, RNase L and Mx were indeed sensitive to viral infection, were nevertheless able to mount a measurable antiviral response after IFN treatment and show greater resistance to infection than mice lacking IFN DE receptors or Stat1 (Zhou et al., 1999). This provides clear evidence for the existence of other uncharacterized interferon-dependent pathways.
Therefore it seems important to look at the functions of other IFN induced genes, to understand the complex cellular response of this cytokine.
The p47 family and the p65 family of GTPases are abundantly induced by IFNs, and since their presence is necessary for the survival of the individual (not shown for p65), they probably have a defined role in the IFN response against specific pathogens. Localisation studies reveal the association of the p47 GTPases with the intracellular membranes (Sascha Martens unpublished data, Zerrahn et al., 2002, Taylor et al., 1997) suggesting their role in the processing of proteins or lipids, or in the vesicular trafficking pathway. It is a hypothesis that IIGP1 might be protecting the cell by interfering with the life cycle of specific pathogens. By doing so, it probably prevents the exploitation of the ER/Golgi membrane by the pathogens.
The objective of this study is to contribute to an understanding of the function of the p47 family of
GTPases, specifically of IIGP1, by analysis of the biochemical properties and structure. This will
other p47 GTPases in cells. The p47 GTPases are apparently present only in the Muridae, yet understanding the mechanism of action of these GTPases could, firstly, help us in understanding the whole spectrum of the IFN response. Secondly, they may help us to identify the systems that compensate for the absence of the p47 family in humans. Thirdly, they will help us to describe the uniqueness of the immune system in different organisms. Finally, we will gain insight into an aspect of pathogen vulnerability that is not apparent from human systems.
The work presented here attempts to understand the functioning of IIGP1. The first part of the work
emphasizes the GTPase properties of IIGP1 by LQ YLWUR biochemical characterization. A detailed
analysis of the nucleotide binding affinities of IIGP1, the kinetics of the binding reaction, and the
kinetics of GTP hydrolysis have been investigated using various biochemical and biophysical
methods. This part also describes cellular studies of IIGP1, concerning its location and distribution
in the cell, and preliminary studies to identify interacting molecules. The second part describes the
structure of IIGP1 and a programme of site-dircted mutagenesis directed at the nucleotide binding
site and residues involved in putative homotypic molecular interactions, and their LQ YLYR and LQ
YLWUR characterisation.
II. MATERIALS AND METHODS
II.1. Chemicals and Other Accessories
All chemicals were purchased from Aldrich (Steinheim), Amersham-Pharmacia (Freiburg), Applichem (Darmstadt), Baker (Deventer, Netherlands), Boehringer Mannheim (Mannheim), Fluka (Neu-Ulm), GERBU (Gaiberg), Merck (Darmstadt), Pharma-Waldhof (Düsseldorf), Qiagen (Hilden), Riedel-de-Haen (Seelze), Roth (Karlsruhe), Serva (Heidelberg), Sigma-Aldrich (Deisenhofen), ICN biochemicals, Oxoid, Hampshire UK, DNA standard markers from Gibco-BRL (Eggenstein), Agarose for gel electrophoresis from FMC, Bioproducts, Rockland, Maine USA, developing and fixing solution for western blot detection from G158, AGFA, Luminol (Sigma), P- coumaric acid from Fluka. Deionised and sterile water (seral
TM) was used for all the buffers and solutions, Ultra pure water derived from Beta 75/delta UV/UF from USF Seral reinstwassersysteme GmbH, Ransbach, Baumbach equipped with UV (185/254nm) and ultrafiltration (5000 kd cut off).
pH values are adjusted for room temperature unless specified.
II.2. Materials
Sterilefilter FP 030/3 0,2 m and ME 24 0,2 m (Schleicher and Schüll, Dassel) Ultrafiltration device VIVASPIN 10, 30 (Vivascience (Lincoln, USA)
Nitrocellulose transfer membrane PROTRAN (Schleicher and schüll, Dassel) 3MM Whatmann paper (Sigma)
100 Sterican 0,50 x 16mm hypodermic needles(B/Braun, Melsungen AG) 0.2µM and 0.45µM sterile filters (schleicher and schuell)
Superdex 200 (Amersham Pharmacia, Freiburg)
GSH-Sepharose superflow (Amersham Pharmacia, Freiburg) Protein A Sepharose CL4B (Amersham Phamacia, Freiburg) Film, X-OMAT LS and AR, Kodak, Sigma
All plastic ware for cell culture was from Sarstedt, Nümbrecht and Greiner, Solingen
II.3. Enzymes/Proteins
Restriction Enzymes from New England Biolabs (Bad Schwalbach) or Clonetech (Heidelberg) Protease Inhibitor cocktail, Complete mini (Böhringer), Pefabloc (Roth)
Pyrococcus furiosus (Pfu) DNA Polymerase (Promega, Mannheim) T4 DNA polymerase (New England Biolabs )
RNase A (Sigma)
Shrimp Alkaline Phosphatase (SAP),USB, Amersham)
Thrombin (Serva, Heidelberg) 1Kb ladder for Agarose gels (Gibco)
Rainbow –Molecular weight marker-Precision protein standards
TM( Biorad)
SDS-7 Protein Standard Marker 14.2; 20; 24; 29; 36; 45 and 66 kDa (Sigma, Diesenhofen) SDS-6 protein standard marker 29; 45; 66; 97.4; 116 and 205 kDa (Sigma, Diesenhofen) II.4. Reagent Kits
Plasmid Mini and Midi kit (Qiagen ,Hilden) 4LDTXLFNJHOH[WUDFWLRQNLW (Qiagen, Hilden) 7HUPLQDWRUF\FOH6HTXHQFLQJNLW (ABI PRISM) QuikChange
TM6LWHGLUHFWHGPXWDJHQHVLVNLW
II.5. Vectors
PGW1H ( British Biotech, Oxford, England) pGEX-4T-2 (Amersham Pharmacia, Freiburg)
II.6. Oligonucleotides
All oligonucleotides from Sigma ARK. They are supplied as powder and are resuspended to a final concentration of 10 nMoles. 1 µl used for each PCR reaction.
GTPI-3’ CCCCCCCCGAATTCCATGGAAGAGGCAGTTGAGTCA GTPI-5’ CCCCCCCCGAATTCCTAATGATGATGATGATGATGAGGA TGAGGAATGGAGAGTC
L44R-s CTCAATTTGATTGAAAGAAGGATGAGAAAAGGG L44R-As CCCTTTTCTCATCCTTCTTTCAATCAAATTGAG K48E-s GAATTAAGGATGAGAGAAGGGAATATTC AGTTG K48E-As CAACTGAATATTCCCTTCTCTCATCCTTAATTC K48A-s GAATTAAGGATGAGAGCAGGGAATATTCAGTTG K48A-As CAACTGAATA TTCCCTGCTCTCATCCTTAATTC S172R-s ATTGCCAAAGCAATCAGAATGATG AAGAAGGAA S172R-As TTCCTTCTTCATCATTCTGATTGCTTTGGCAAT
M173A-s ATTGCCAAAGCAATCAGCGCTATGAAGAAGGAATTCTAC M173A-As GTAGAATTCCTTCTTCATAGCGCTGATTGCTTTGGCAAT K82A-s GAGACGGGATCAGGGGCTTCCAGCTTCATCAAT
K82A.-As ATTGATGAAGCTGGAAGCCCCTGATCCCGTCTC
D186N-s GTGAGAACCAAGGTGAATTCTGACATAACAAAT D186N-As ATTTGTTATGTCAGAGTTCACCTTGGTTCTCAC
II.7. Constructs
II. 7.1. pGEX Constructs II.7.1.1. pGEX p47 Constructs
&RQVWUXFWV 1WHUPLQXV &WHUPLQXV ,,*3ZW *63*,3*6770*4
,,*3 *63*,3*6770*4
*73, *63*,3*677037
*73,KLV *63*,3*677037 ,3+3++++++
IGTP *63*,3*6770'/
LRG-47 *63*,3*6770.3
II.7.1.2. pGEX IIGP1 Constructs
&RQVWUXFWV 1WHUPLQXV &WHUPLQXV ,,*3P *63*,3*6770*4
&/./*5/(53+5'
,,*3KLV *63*,3*6770*4
&/51++++++
,,*3PXWDQWV (Interface mutants as well as binding
mutants)
*63*,3*6770*4
&/51
a) Interface I mutants:- L44R, K48A, K48E; b) Interface II mutants :- S172R, M173A;
c) Double mutant :- L44R/S172R [L/S]; d) Binding mutants :- G2V, K82A, D186N.
II.7.2. pGW1H Constructs
&RQVWUXFWV 1WHUPLQXV &WHUPLQXV
,,*3ZW 0*4 &/51
,,*3P 0*4 &/
,,*31P 0 A 4 &/51
,,*3KLV 0*4 &/51
,,*3 0*4 &/51
a) Interface I mutants:- L44R, K48A, K48E; b) Interface II mutants :- S172R, M173A c) Double mutant :- L44R/S172R [L/S]; d) Binding mutants :- G2V, K82A