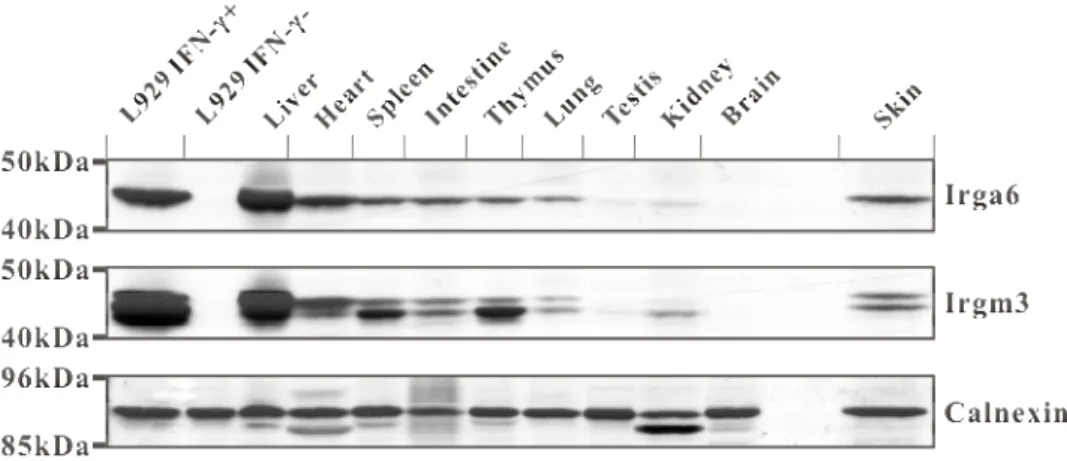
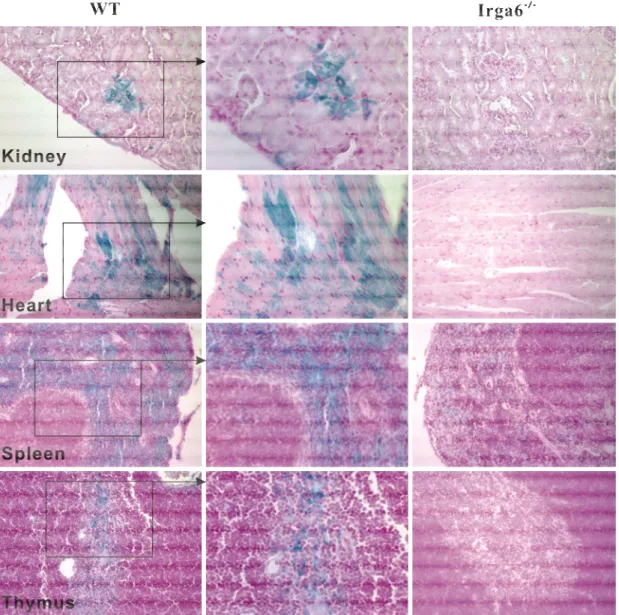
Interferon-induced and Constitutive Expression of Immunity-related GTPases (IRG) in Mouse Tissues
142
0
0
Volltext
(2)
(3)
(4)
(5)
(6)
(7)
(8)
(9)
(10)
(11)
(12)
(13)
(14)
(15)
(16)
(17)
(18)
(19)
(20)
(21)
(22)
(23)
(24)
(25)
(26)
(27)
(28)
(29)
(30)
(31)
(32)
(33)
(34)
(35)
(36)
Abbildung
+7
ÄHNLICHE DOKUMENTE
In the present work, we studied the changes in the expression of the Hepc and other genes, recently observed to be involved in the regulation of iron metabolism, induced in the
After two days in culture, pelota +/+ , pelota +/- and pelota -/- blastocysts hatched from the zone pellucida, implanted onto the tissue culture plastic and form a
Glomeruli without (Glo-) and with arterioles (Glo+), proximal and distal convoluted tubules (PCT/DCT), proximal straight tubules (PST), descending thin limbs
The role for oestrogen as a risk factor for breast cancer in humans is well established while a role for prolactin and growth hormone is less clear.. Ovarian hormone production is
Effect of L-NAME (40 mg/kg, twice a day) on adrenal renin m-RNA levels expressed in relation to an external standard (2 txg of total RNA from control animals).. For
The study at hand presents an analysis of the integration of the AhR and the Wnt/β-catenin signaling pathways into the CYP1A1 promoter as well as the regulatory influence of the
These data show that NUB1L, which binds FAT10 via its C-terminal UBA domains and the 26S proteasome via its N-terminal UBL domain (Schmidtke et al. 2006), accelerates not only the
Carbohydrate epitopes recognized by the blocking antibodies are associated with all stages ofthe parasite [43], but because exposure to large numbers of irradiated cercariae fails
